| Param | Original file | Final file |
|---|---|---|
| Filename | modeM0/AS1A14_102T01_9000006572_57423cztM0_level2.fits | modeM0/AS1A14_102T01_9000006572_57423cztM0_level2_quad_clean.evt |
| Size (bytes) | 566,553,600 | 87,030,720 |
| Size | 540.3 MB | 83.0 MB |
| Events in quadrant A | 8,085,228 | 569,460 |
| Events in quadrant B | 3,154,428 | 627,926 |
| Events in quadrant C | 5,585,556 | 499,749 |
| Events in quadrant D | 3,686,525 | 522,840 |
| Mode M0 | |||
|---|---|---|---|
| Quadrant | BADHDUFLAG | Total packets | Discarded packets |
| A | 0 | 28019 | 1 |
| B | 0 | 13694 | 1 |
| C | 0 | 20870 | 1 |
| D | 0 | 15134 | 1 |
| Mode M9 | |||
|---|---|---|---|
| Quadrant | BADHDUFLAG | Total packets | Discarded packets |
| A | 0 | 12 | 0 |
| B | 0 | 12 | 0 |
| C | 0 | 12 | 0 |
| D | 0 | 12 | 0 |
| Mode SS | |||
|---|---|---|---|
| Quadrant | BADHDUFLAG | Total packets | Discarded packets |
| A | 0 | 120 | 0 |
| B | 0 | 120 | 0 |
| C | 0 | 120 | 0 |
| D | 0 | 120 | 0 |
| Quadrant | Total seconds | Saturated seconds | Saturation percentage |
|---|---|---|---|
| A | 5945 | 551 | 9.268293% |
| B | 5946 | 91 | 1.530441% |
| C | 5946 | 809 | 13.605785% |
| D | 5946 | 188 | 3.161789% |
Noise dominated data is calculated using 1-second bins in cleaned event files. If a bin has >2000 counts, and if more than 50% of those come from <1% of pixels, then it is considered to be noise-dominated and hence unusable.
| Quadrant | # 1 sec bins | Bins with >0 counts | Bins with >2000 counts | High rate bins dominated by noise | Noise dominated (total time) | Noise dominated (detector-on time) | Marked lightcurve |
|---|---|---|---|---|---|---|---|
| A | 7085 | 5946 | 432 | 432 | 6.10% | 7.27% | 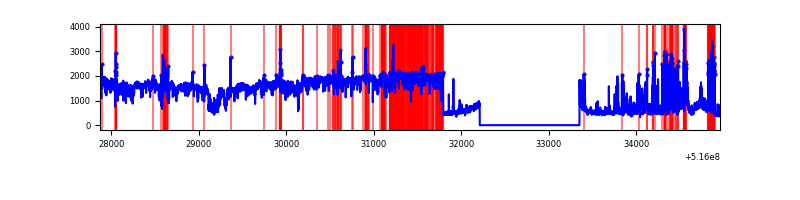 |
| B | 7086 | 5947 | 10 | 10 | 0.14% | 0.17% | 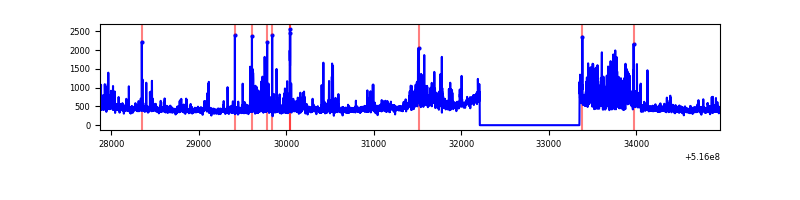 |
| C | 7086 | 5947 | 725 | 725 | 10.23% | 12.19% | 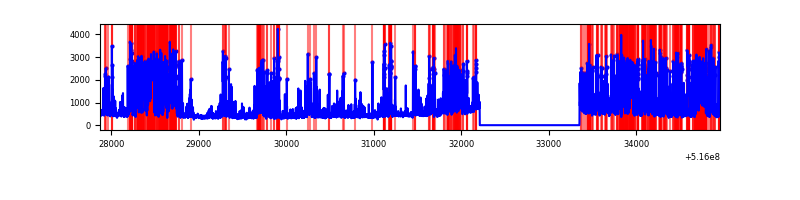 |
| D | 7086 | 5947 | 167 | 167 | 2.36% | 2.81% | 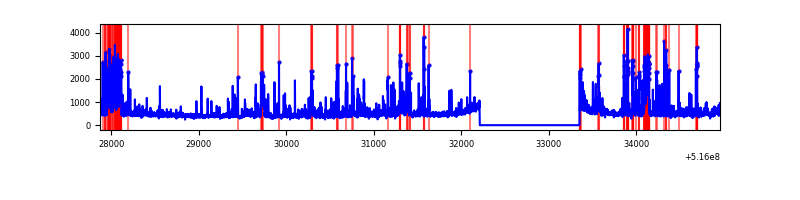 |
Top three noisy pixels from each quadrant. If the there are fewer than three noisy pixels in the level2.evt file, extra rows are filled as -1
| Pixel properties | Quadrant properties | ||||||
|---|---|---|---|---|---|---|---|
| Quadrant | DetID | PixID | Counts | Sigma | Mean | Median | Sigma |
| A | 0 | 12 | 4748561 | 30268.42 | 633 | 618 | 156.9 |
| A | 10 | 251 | 560880 | 3571.7 | 633 | 618 | 156.9 |
| A | 7 | 64 | 264265 | 1680.77 | 633 | 618 | 156.9 |
| B | 0 | 216 | 389491 | 2858.22 | 636 | 612 | 136.1 |
| B | 5 | 185 | 107537 | 785.89 | 636 | 612 | 136.1 |
| B | 0 | 245 | 28808 | 207.24 | 636 | 612 | 136.1 |
| C | 15 | 224 | 2812635 | 17607.79 | 581 | 574 | 159.7 |
| C | 14 | 254 | 255287 | 1594.89 | 581 | 574 | 159.7 |
| C | 6 | 223 | 193240 | 1206.38 | 581 | 574 | 159.7 |
| D | 15 | 142 | 340151 | 1947.08 | 618 | 590 | 174.4 |
| D | 7 | 96 | 265159 | 1517.07 | 618 | 590 | 174.4 |
| D | 8 | 240 | 167144 | 955.04 | 618 | 590 | 174.4 |
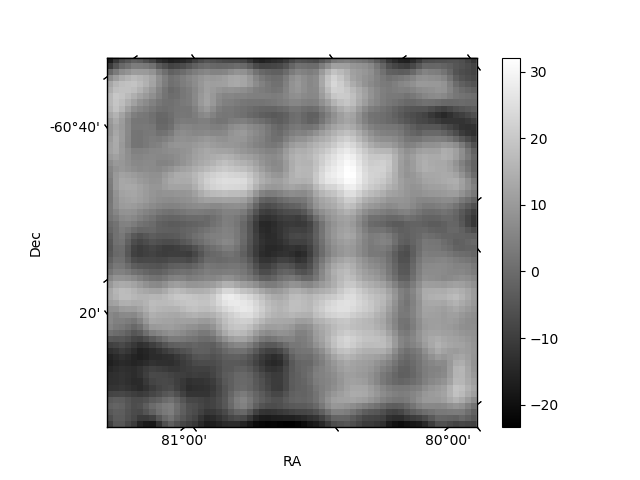
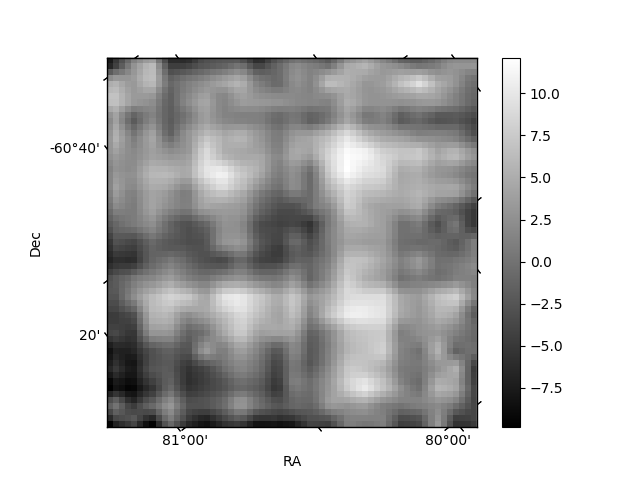
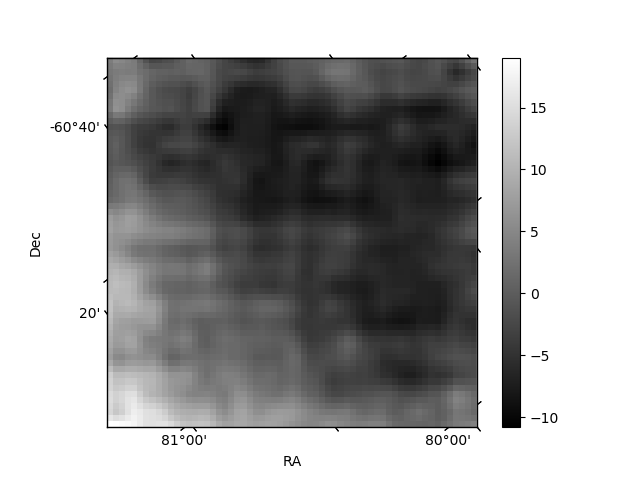
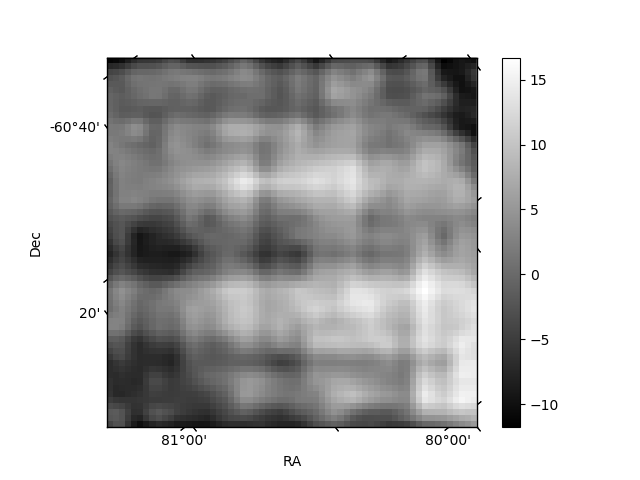
Histogram calculated using DETX and DETY for each event in the final _common_clean file
| Quadrant A | 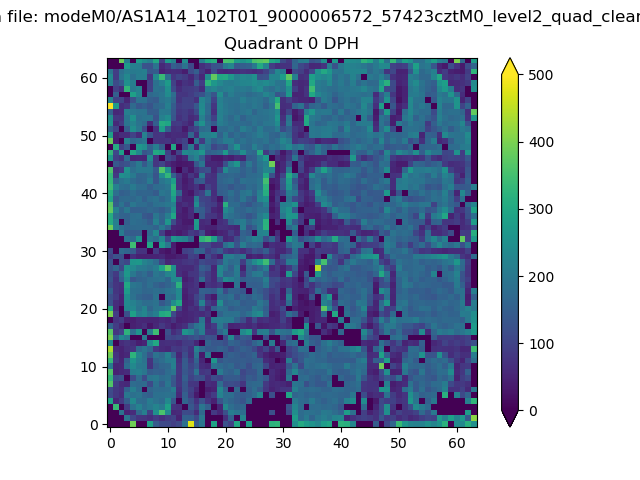 |
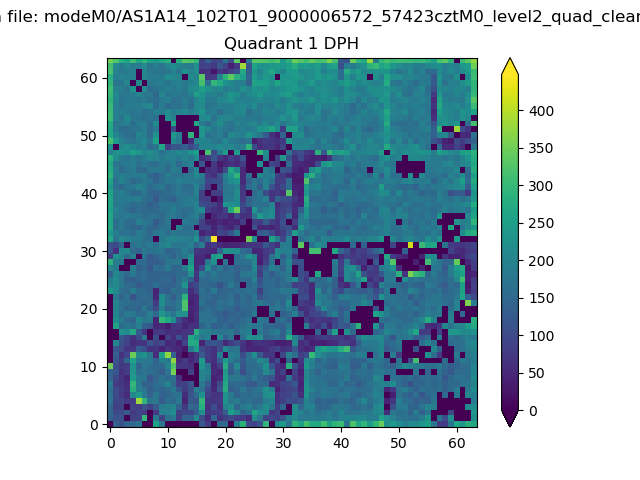 |
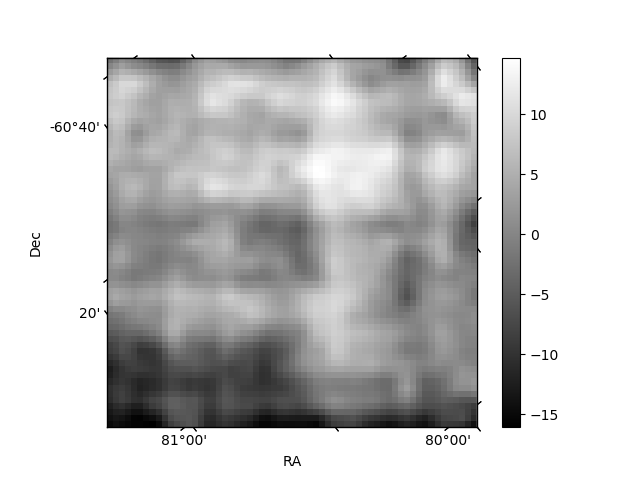
Quadrant B |
|---|---|---|---|
| Quadrant D | 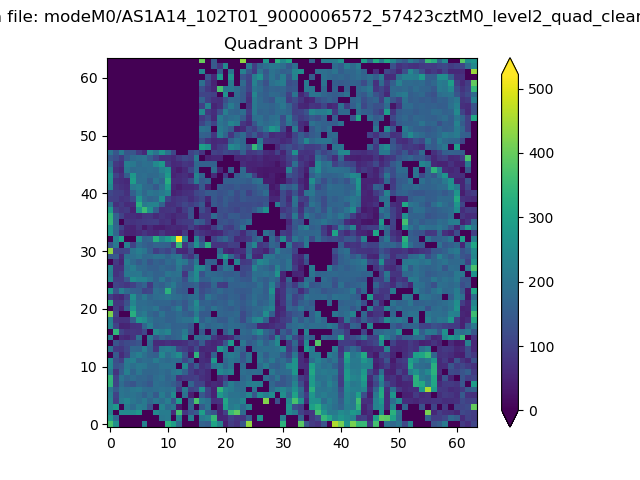 |
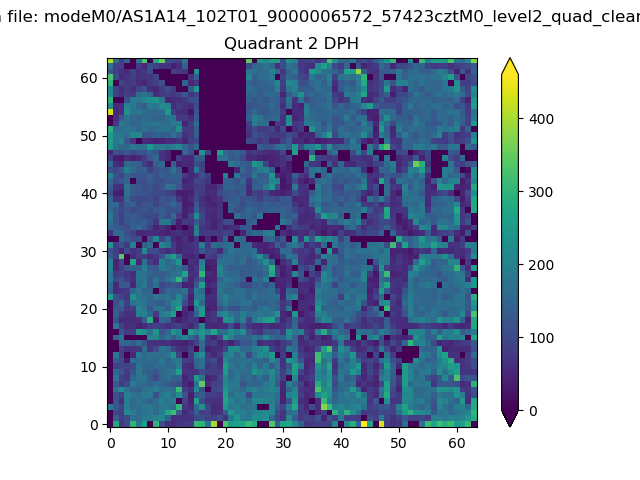 |
Quadrant C |
| Plot type | Count rate plots | Images |
|---|---|---|
| Comparison with Poisson distribution Blue bars denote a histogram of data divided into 1 sec bins. Red curve is a Poisson curve with rate = median count rate of data. |
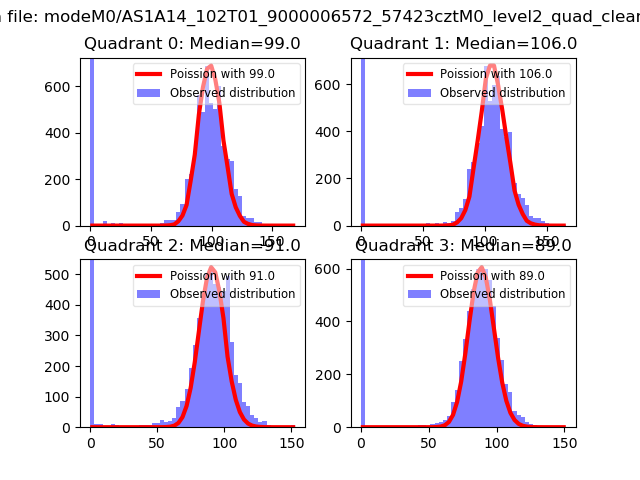 |
 |
| Quadrant-wise count rates Data is divided into 100 sec bins |
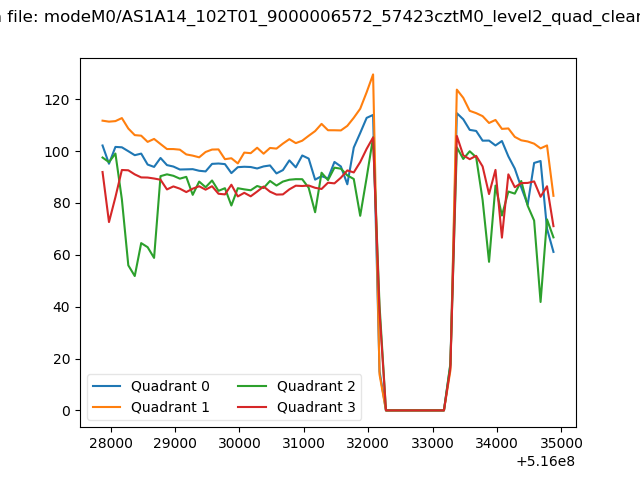 |
|
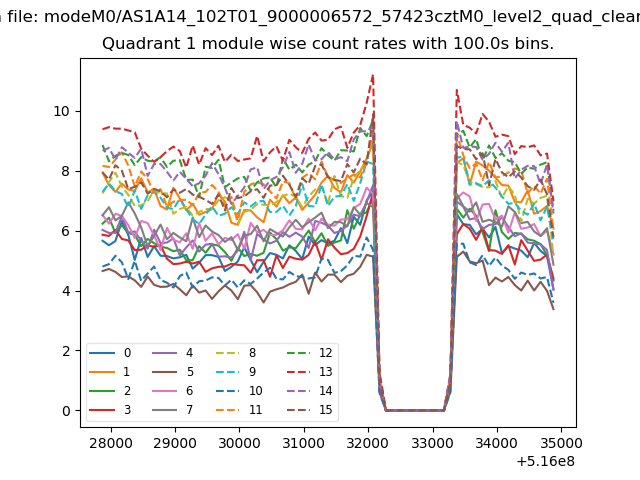
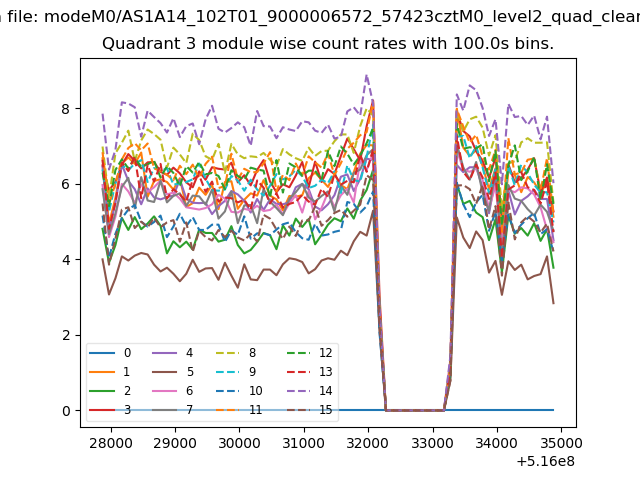
| Module-wise count rates for Quadrant A Data is divided into 100 sec bins |
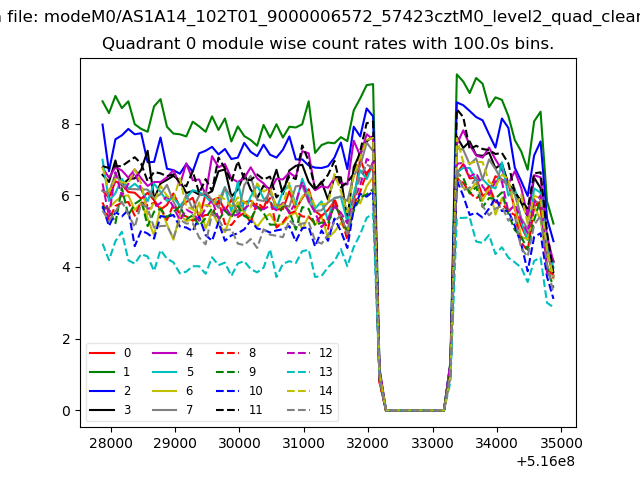 |
 |
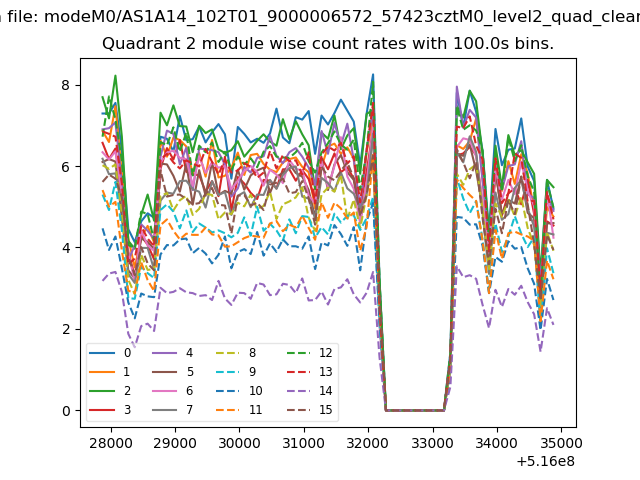
| Module-wise count rates for Quadrant B Data is divided into 100 sec bins |
 |
 |
| Module-wise count rates for Quadrant C Data is divided into 100 sec bins |
 |
 |
| Module-wise count rates for Quadrant D Data is divided into 100 sec bins |
 |
 |
| Parameter | Plot |
|---|---|
| CZT HV Monitor | 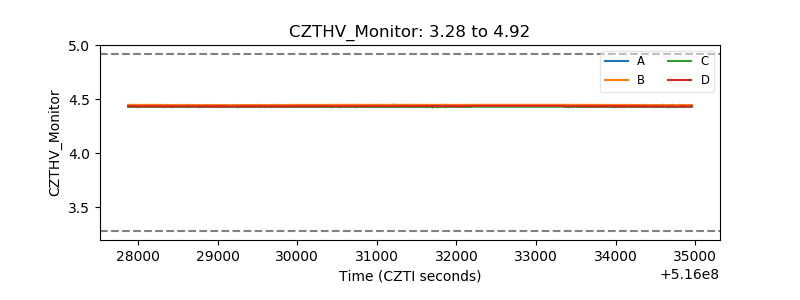 |
| D_VDD | 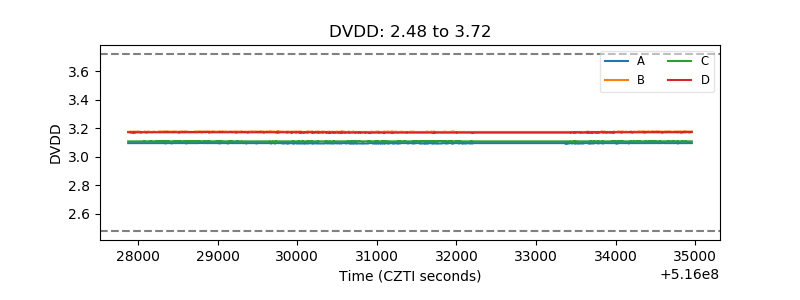 |
| Temperature 1 | 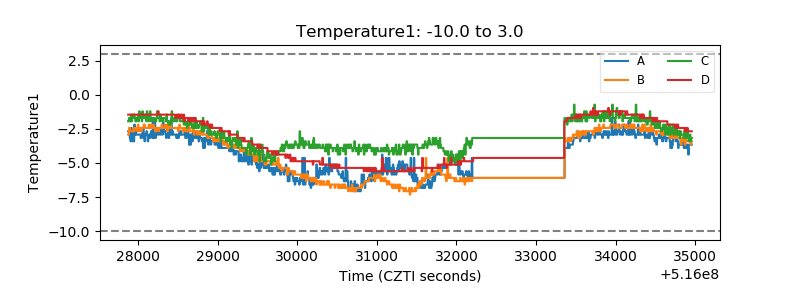 |
| Veto HV Monitor | 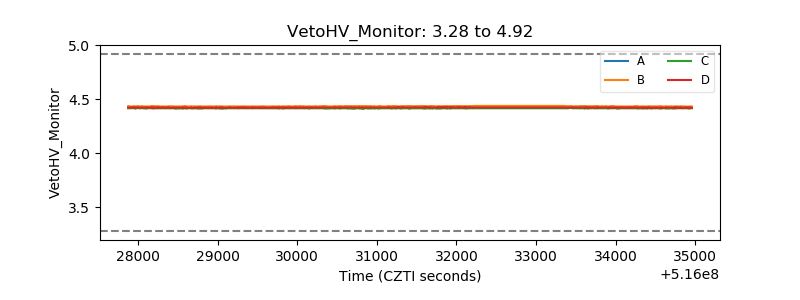 |
| Veto LLD | 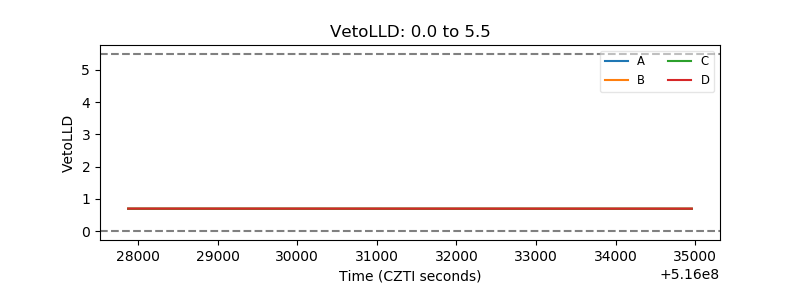 |
| Alpha Counter | 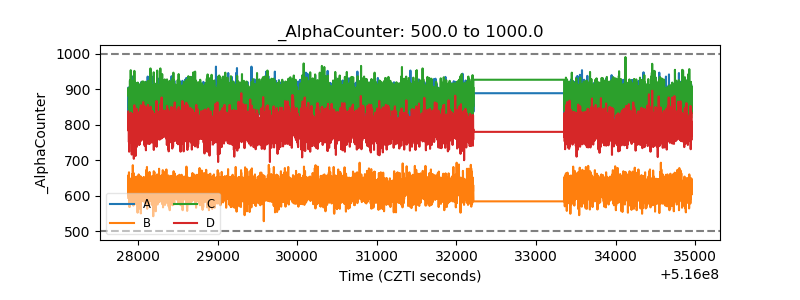 |
| _CPM_Rate | 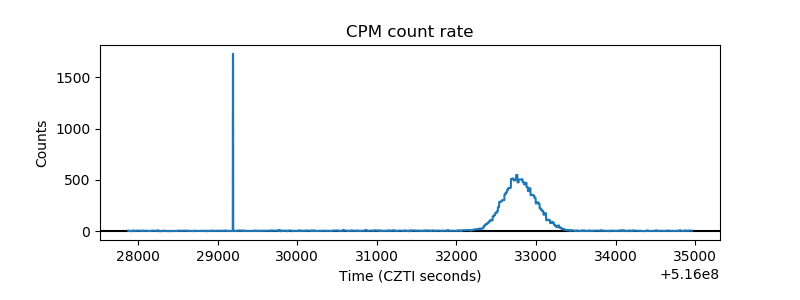 |
| CZT Counter | 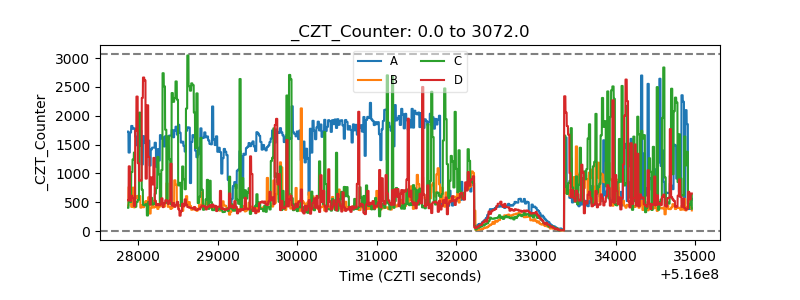 |
| +2.5 Volts monitor | 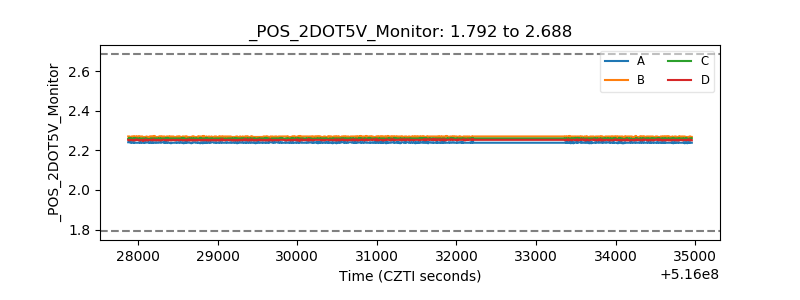 |
| +5 Volts monitor | 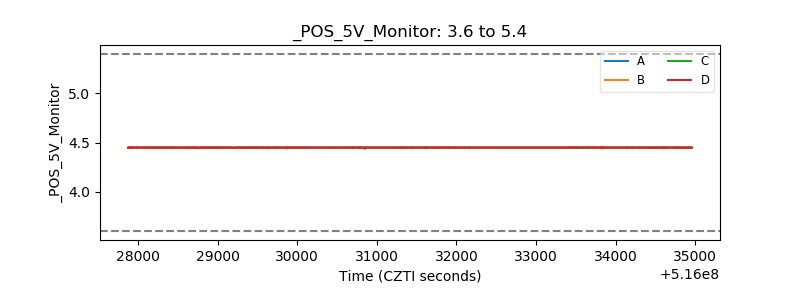 |
| _ROLL_ROT | 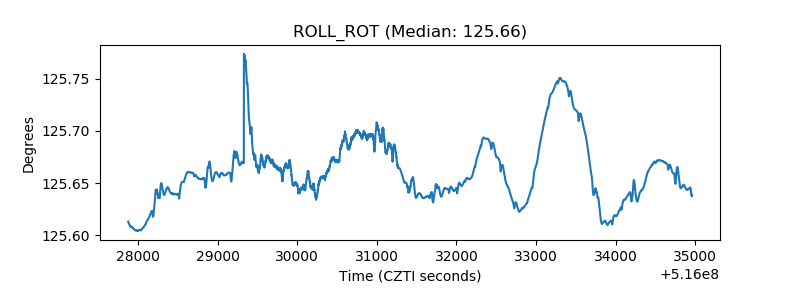 |
| _Roll_DEC | 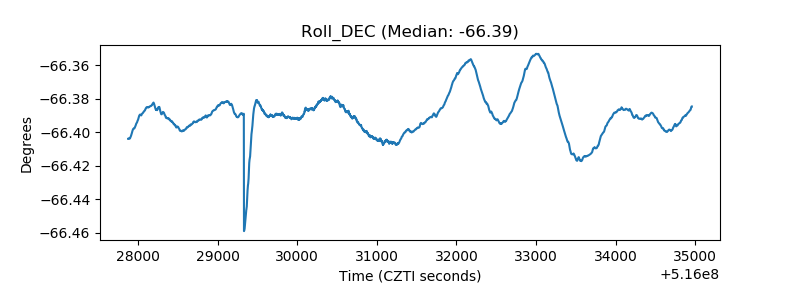 |
| _Roll_RA | 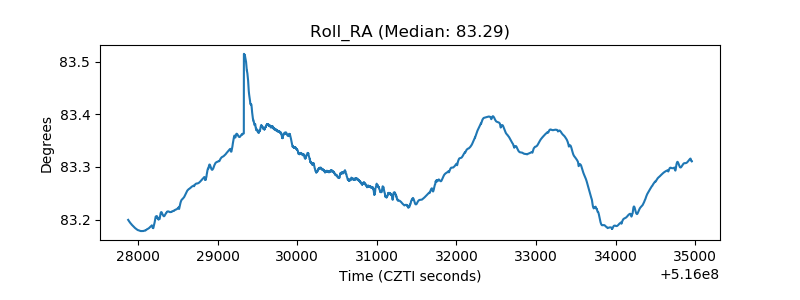 |
| Veto Counter | 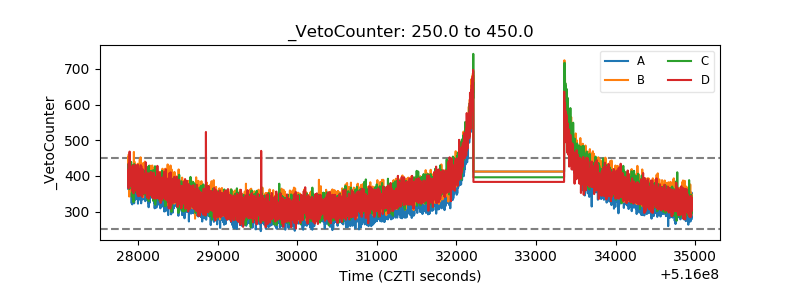 |