| Param | Original file | Final file |
|---|---|---|
| Filename | modeM0/AS1A14_102T01_9000006572_57425cztM0_level2.fits | modeM0/AS1A14_102T01_9000006572_57425cztM0_level2_quad_clean.evt |
| Size (bytes) | 518,915,520 | 93,559,680 |
| Size | 494.9 MB | 89.2 MB |
| Events in quadrant A | 5,721,892 | 608,354 |
| Events in quadrant B | 3,293,787 | 667,853 |
| Events in quadrant C | 5,750,055 | 545,843 |
| Events in quadrant D | 3,934,406 | 553,928 |
| Mode M0 | |||
|---|---|---|---|
| Quadrant | BADHDUFLAG | Total packets | Discarded packets |
| A | 0 | 21641 | 1 |
| B | 0 | 14664 | 1 |
| C | 0 | 21768 | 1 |
| D | 0 | 16384 | 1 |
| Mode M9 | |||
|---|---|---|---|
| Quadrant | BADHDUFLAG | Total packets | Discarded packets |
| A | 0 | 8 | 0 |
| B | 0 | 8 | 0 |
| C | 0 | 8 | 0 |
| D | 0 | 8 | 0 |
| Mode SS | |||
|---|---|---|---|
| Quadrant | BADHDUFLAG | Total packets | Discarded packets |
| A | 0 | 132 | 0 |
| B | 0 | 132 | 0 |
| C | 0 | 132 | 0 |
| D | 0 | 132 | 0 |
| Quadrant | Total seconds | Saturated seconds | Saturation percentage |
|---|---|---|---|
| A | 6553 | 358 | 5.463147% |
| B | 6553 | 58 | 0.885091% |
| C | 6553 | 719 | 10.972074% |
| D | 6553 | 175 | 2.670533% |
Noise dominated data is calculated using 1-second bins in cleaned event files. If a bin has >2000 counts, and if more than 50% of those come from <1% of pixels, then it is considered to be noise-dominated and hence unusable.
| Quadrant | # 1 sec bins | Bins with >0 counts | Bins with >2000 counts | High rate bins dominated by noise | Noise dominated (total time) | Noise dominated (detector-on time) | Marked lightcurve |
|---|---|---|---|---|---|---|---|
| A | 7358 | 6554 | 255 | 255 | 3.47% | 3.89% | 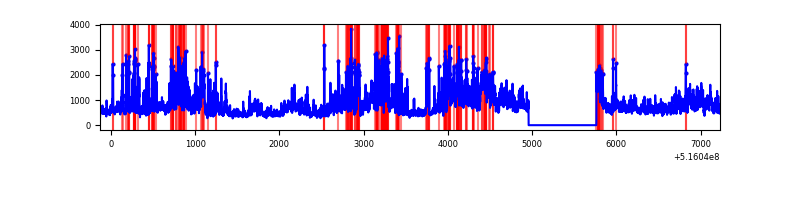 |
| B | 7358 | 6554 | 8 | 8 | 0.11% | 0.12% | 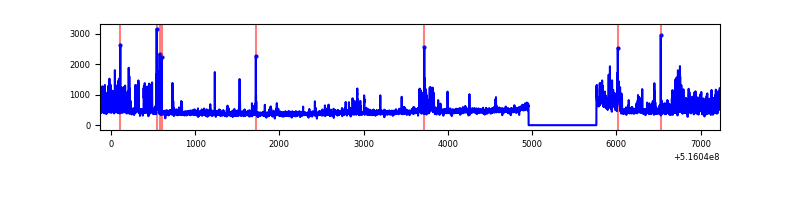 |
| C | 7358 | 6554 | 642 | 642 | 8.73% | 9.80% | 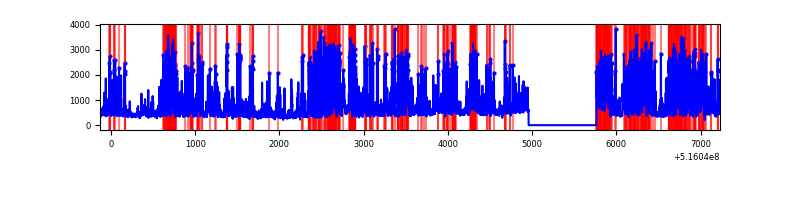 |
| D | 7358 | 6554 | 156 | 156 | 2.12% | 2.38% | 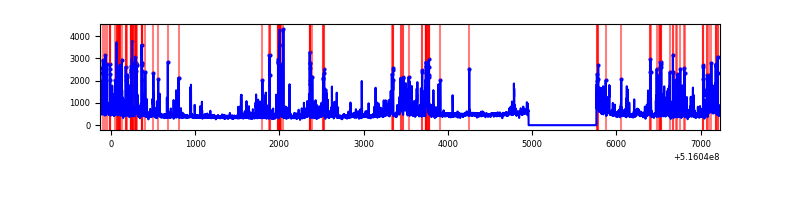 |
Top three noisy pixels from each quadrant. If the there are fewer than three noisy pixels in the level2.evt file, extra rows are filled as -1
| Pixel properties | Quadrant properties | ||||||
|---|---|---|---|---|---|---|---|
| Quadrant | DetID | PixID | Counts | Sigma | Mean | Median | Sigma |
| A | 7 | 64 | 1640584 | 9758.63 | 681 | 661 | 168.0 |
| A | 10 | 251 | 968344 | 5758.36 | 681 | 661 | 168.0 |
| A | 8 | 4 | 355242 | 2109.99 | 681 | 661 | 168.0 |
| B | 0 | 216 | 411490 | 2794.91 | 686 | 660 | 147.0 |
| B | 5 | 185 | 47058 | 315.65 | 686 | 660 | 147.0 |
| B | 0 | 245 | 35630 | 237.9 | 686 | 660 | 147.0 |
| C | 15 | 224 | 2788707 | 16051.43 | 635 | 628 | 173.7 |
| C | 14 | 254 | 238635 | 1370.25 | 635 | 628 | 173.7 |
| C | 6 | 223 | 173410 | 994.73 | 635 | 628 | 173.7 |
| D | 8 | 240 | 334450 | 1779.28 | 660 | 628 | 187.6 |
| D | 15 | 142 | 311492 | 1656.91 | 660 | 628 | 187.6 |
| D | 3 | 12 | 245817 | 1306.86 | 660 | 628 | 187.6 |
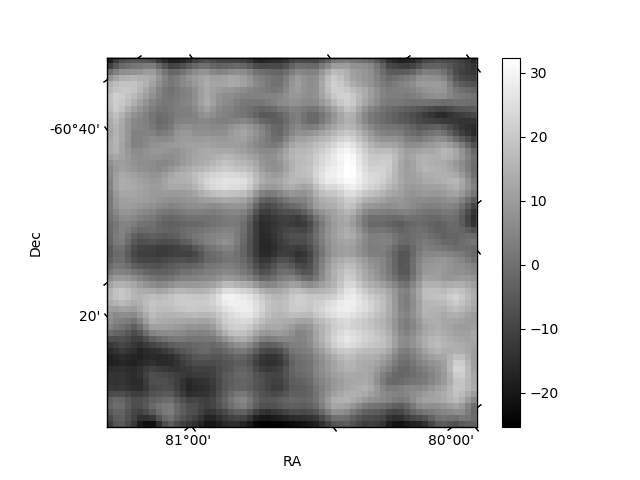
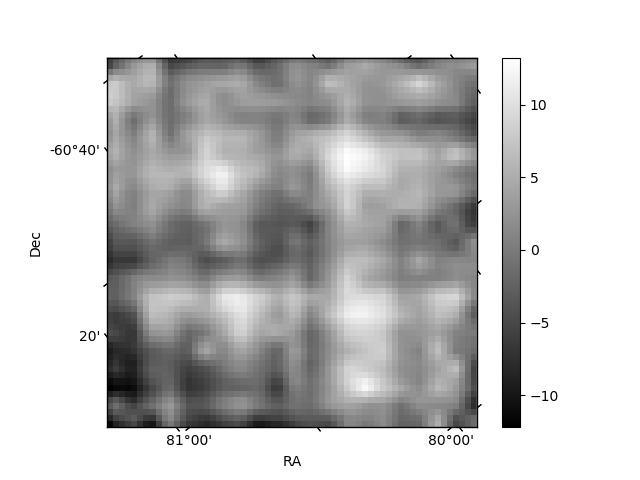
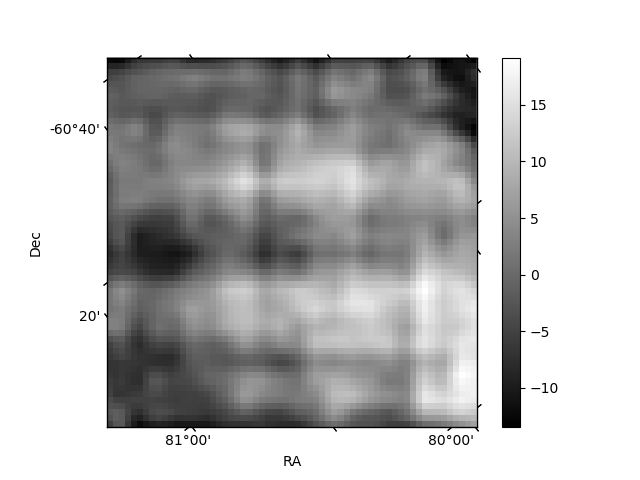
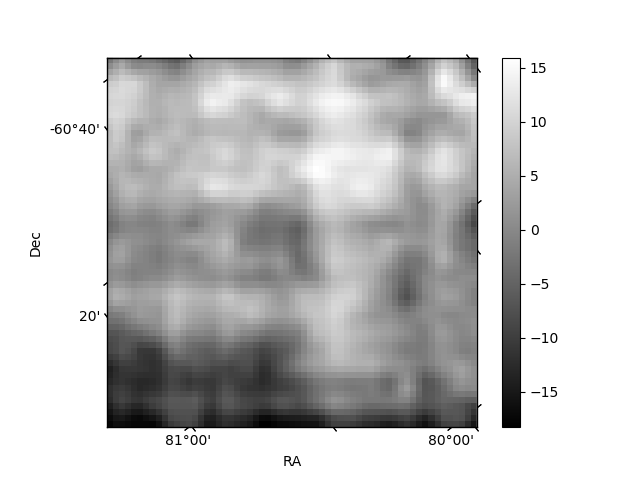
Histogram calculated using DETX and DETY for each event in the final _common_clean file
| Quadrant A | 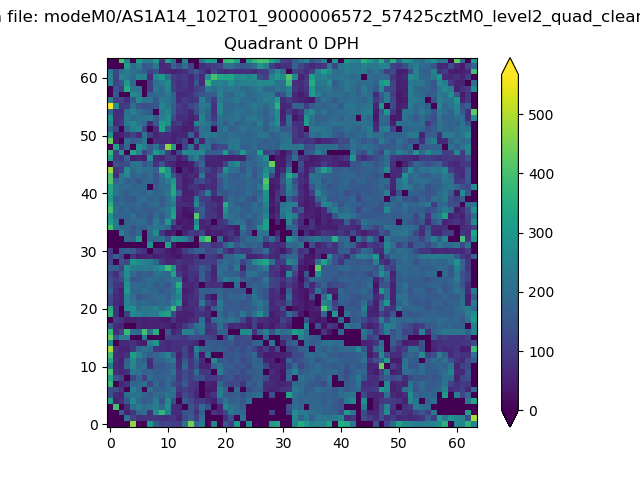 |
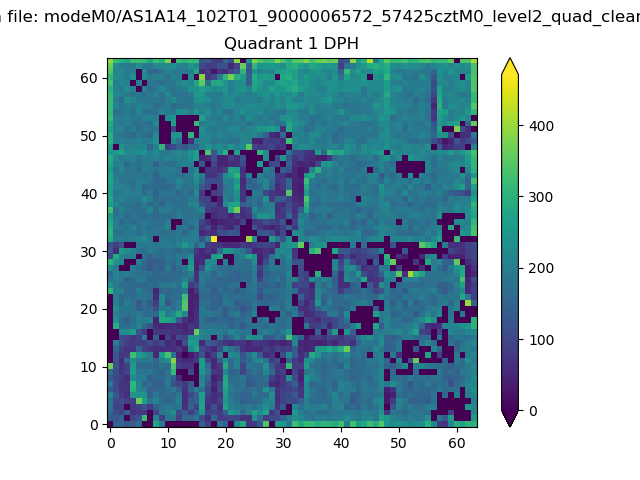 |
Quadrant B |
|---|---|---|---|
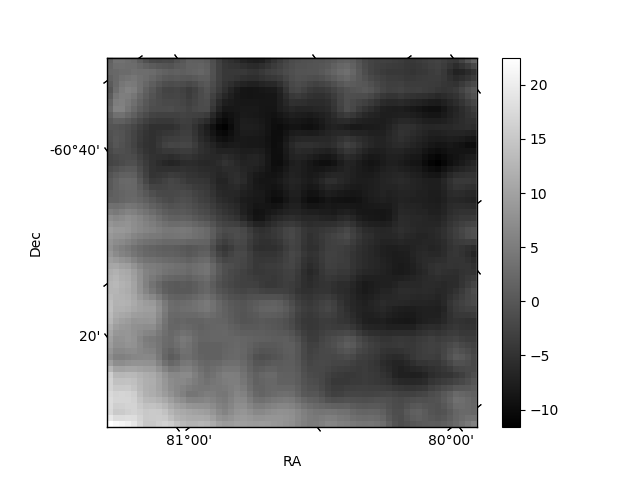
| Quadrant D | 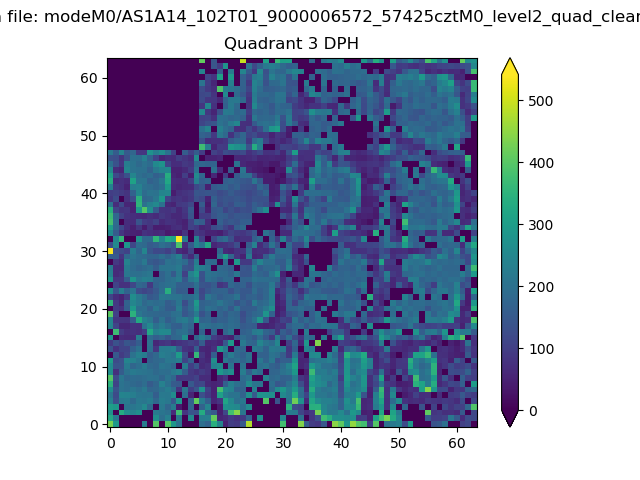 |
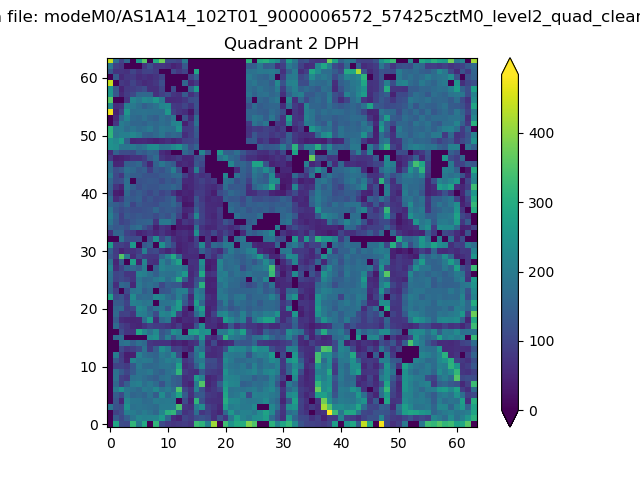 |
Quadrant C |
| Plot type | Count rate plots | Images |
|---|---|---|
| Comparison with Poisson distribution Blue bars denote a histogram of data divided into 1 sec bins. Red curve is a Poisson curve with rate = median count rate of data. |
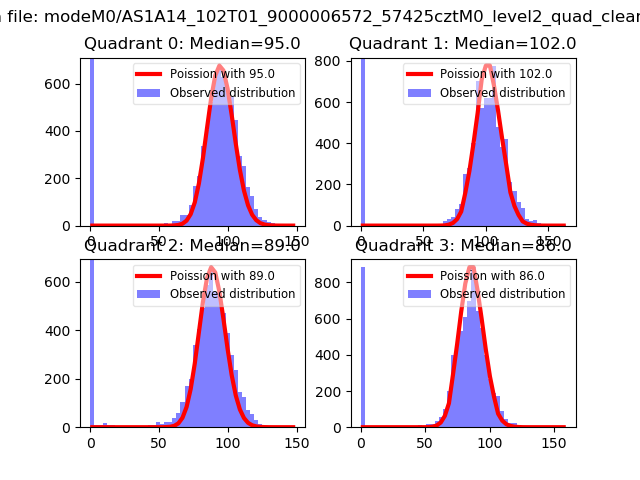 |
 |
| Quadrant-wise count rates Data is divided into 100 sec bins |
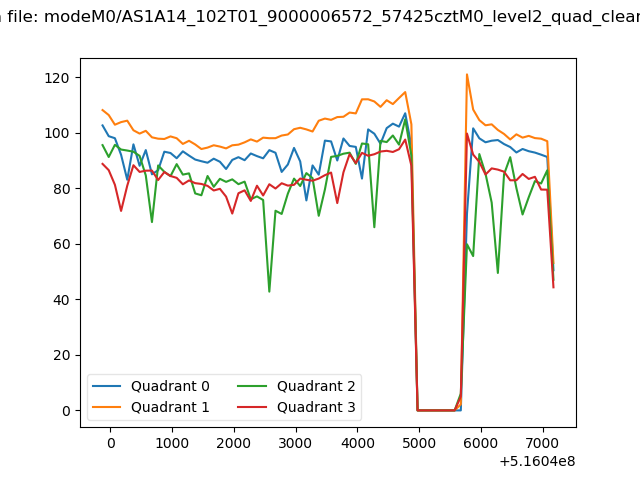 |
|
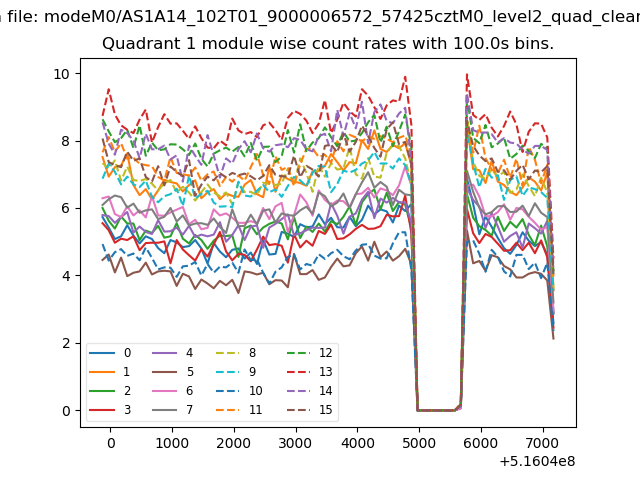
| Module-wise count rates for Quadrant A Data is divided into 100 sec bins |
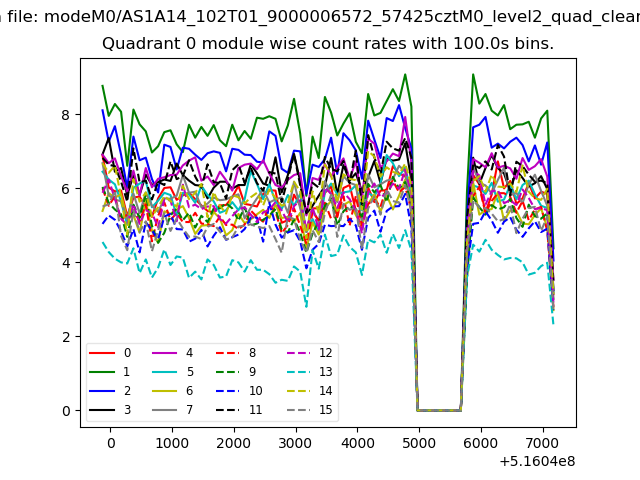 |
 |
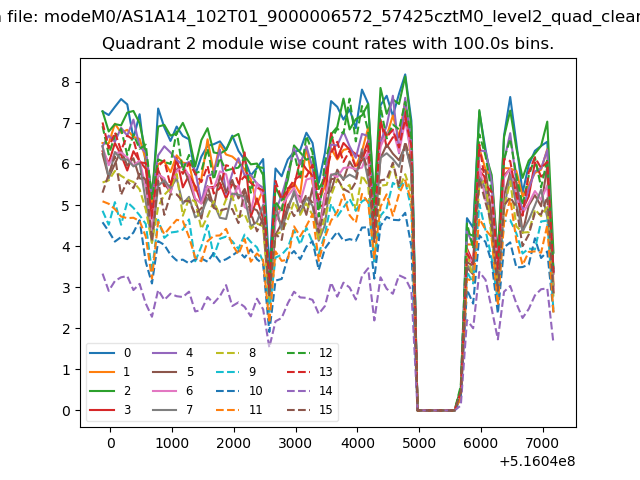
| Module-wise count rates for Quadrant B Data is divided into 100 sec bins |
 |
 |
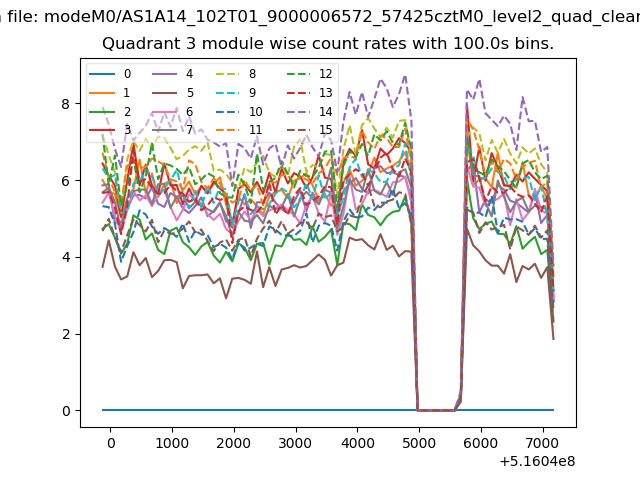
| Module-wise count rates for Quadrant C Data is divided into 100 sec bins |
 |
 |
| Module-wise count rates for Quadrant D Data is divided into 100 sec bins |
 |
 |
| Parameter | Plot |
|---|---|
| CZT HV Monitor | 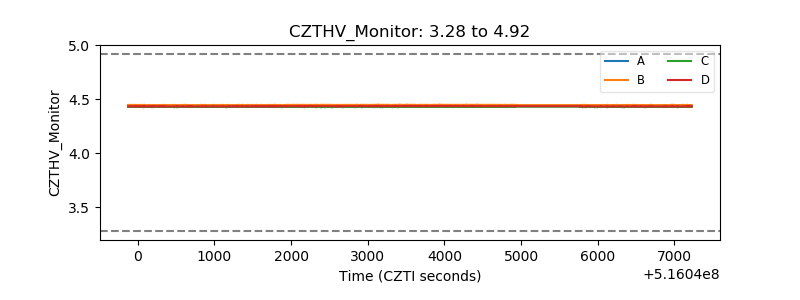 |
| D_VDD | 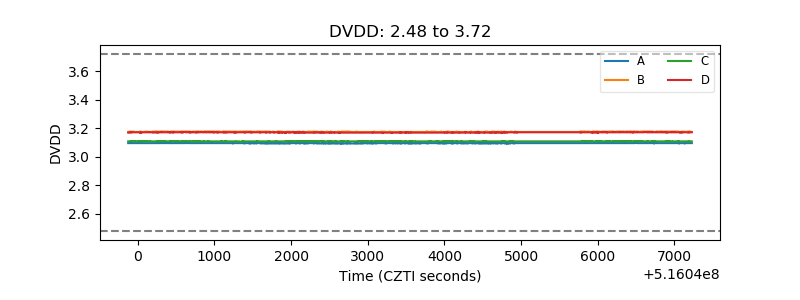 |
| Temperature 1 | 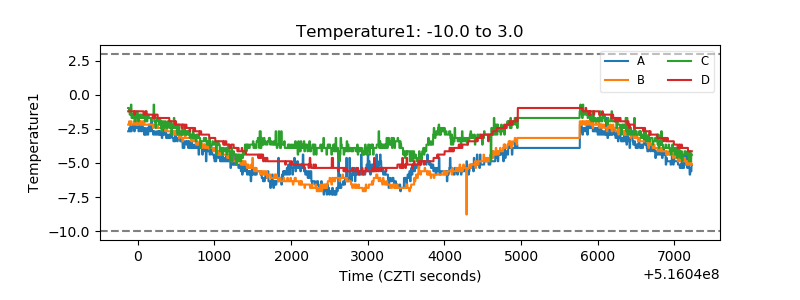 |
| Veto HV Monitor | 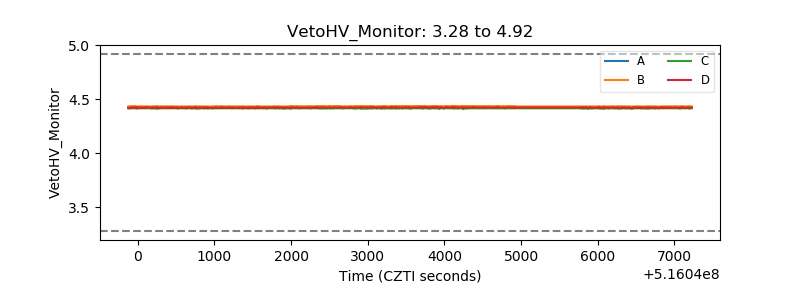 |
| Veto LLD | 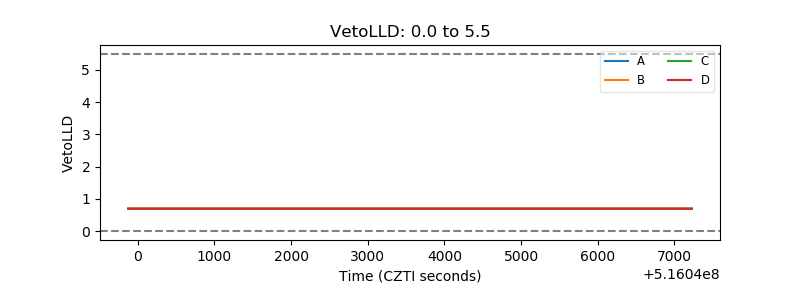 |
| Alpha Counter | 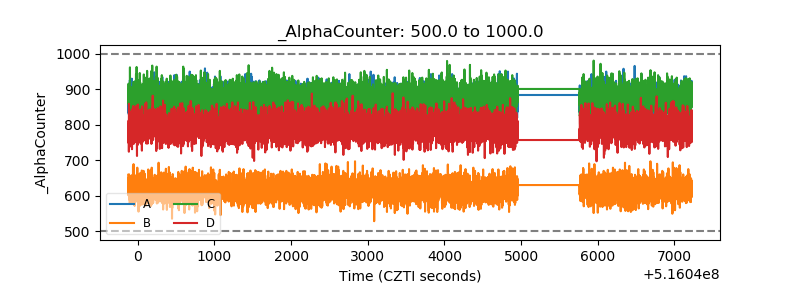 |
| _CPM_Rate | 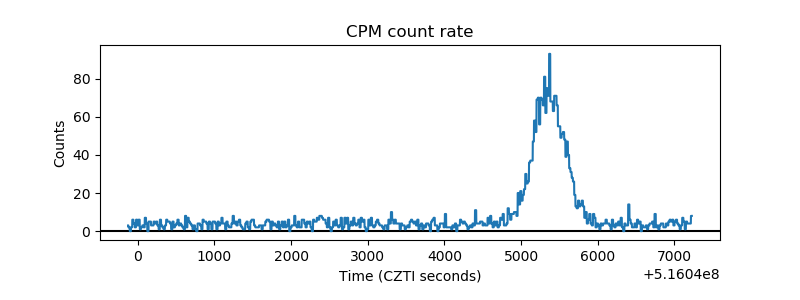 |
| CZT Counter | 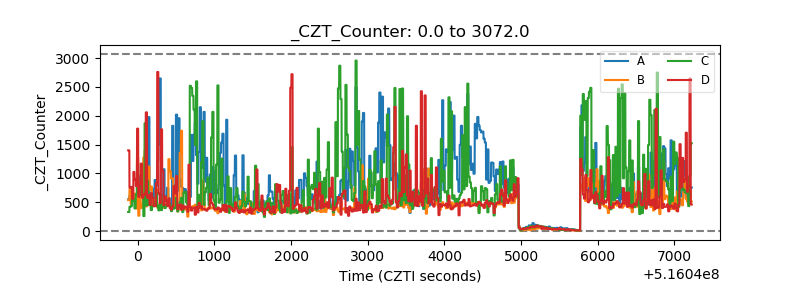 |
| +2.5 Volts monitor | 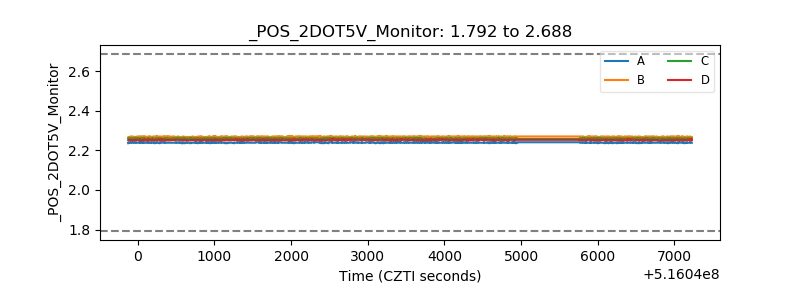 |
| +5 Volts monitor | 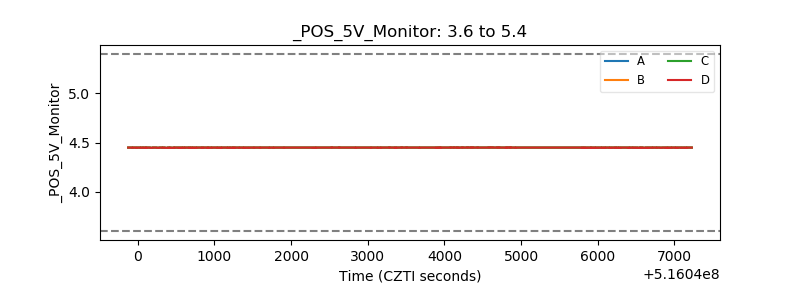 |
| _ROLL_ROT | 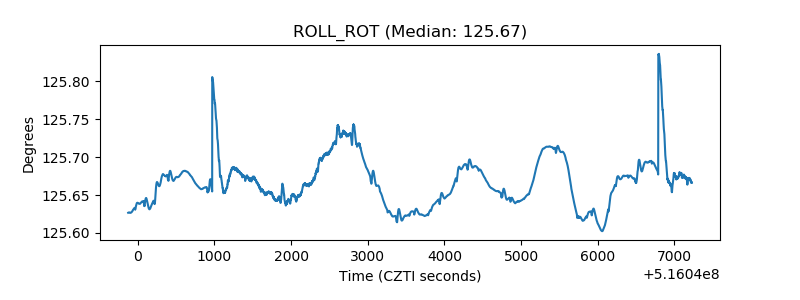 |
| _Roll_DEC | 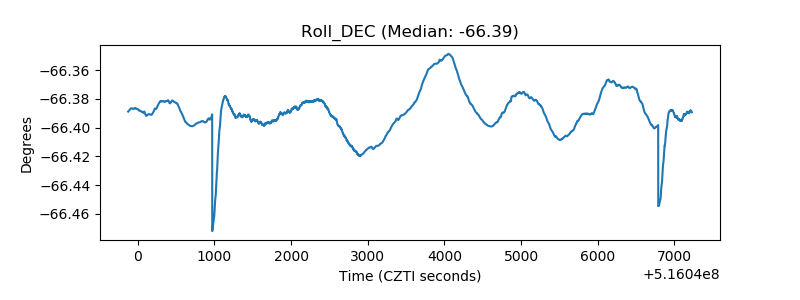 |
| _Roll_RA | 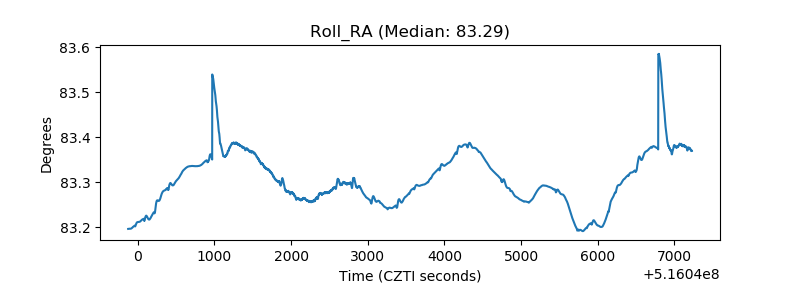 |
| Veto Counter | 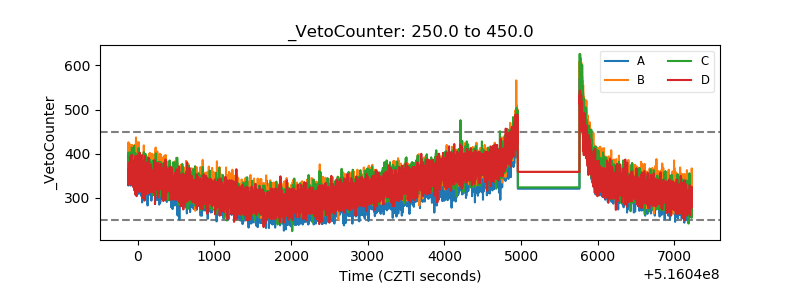 |