| Param | Original file | Final file |
|---|---|---|
| Filename | modeM0/AS1A14_102T01_9000006572_57426cztM0_level2.fits | modeM0/AS1A14_102T01_9000006572_57426cztM0_level2_quad_clean.evt |
| Size (bytes) | 539,138,880 | 101,977,920 |
| Size | 514.2 MB | 97.3 MB |
| Events in quadrant A | 5,285,824 | 662,479 |
| Events in quadrant B | 3,675,367 | 721,496 |
| Events in quadrant C | 5,658,252 | 611,227 |
| Events in quadrant D | 4,781,513 | 593,279 |
| Mode M0 | |||
|---|---|---|---|
| Quadrant | BADHDUFLAG | Total packets | Discarded packets |
| A | 0 | 20589 | 2 |
| B | 0 | 16052 | 1 |
| C | 0 | 21826 | 1 |
| D | 0 | 19216 | 1 |
| Mode M9 | |||
|---|---|---|---|
| Quadrant | BADHDUFLAG | Total packets | Discarded packets |
| A | 0 | 3 | 0 |
| B | 0 | 3 | 0 |
| C | 0 | 3 | 0 |
| D | 0 | 3 | 0 |
| Mode SS | |||
|---|---|---|---|
| Quadrant | BADHDUFLAG | Total packets | Discarded packets |
| A | 0 | 146 | 0 |
| B | 0 | 146 | 0 |
| C | 0 | 146 | 0 |
| D | 0 | 146 | 0 |
| Quadrant | Total seconds | Saturated seconds | Saturation percentage |
|---|---|---|---|
| A | 7168 | 283 | 3.948103% |
| B | 7168 | 119 | 1.660156% |
| C | 7168 | 509 | 7.101004% |
| D | 7168 | 336 | 4.687500% |
Noise dominated data is calculated using 1-second bins in cleaned event files. If a bin has >2000 counts, and if more than 50% of those come from <1% of pixels, then it is considered to be noise-dominated and hence unusable.
| Quadrant | # 1 sec bins | Bins with >0 counts | Bins with >2000 counts | High rate bins dominated by noise | Noise dominated (total time) | Noise dominated (detector-on time) | Marked lightcurve |
|---|---|---|---|---|---|---|---|
| A | 7478 | 7169 | 159 | 159 | 2.13% | 2.22% | 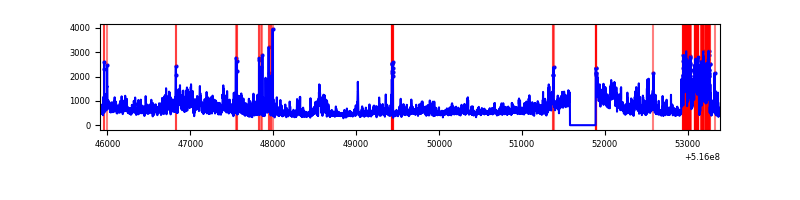 |
| B | 7478 | 7169 | 21 | 21 | 0.28% | 0.29% | 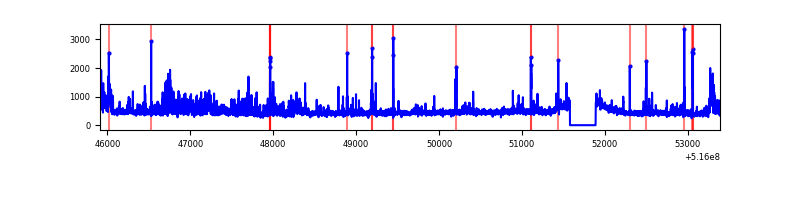 |
| C | 7478 | 7169 | 455 | 455 | 6.08% | 6.35% | 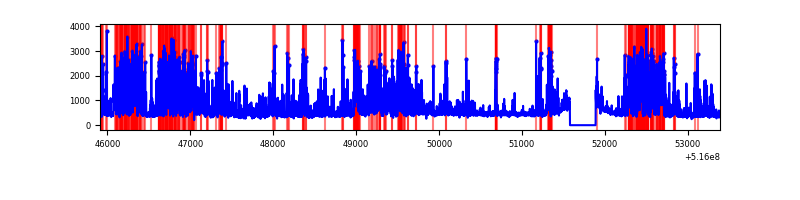 |
| D | 7478 | 7169 | 282 | 282 | 3.77% | 3.93% | 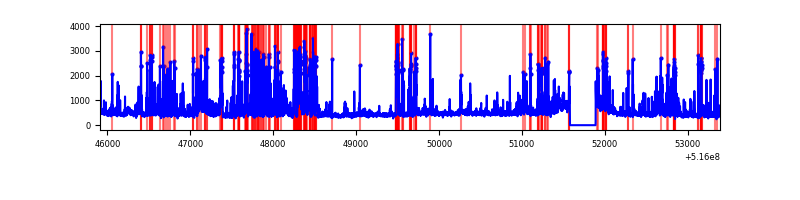 |
Top three noisy pixels from each quadrant. If the there are fewer than three noisy pixels in the level2.evt file, extra rows are filled as -1
| Pixel properties | Quadrant properties | ||||||
|---|---|---|---|---|---|---|---|
| Quadrant | DetID | PixID | Counts | Sigma | Mean | Median | Sigma |
| A | 7 | 64 | 1153964 | 6145.91 | 762 | 743 | 187.6 |
| A | 8 | 4 | 877256 | 4671.24 | 762 | 743 | 187.6 |
| A | 10 | 251 | 133637 | 708.24 | 762 | 743 | 187.6 |
| B | 0 | 216 | 357624 | 2202.87 | 758 | 728 | 162.0 |
| B | 5 | 185 | 96475 | 590.98 | 758 | 728 | 162.0 |
| B | 0 | 245 | 43324 | 262.92 | 758 | 728 | 162.0 |
| C | 15 | 224 | 2115007 | 10814.71 | 717 | 710 | 195.5 |
| C | 6 | 223 | 426415 | 2177.5 | 717 | 710 | 195.5 |
| C | 14 | 254 | 202276 | 1031.02 | 717 | 710 | 195.5 |
| D | 7 | 96 | 603650 | 2932.88 | 729 | 696 | 205.6 |
| D | 8 | 240 | 467028 | 2268.33 | 729 | 696 | 205.6 |
| D | 15 | 142 | 339114 | 1646.13 | 729 | 696 | 205.6 |
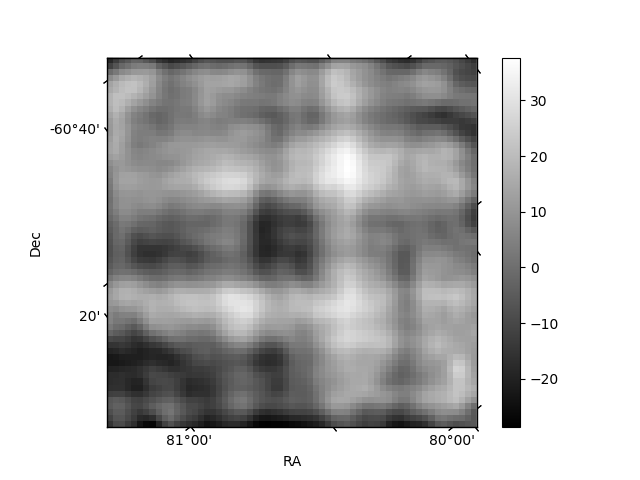
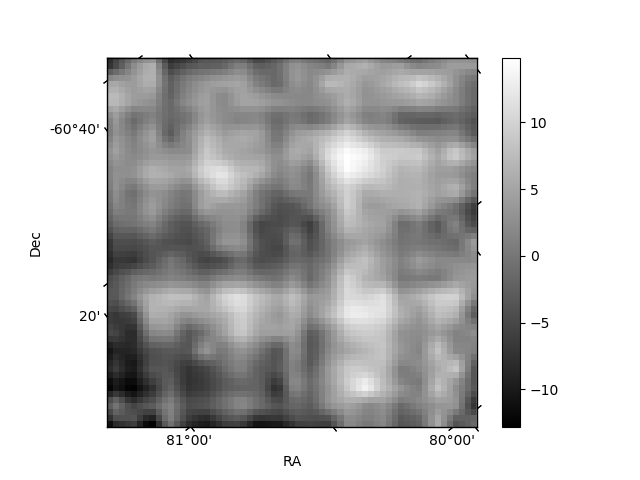
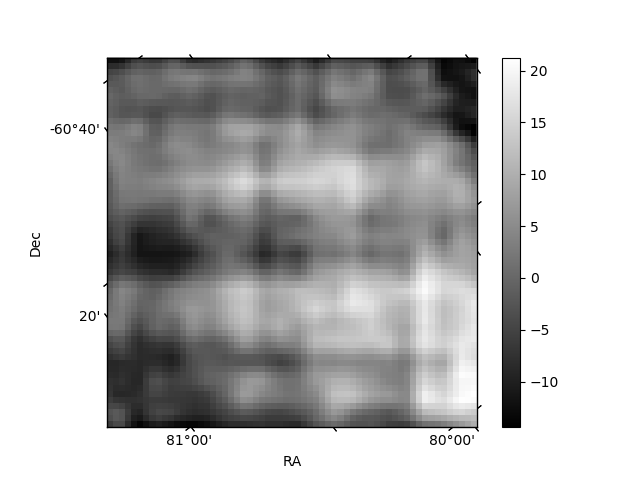
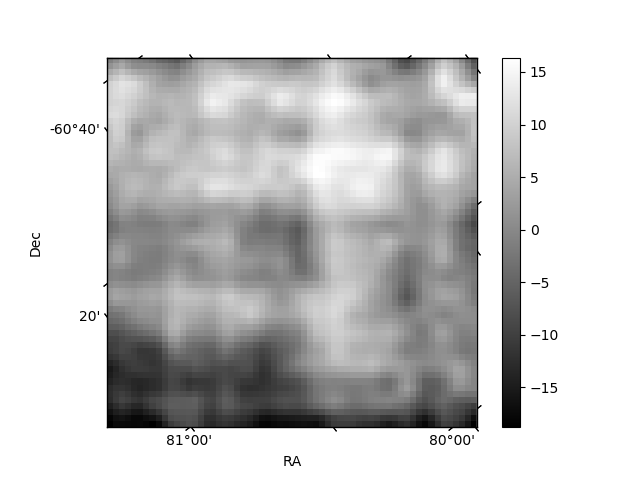
Histogram calculated using DETX and DETY for each event in the final _common_clean file
| Quadrant A | 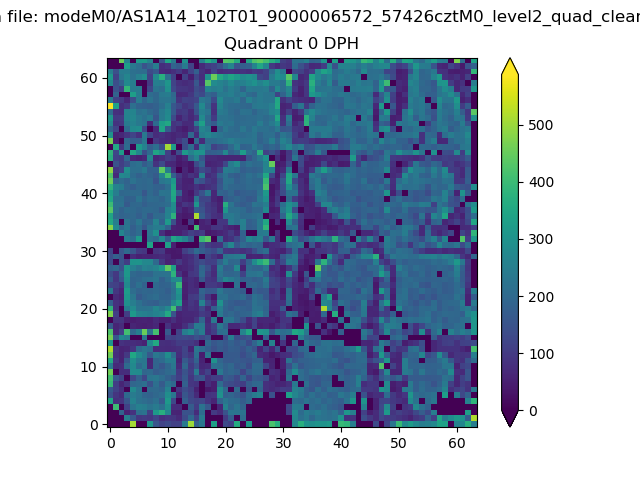 |
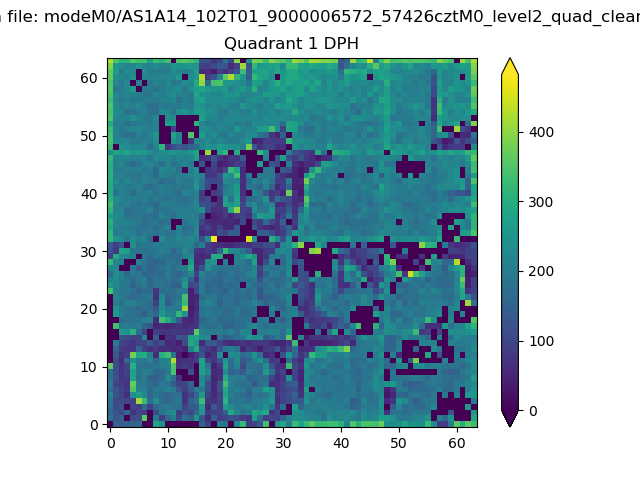 |
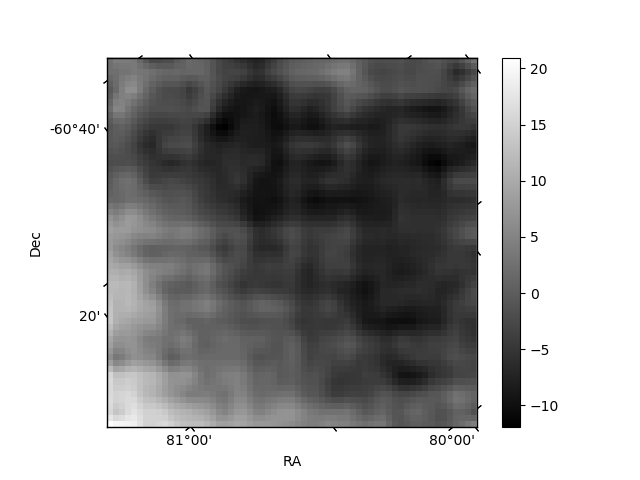
Quadrant B |
|---|---|---|---|
| Quadrant D | 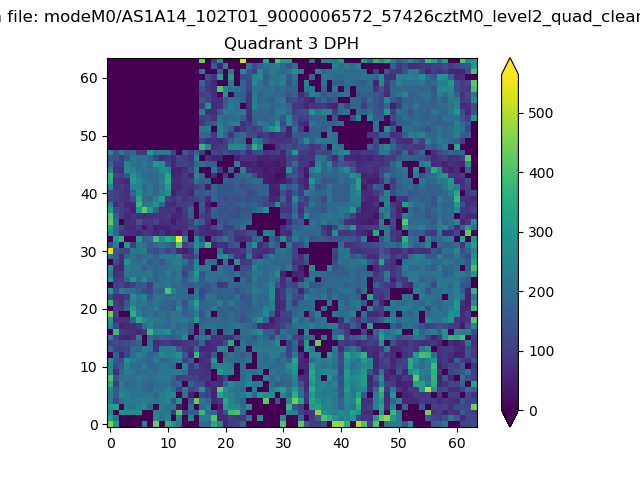 |
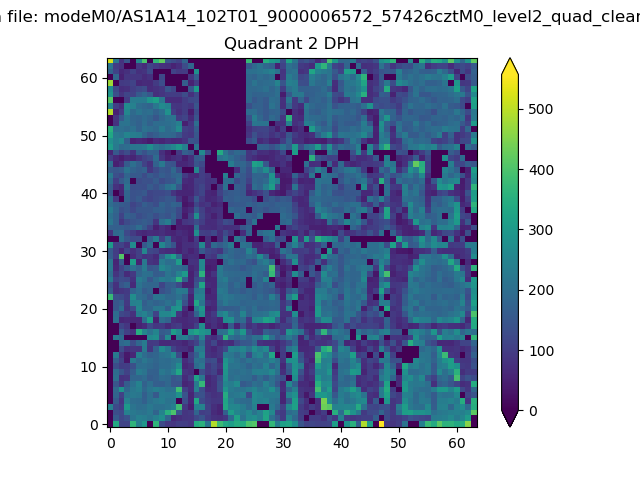 |
Quadrant C |
| Plot type | Count rate plots | Images |
|---|---|---|
| Comparison with Poisson distribution Blue bars denote a histogram of data divided into 1 sec bins. Red curve is a Poisson curve with rate = median count rate of data. |
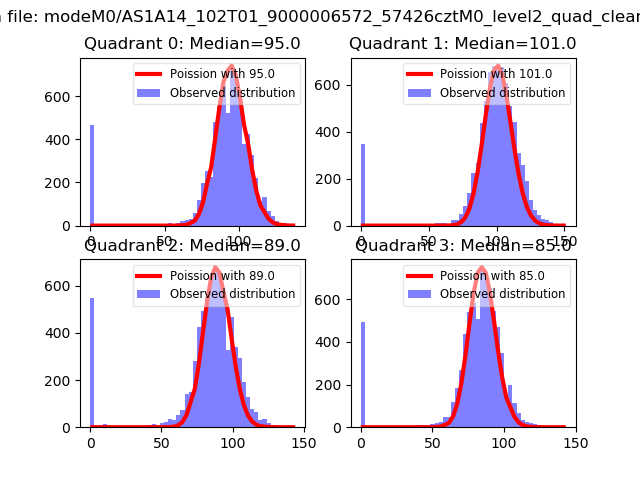 |
 |
| Quadrant-wise count rates Data is divided into 100 sec bins |
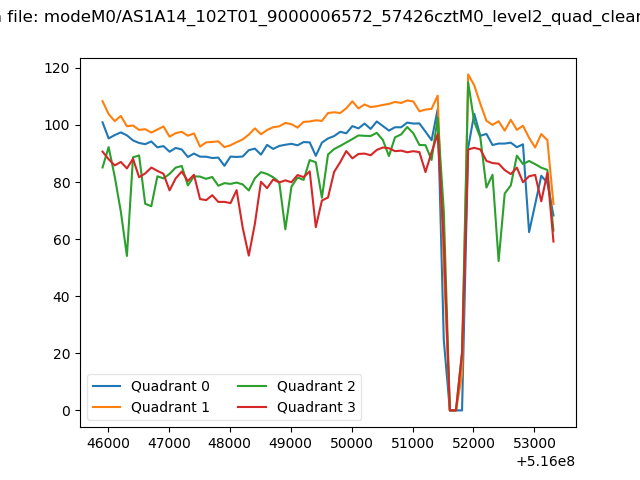 |
|
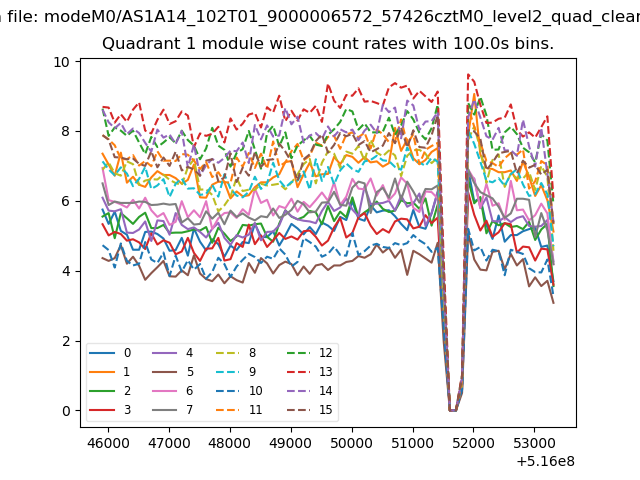
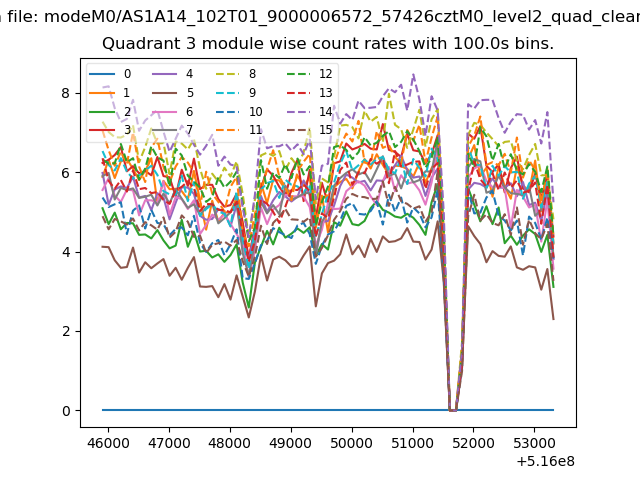
| Module-wise count rates for Quadrant A Data is divided into 100 sec bins |
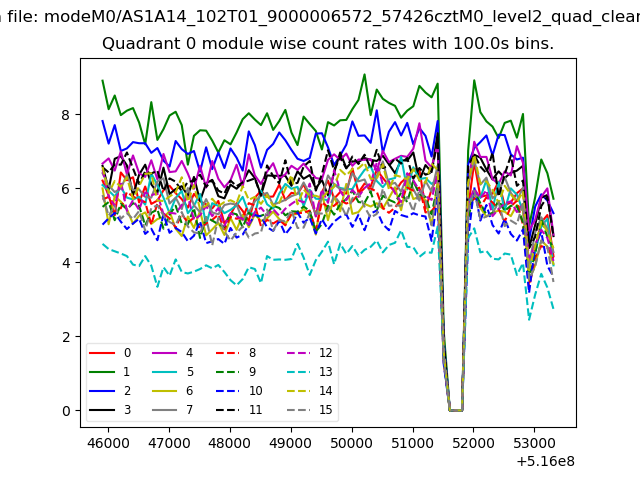 |
 |
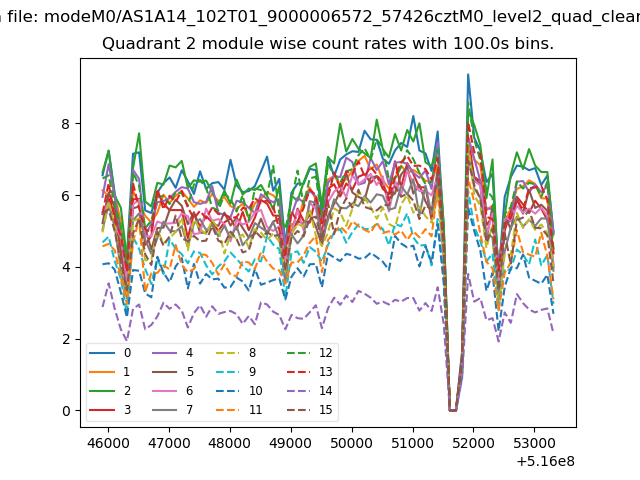
| Module-wise count rates for Quadrant B Data is divided into 100 sec bins |
 |
 |
| Module-wise count rates for Quadrant C Data is divided into 100 sec bins |
 |
 |
| Module-wise count rates for Quadrant D Data is divided into 100 sec bins |
 |
 |
| Parameter | Plot |
|---|---|
| CZT HV Monitor | 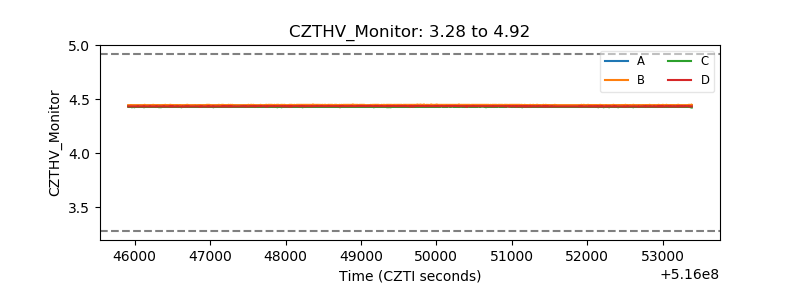 |
| D_VDD | 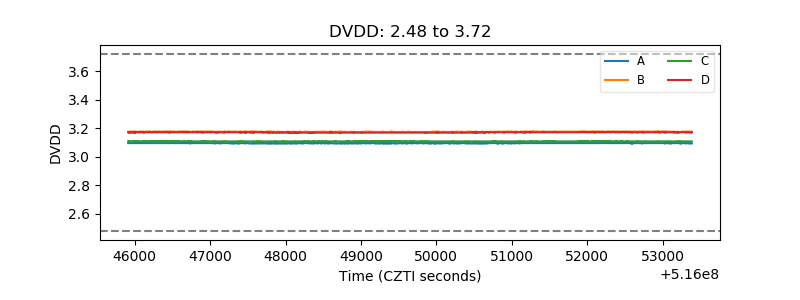 |
| Temperature 1 | 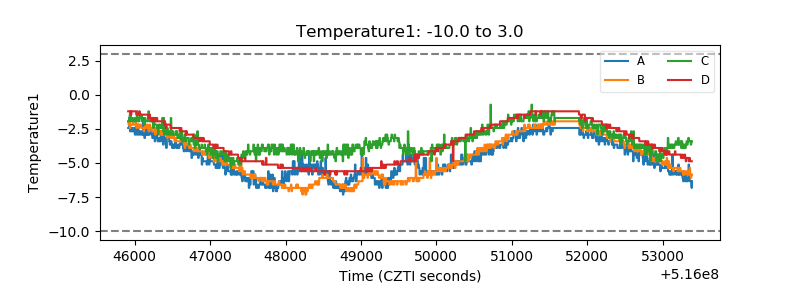 |
| Veto HV Monitor | 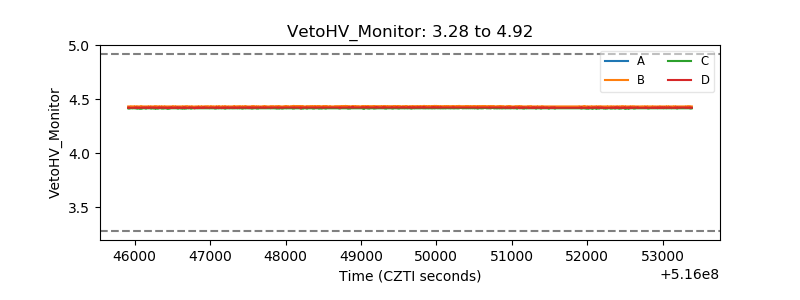 |
| Veto LLD | 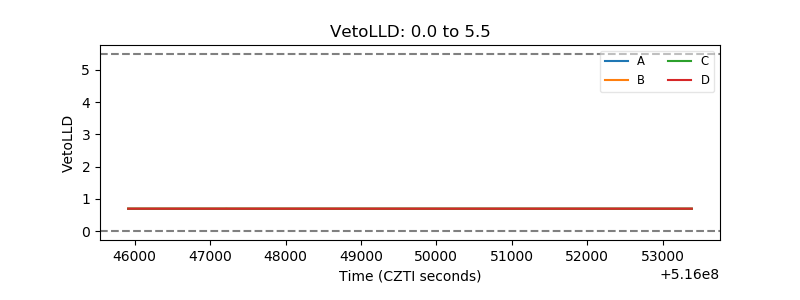 |
| Alpha Counter | 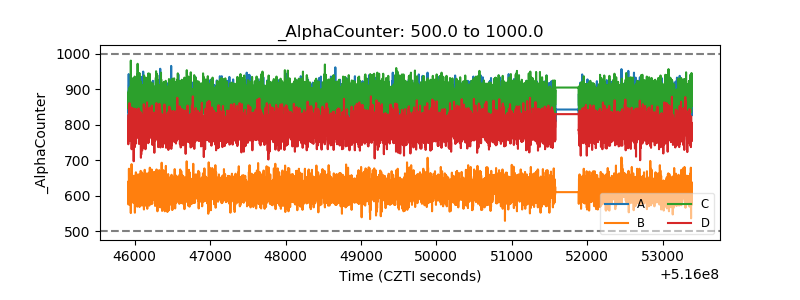 |
| _CPM_Rate | 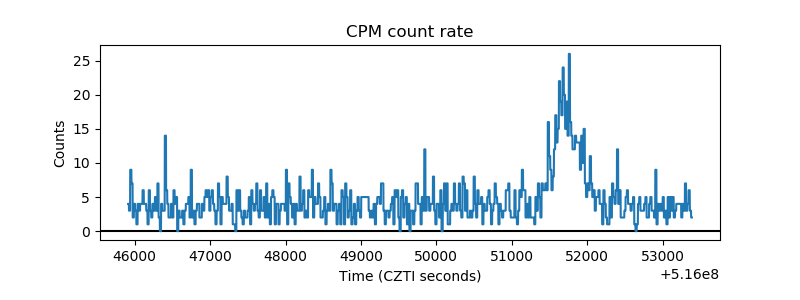 |
| CZT Counter | 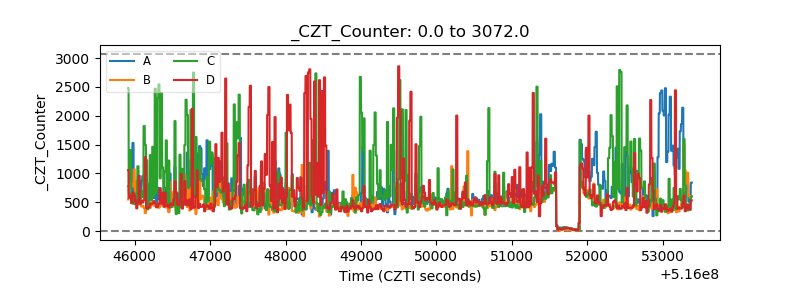 |
| +2.5 Volts monitor |  |
| +5 Volts monitor |  |
| _ROLL_ROT | 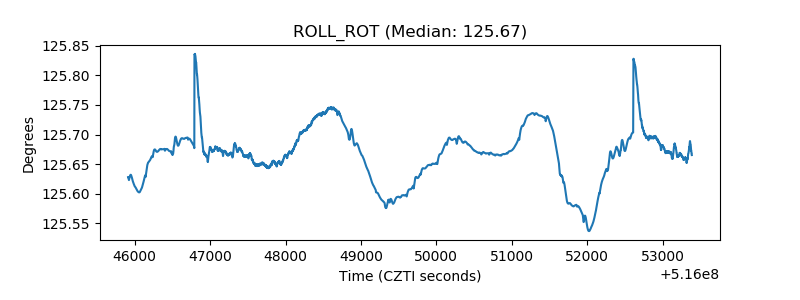 |
| _Roll_DEC | 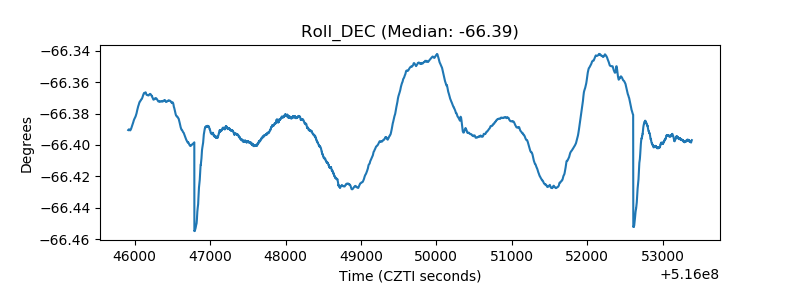 |
| _Roll_RA | 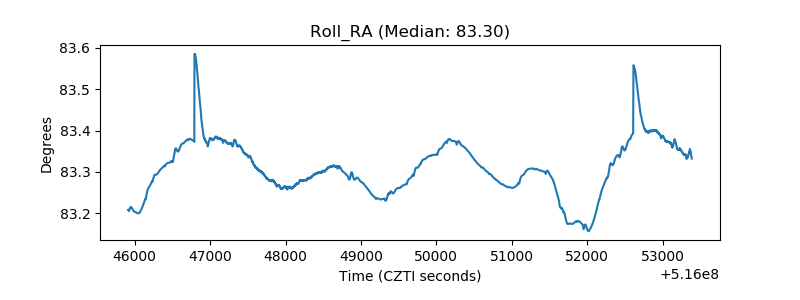 |
| Veto Counter | 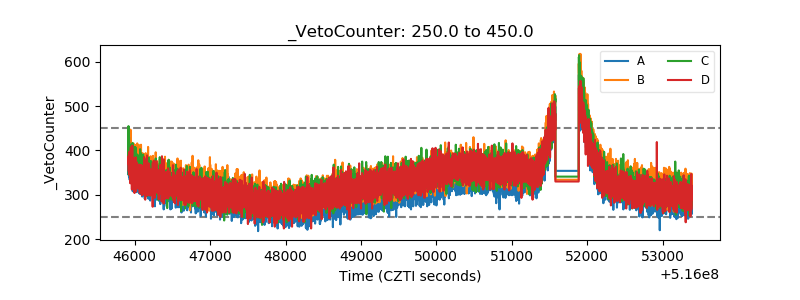 |