| Param | Original file | Final file |
|---|---|---|
| Filename | modeM0/AS1A14_102T01_9000006572_57427cztM0_level2.fits | modeM0/AS1A14_102T01_9000006572_57427cztM0_level2_quad_clean.evt |
| Size (bytes) | 651,867,840 | 96,727,680 |
| Size | 621.7 MB | 92.2 MB |
| Events in quadrant A | 5,315,567 | 651,890 |
| Events in quadrant B | 3,909,681 | 668,655 |
| Events in quadrant C | 7,406,189 | 529,300 |
| Events in quadrant D | 6,891,006 | 533,640 |
| Mode M0 | |||
|---|---|---|---|
| Quadrant | BADHDUFLAG | Total packets | Discarded packets |
| A | 0 | 21194 | 1 |
| B | 0 | 17360 | 1 |
| C | 0 | 27593 | 1 |
| D | 0 | 25998 | 1 |
| Mode SS | |||
|---|---|---|---|
| Quadrant | BADHDUFLAG | Total packets | Discarded packets |
| A | 0 | 156 | 0 |
| B | 0 | 156 | 0 |
| C | 0 | 156 | 0 |
| D | 0 | 156 | 0 |
| Quadrant | Total seconds | Saturated seconds | Saturation percentage |
|---|---|---|---|
| A | 7838 | 251 | 3.202348% |
| B | 7838 | 108 | 1.377903% |
| C | 7838 | 1128 | 14.391426% |
| D | 7838 | 778 | 9.926002% |
Noise dominated data is calculated using 1-second bins in cleaned event files. If a bin has >2000 counts, and if more than 50% of those come from <1% of pixels, then it is considered to be noise-dominated and hence unusable.
| Quadrant | # 1 sec bins | Bins with >0 counts | Bins with >2000 counts | High rate bins dominated by noise | Noise dominated (total time) | Noise dominated (detector-on time) | Marked lightcurve |
|---|---|---|---|---|---|---|---|
| A | 8120 | 8120 | 171 | 171 | 2.11% | 2.11% | 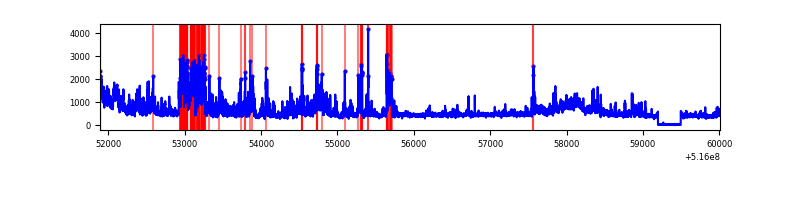 |
| B | 8120 | 8120 | 45 | 45 | 0.55% | 0.55% | 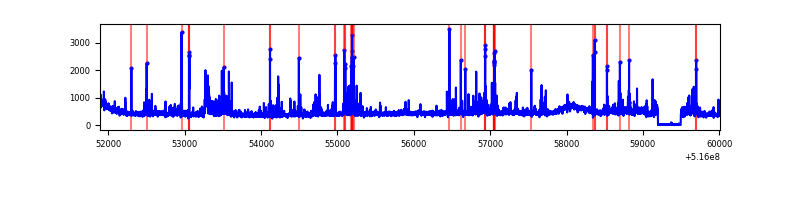 |
| C | 8120 | 8120 | 1028 | 1028 | 12.66% | 12.66% | 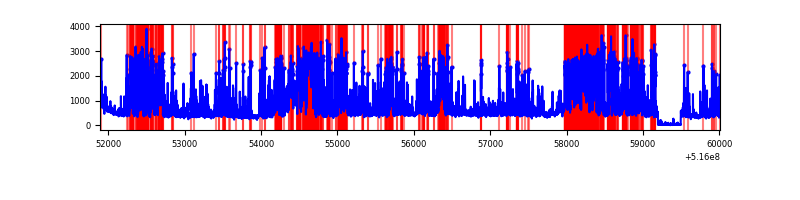 |
| D | 8120 | 8120 | 742 | 742 | 9.14% | 9.14% | 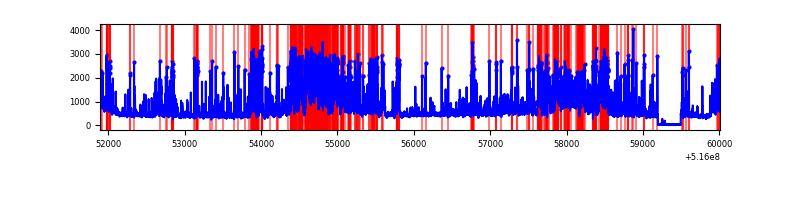 |
Top three noisy pixels from each quadrant. If the there are fewer than three noisy pixels in the level2.evt file, extra rows are filled as -1
| Pixel properties | Quadrant properties | ||||||
|---|---|---|---|---|---|---|---|
| Quadrant | DetID | PixID | Counts | Sigma | Mean | Median | Sigma |
| A | 7 | 64 | 1515519 | 7317.86 | 841 | 819 | 207.0 |
| A | 10 | 251 | 203019 | 976.87 | 841 | 819 | 207.0 |
| A | 8 | 4 | 146789 | 705.21 | 841 | 819 | 207.0 |
| B | 0 | 216 | 197269 | 1093.87 | 835 | 803 | 179.6 |
| B | 5 | 185 | 127918 | 707.74 | 835 | 803 | 179.6 |
| B | 10 | 247 | 73962 | 407.33 | 835 | 803 | 179.6 |
| C | 15 | 224 | 3763193 | 18286.14 | 758 | 750 | 205.8 |
| C | 14 | 254 | 423477 | 2054.53 | 758 | 750 | 205.8 |
| C | 6 | 223 | 158803 | 768.17 | 758 | 750 | 205.8 |
| D | 2 | 249 | 1339470 | 6078.08 | 786 | 751 | 220.3 |
| D | 13 | 154 | 614554 | 2786.8 | 786 | 751 | 220.3 |
| D | 15 | 142 | 493243 | 2236.02 | 786 | 751 | 220.3 |
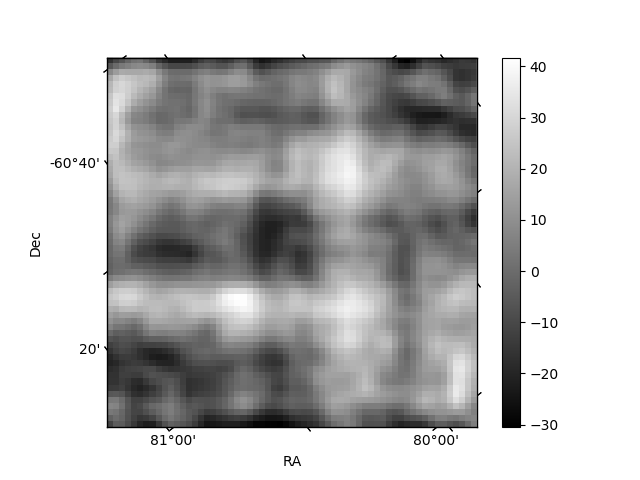
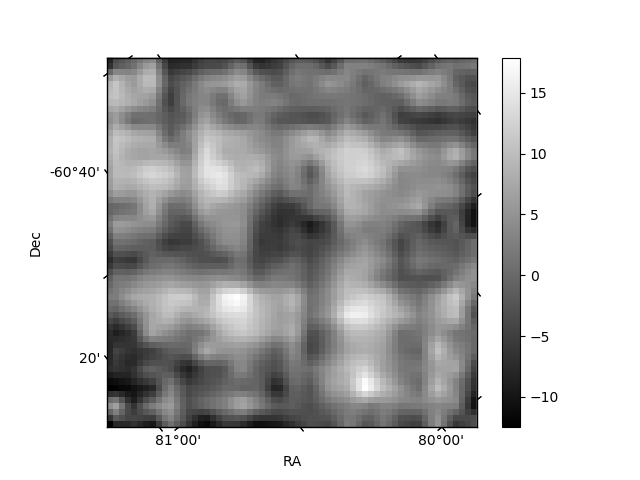
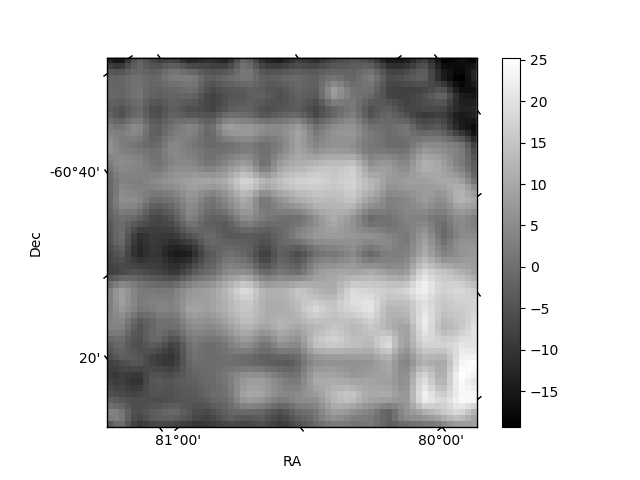
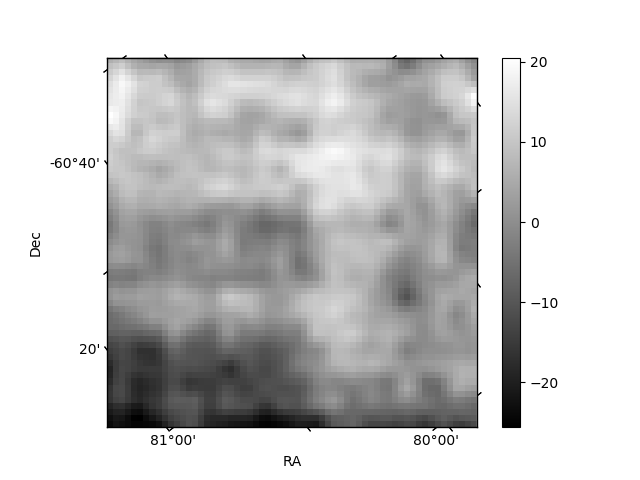
Histogram calculated using DETX and DETY for each event in the final _common_clean file
| Quadrant A | 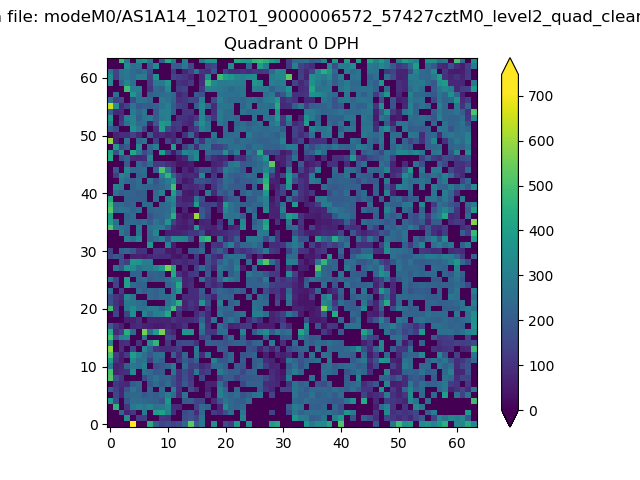 |
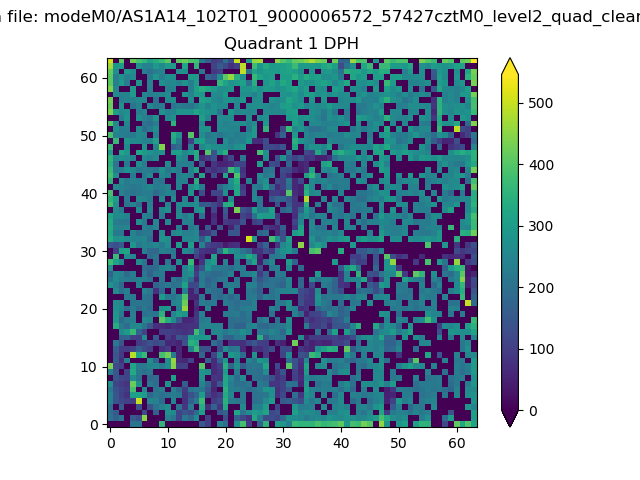 |
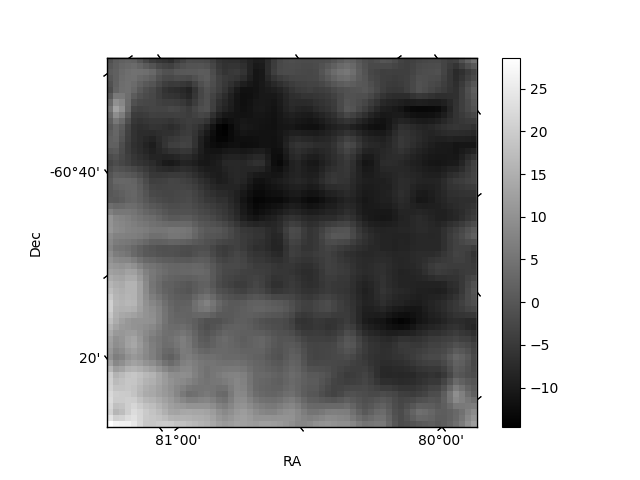
Quadrant B |
|---|---|---|---|
| Quadrant D | 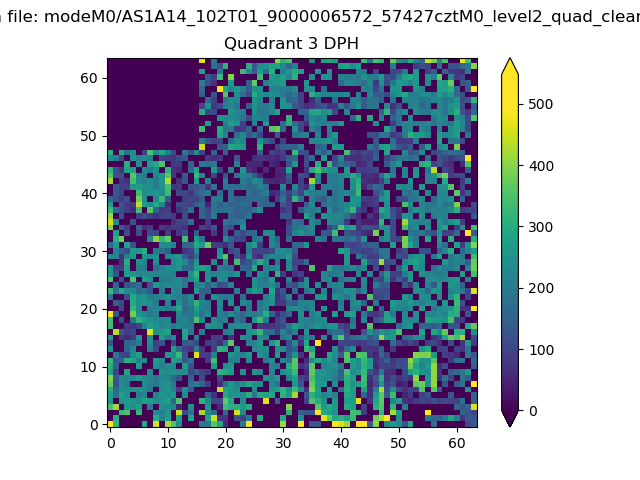 |
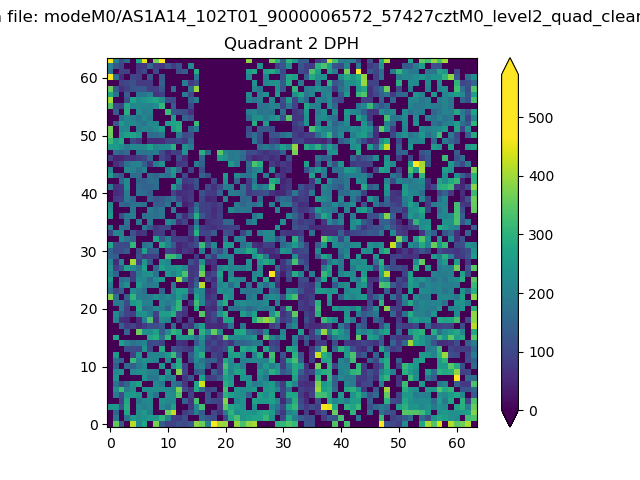 |
Quadrant C |
| Plot type | Count rate plots | Images |
|---|---|---|
| Comparison with Poisson distribution Blue bars denote a histogram of data divided into 1 sec bins. Red curve is a Poisson curve with rate = median count rate of data. |
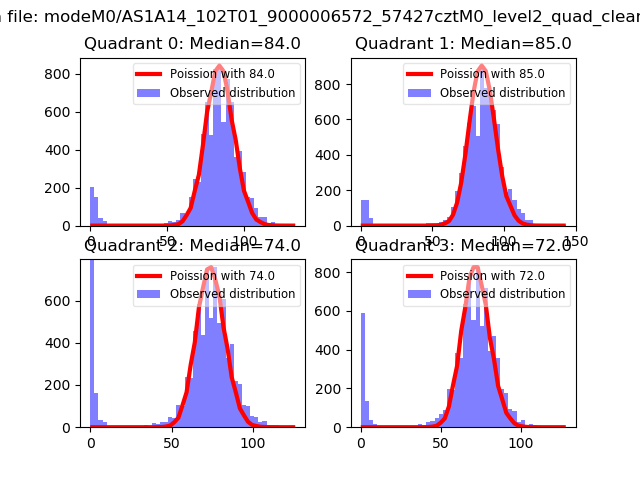 |
 |
| Quadrant-wise count rates Data is divided into 100 sec bins |
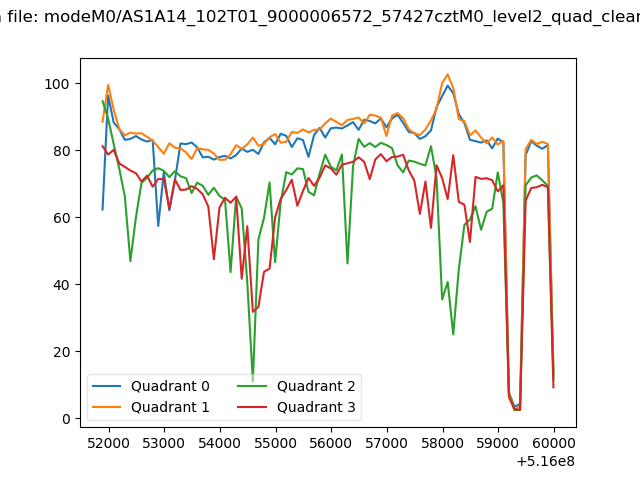 |
|
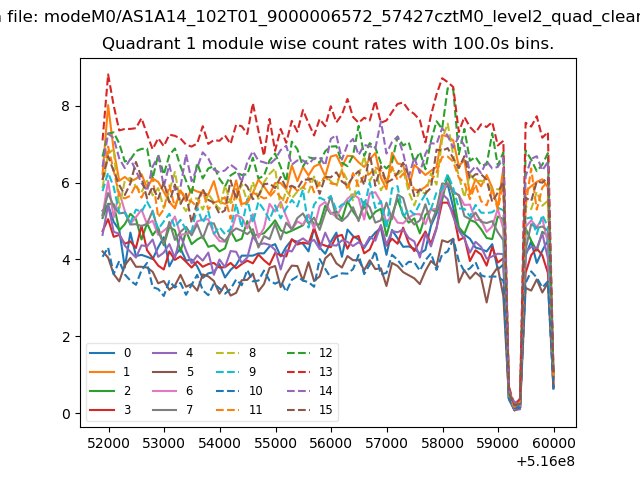
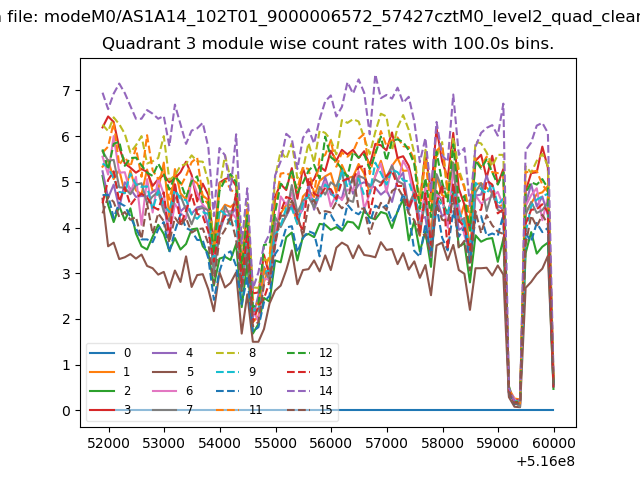
| Module-wise count rates for Quadrant A Data is divided into 100 sec bins |
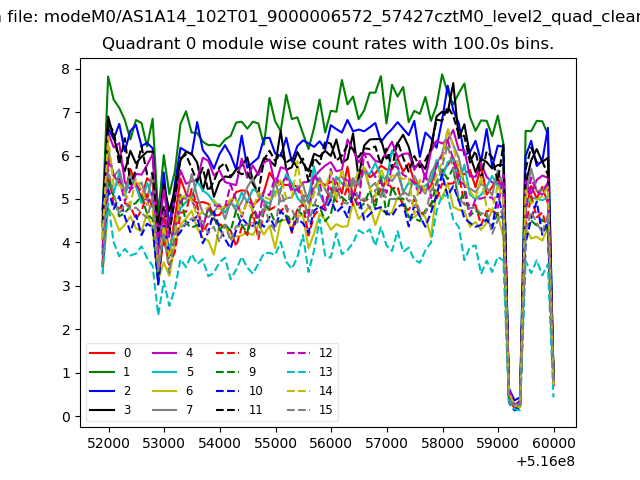 |
 |
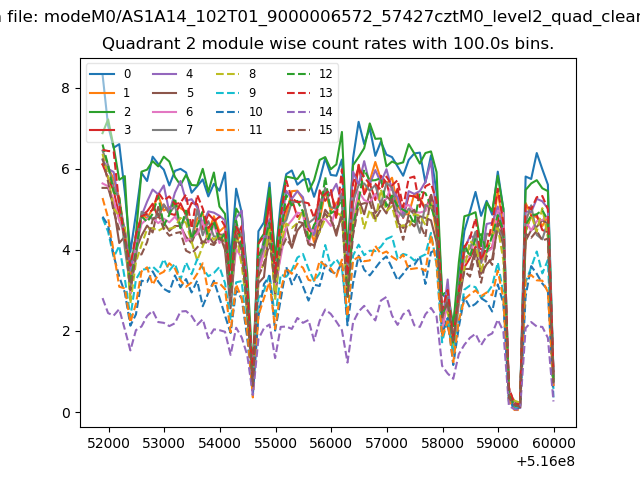
| Module-wise count rates for Quadrant B Data is divided into 100 sec bins |
 |
 |
| Module-wise count rates for Quadrant C Data is divided into 100 sec bins |
 |
 |
| Module-wise count rates for Quadrant D Data is divided into 100 sec bins |
 |
 |
| Parameter | Plot |
|---|---|
| CZT HV Monitor | 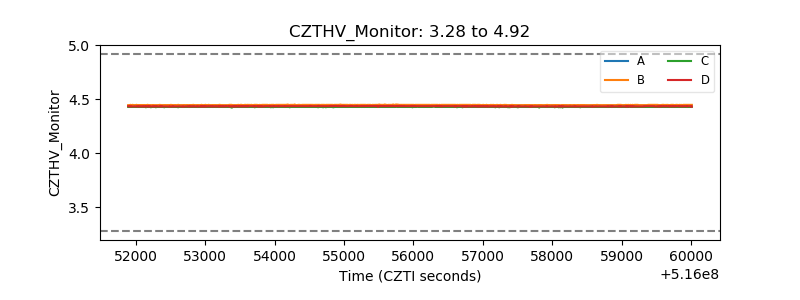 |
| D_VDD | 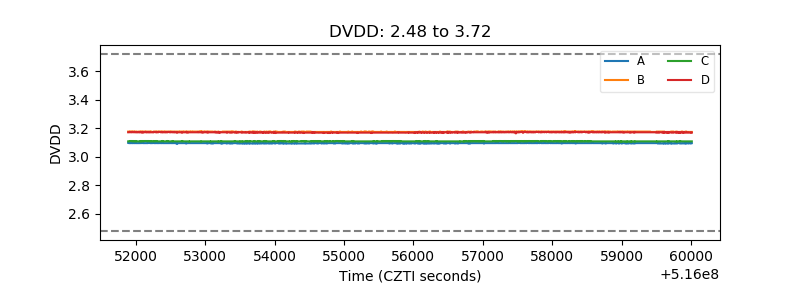 |
| Temperature 1 | 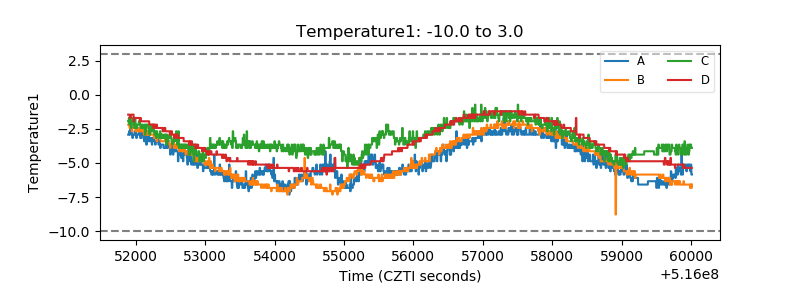 |
| Veto HV Monitor | 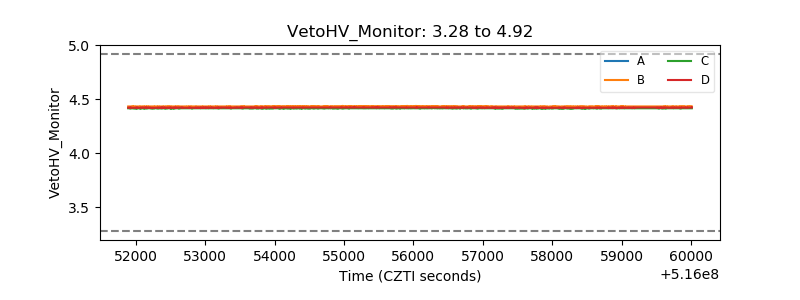 |
| Veto LLD | 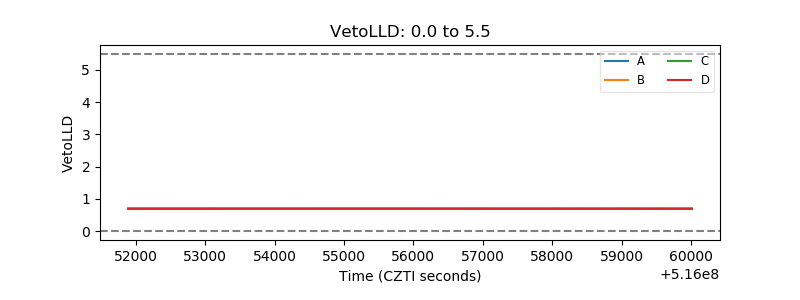 |
| Alpha Counter | 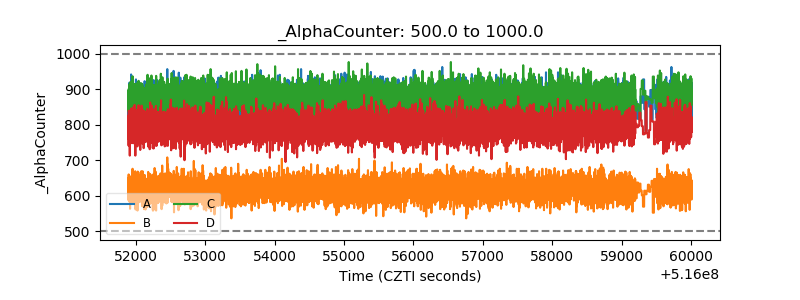 |
| _CPM_Rate | 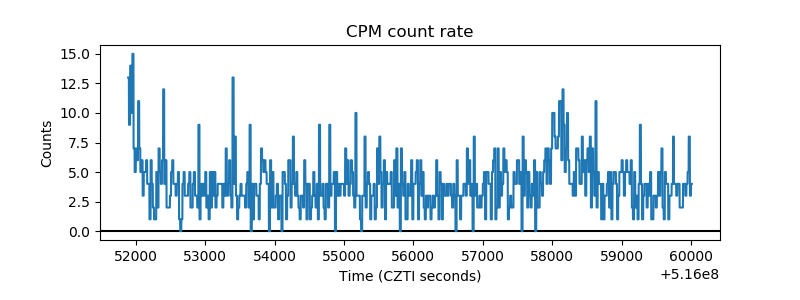 |
| CZT Counter | 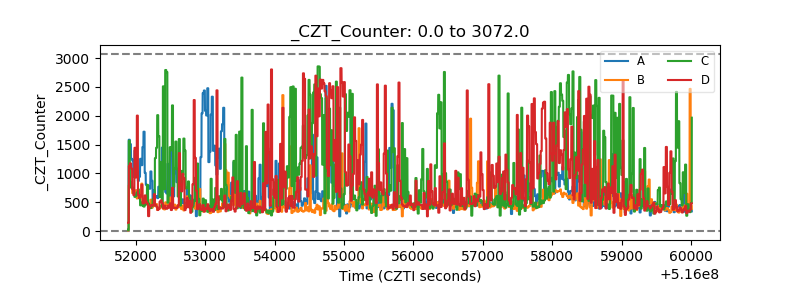 |
| +2.5 Volts monitor | 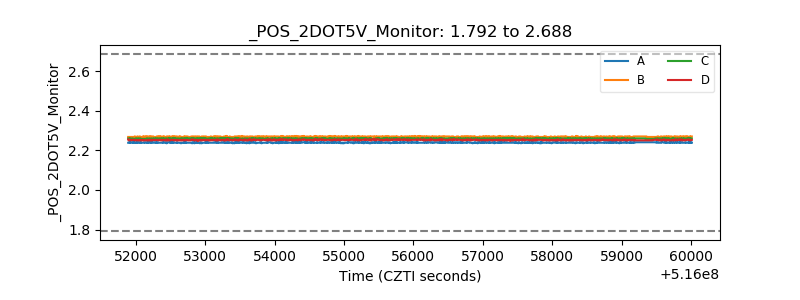 |
| +5 Volts monitor | 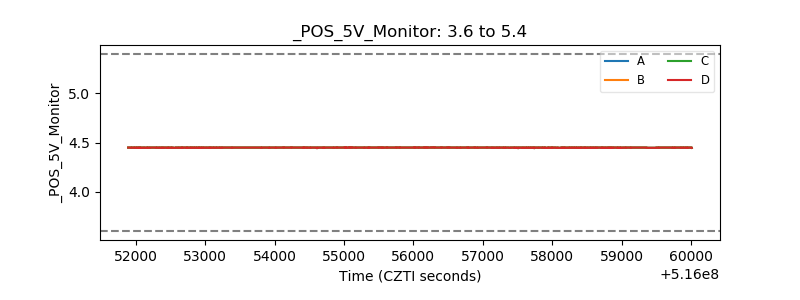 |
| _ROLL_ROT | 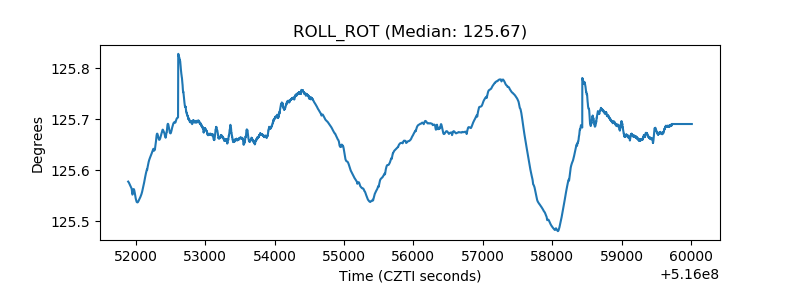 |
| _Roll_DEC | 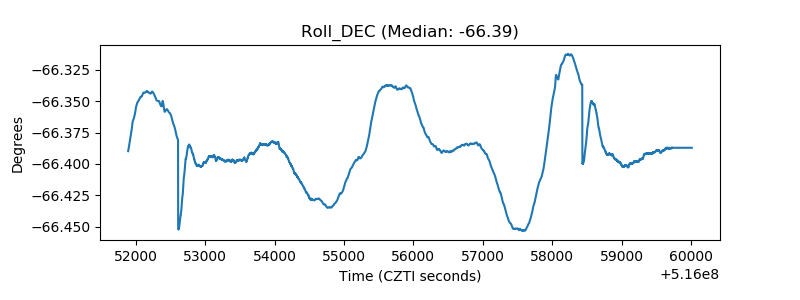 |
| _Roll_RA | 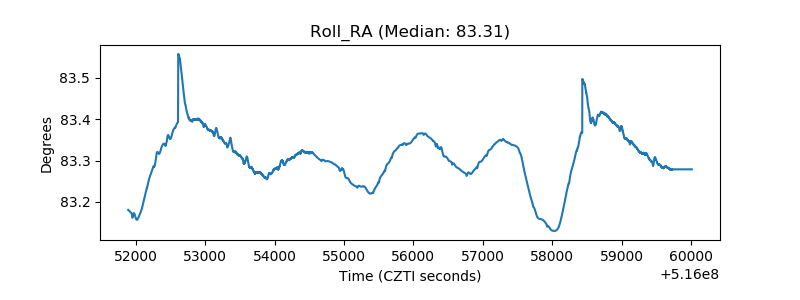 |
| Veto Counter | 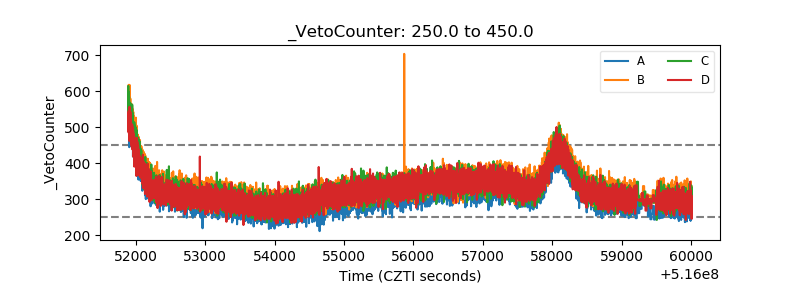 |