| Param | Original file | Final file |
|---|---|---|
| Filename | modeM0/AS1A14_102T01_9000006572_57428cztM0_level2.fits | modeM0/AS1A14_102T01_9000006572_57428cztM0_level2_quad_clean.evt |
| Size (bytes) | 641,900,160 | 105,563,520 |
| Size | 612.2 MB | 100.7 MB |
| Events in quadrant A | 4,901,357 | 691,603 |
| Events in quadrant B | 4,145,793 | 729,484 |
| Events in quadrant C | 7,851,502 | 597,884 |
| Events in quadrant D | 6,209,632 | 591,819 |
| Mode M0 | |||
|---|---|---|---|
| Quadrant | BADHDUFLAG | Total packets | Discarded packets |
| A | 0 | 20587 | 0 |
| B | 0 | 18468 | 0 |
| C | 0 | 29234 | 0 |
| D | 0 | 24424 | 0 |
| Mode SS | |||
|---|---|---|---|
| Quadrant | BADHDUFLAG | Total packets | Discarded packets |
| A | 0 | 170 | 0 |
| B | 0 | 170 | 0 |
| C | 0 | 170 | 0 |
| D | 0 | 170 | 0 |
| Quadrant | Total seconds | Saturated seconds | Saturation percentage |
|---|---|---|---|
| A | 8417 | 134 | 1.592016% |
| B | 8418 | 131 | 1.556189% |
| C | 8418 | 1136 | 13.494892% |
| D | 8418 | 513 | 6.094084% |
Noise dominated data is calculated using 1-second bins in cleaned event files. If a bin has >2000 counts, and if more than 50% of those come from <1% of pixels, then it is considered to be noise-dominated and hence unusable.
| Quadrant | # 1 sec bins | Bins with >0 counts | Bins with >2000 counts | High rate bins dominated by noise | Noise dominated (total time) | Noise dominated (detector-on time) | Marked lightcurve |
|---|---|---|---|---|---|---|---|
| A | 8700 | 8700 | 12 | 12 | 0.14% | 0.14% | 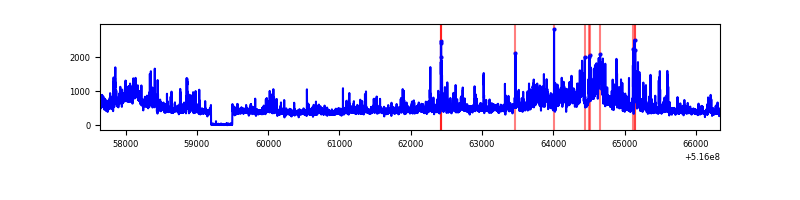 |
| B | 8701 | 8701 | 41 | 41 | 0.47% | 0.47% | 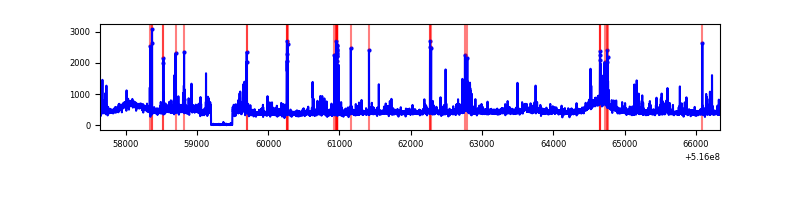 |
| C | 8701 | 8701 | 985 | 985 | 11.32% | 11.32% | 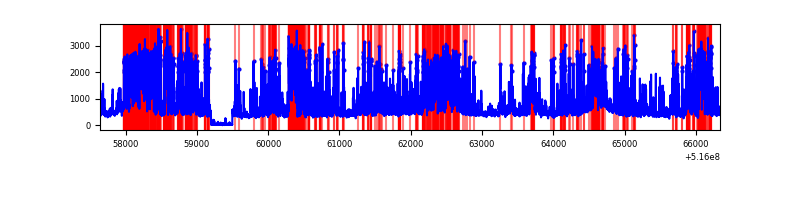 |
| D | 8701 | 8701 | 459 | 459 | 5.28% | 5.28% | 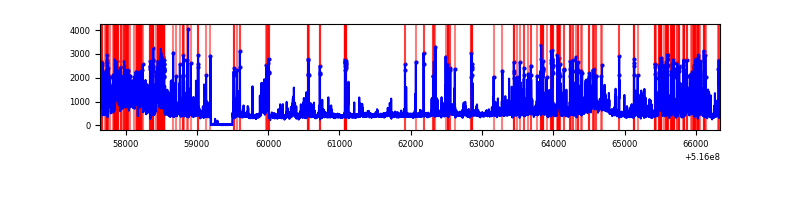 |
Top three noisy pixels from each quadrant. If the there are fewer than three noisy pixels in the level2.evt file, extra rows are filled as -1
| Pixel properties | Quadrant properties | ||||||
|---|---|---|---|---|---|---|---|
| Quadrant | DetID | PixID | Counts | Sigma | Mean | Median | Sigma |
| A | 7 | 64 | 1175702 | 5210.67 | 917 | 890 | 225.5 |
| A | 3 | 14 | 47045 | 204.71 | 917 | 890 | 225.5 |
| A | 0 | 12 | 38266 | 165.77 | 917 | 890 | 225.5 |
| B | 0 | 216 | 133809 | 680.43 | 908 | 871 | 195.4 |
| B | 0 | 213 | 107712 | 546.86 | 908 | 871 | 195.4 |
| B | 5 | 185 | 103095 | 523.22 | 908 | 871 | 195.4 |
| C | 15 | 224 | 3657394 | 16240.97 | 830 | 821 | 225.1 |
| C | 14 | 254 | 425236 | 1885.07 | 830 | 821 | 225.1 |
| C | 13 | 3 | 279393 | 1237.3 | 830 | 821 | 225.1 |
| D | 8 | 240 | 673903 | 2772.1 | 867 | 828 | 242.8 |
| D | 2 | 249 | 563196 | 2316.15 | 867 | 828 | 242.8 |
| D | 13 | 154 | 546781 | 2248.54 | 867 | 828 | 242.8 |
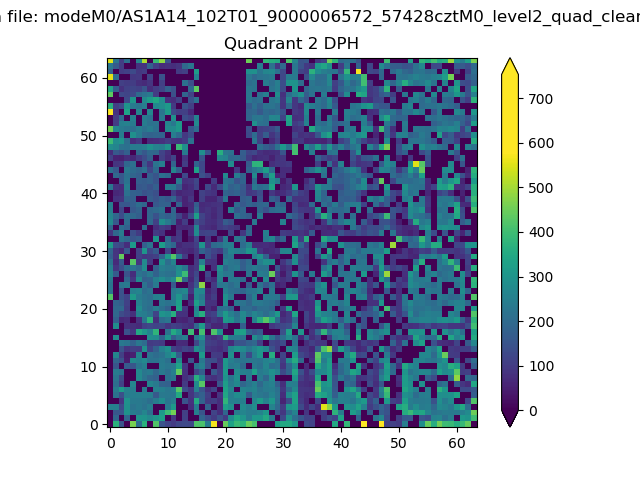
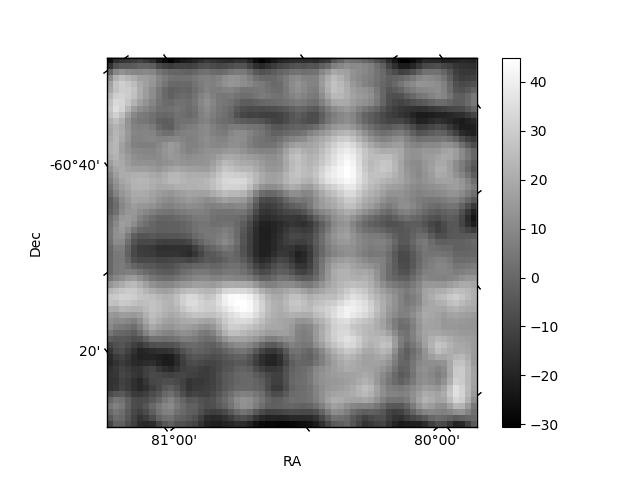
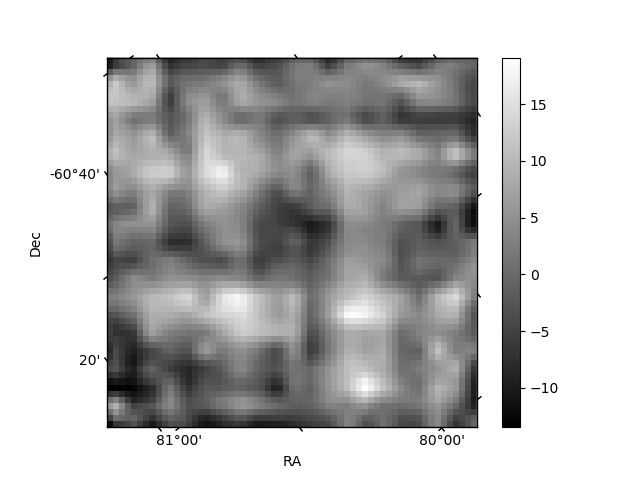
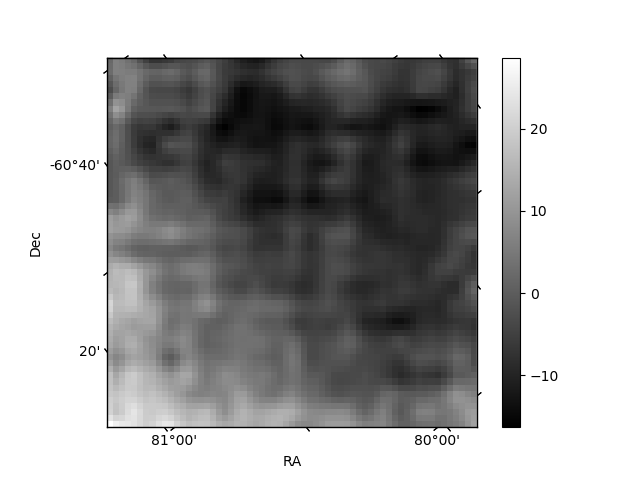
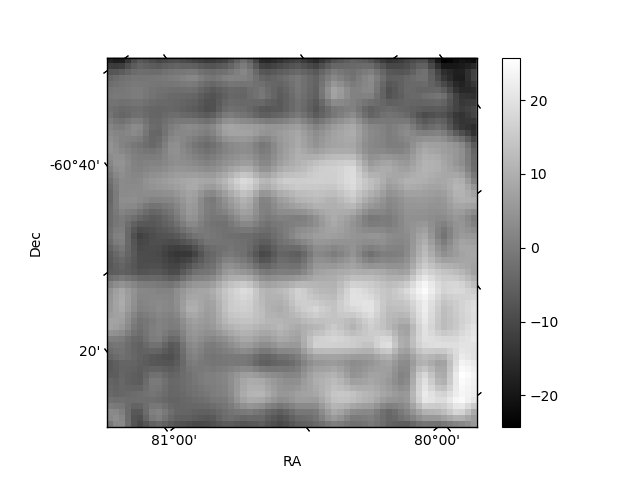
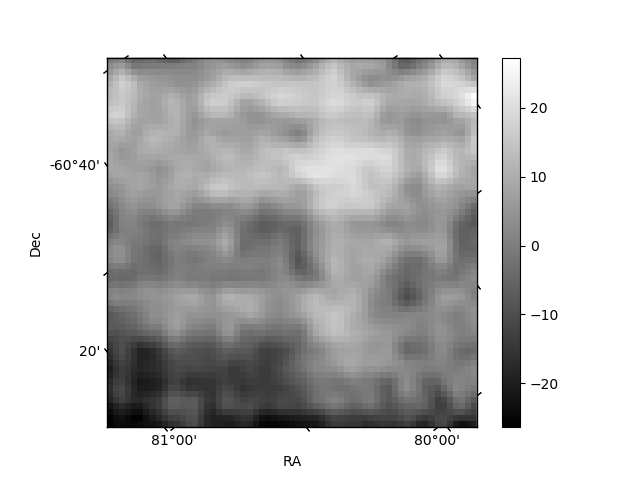
Histogram calculated using DETX and DETY for each event in the final _common_clean file
| Quadrant A | 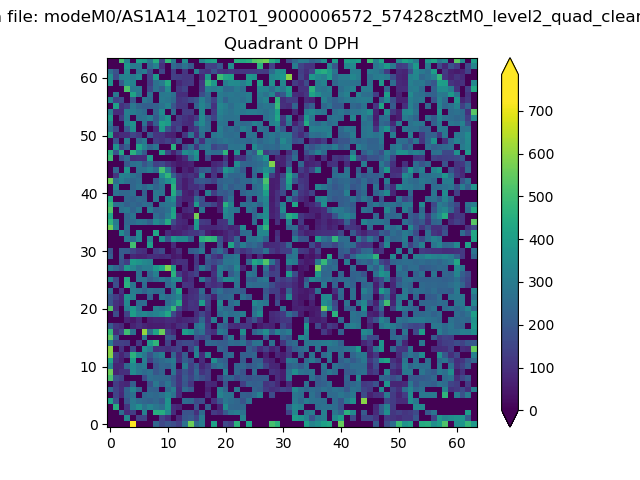 |
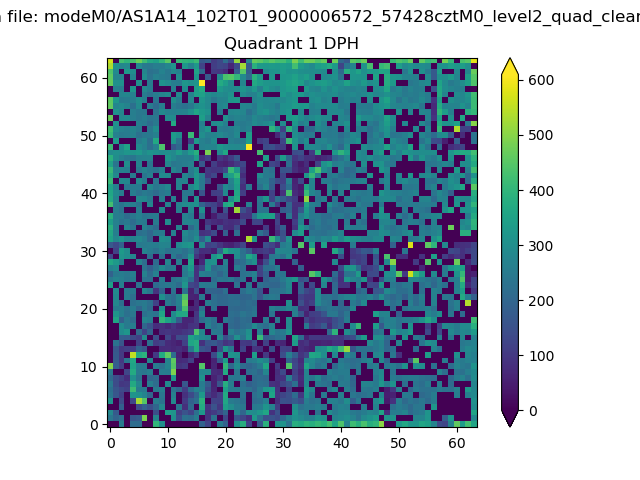 |
Quadrant B |
|---|---|---|---|
| Quadrant D | 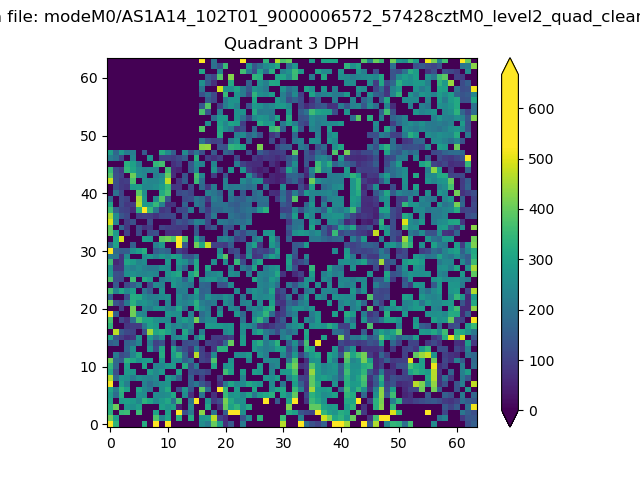 |
 |
Quadrant C |
| Plot type | Count rate plots | Images |
|---|---|---|
| Comparison with Poisson distribution Blue bars denote a histogram of data divided into 1 sec bins. Red curve is a Poisson curve with rate = median count rate of data. |
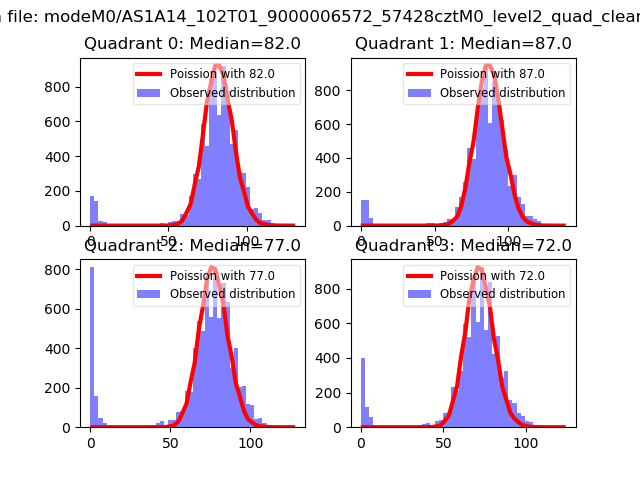 |
 |
| Quadrant-wise count rates Data is divided into 100 sec bins |
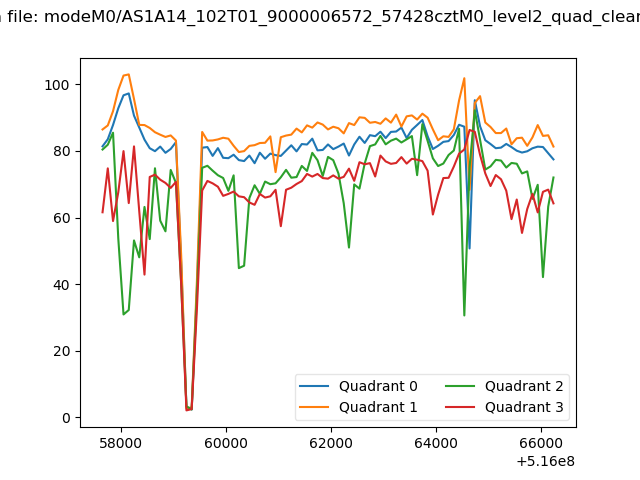 |
|
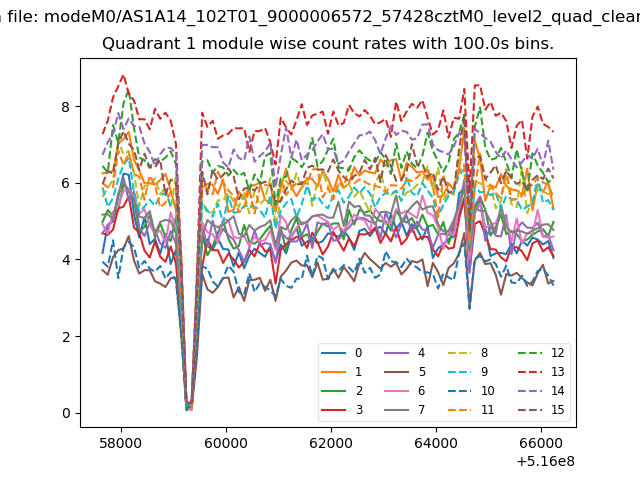
| Module-wise count rates for Quadrant A Data is divided into 100 sec bins |
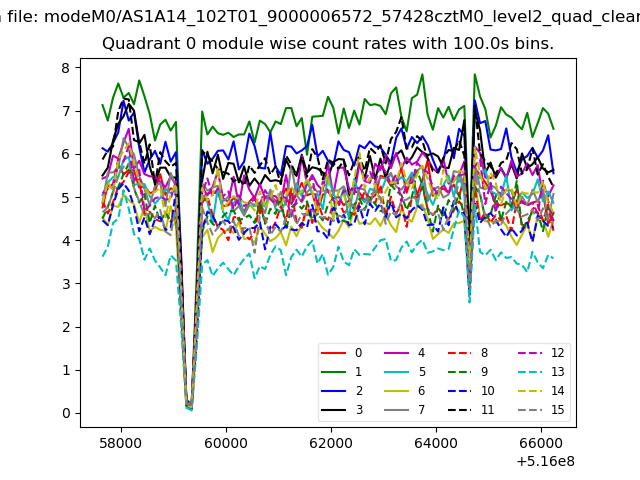 |
 |
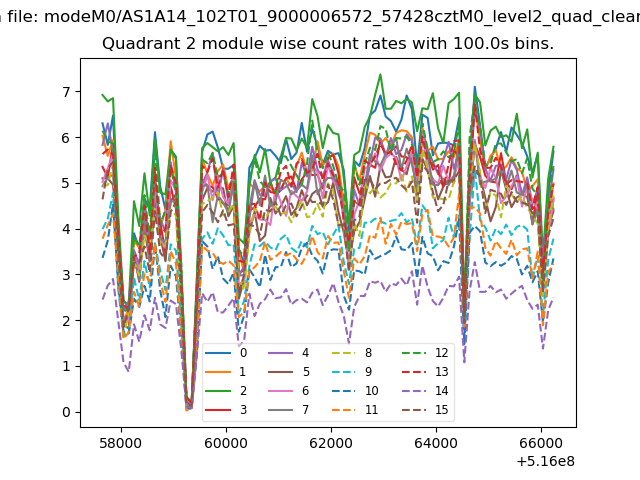
| Module-wise count rates for Quadrant B Data is divided into 100 sec bins |
 |
 |
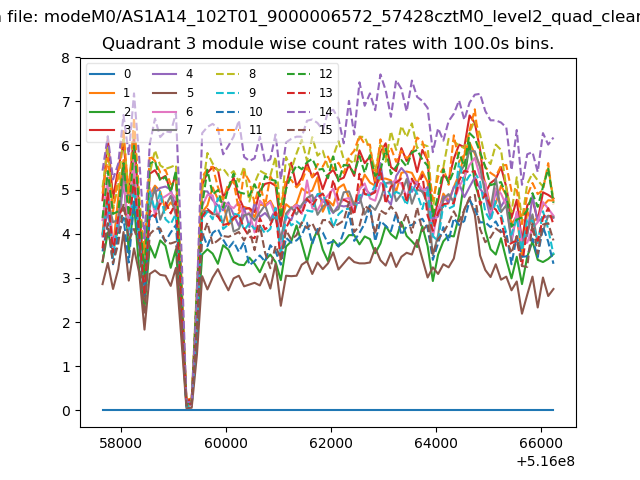
| Module-wise count rates for Quadrant C Data is divided into 100 sec bins |
 |
 |
| Module-wise count rates for Quadrant D Data is divided into 100 sec bins |
 |
 |
| Parameter | Plot |
|---|---|
| CZT HV Monitor |  |
| D_VDD | 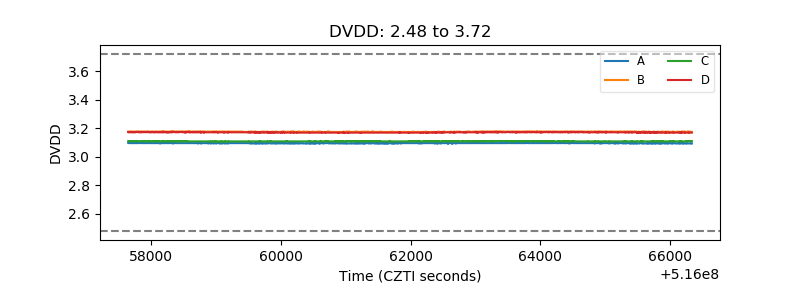 |
| Temperature 1 | 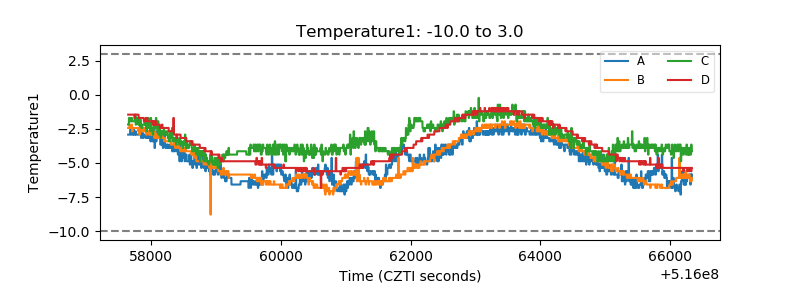 |
| Veto HV Monitor | 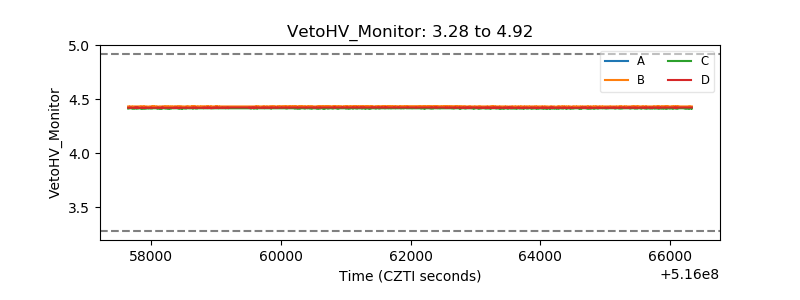 |
| Veto LLD | 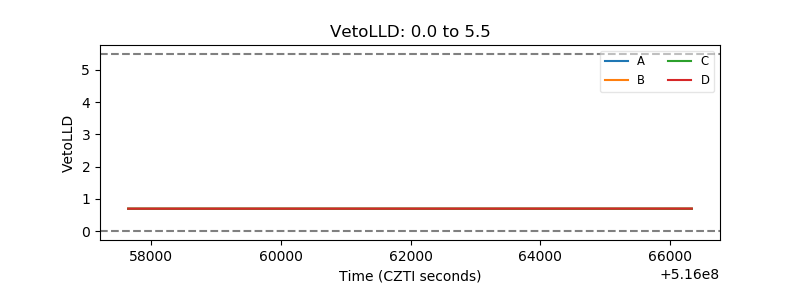 |
| Alpha Counter | 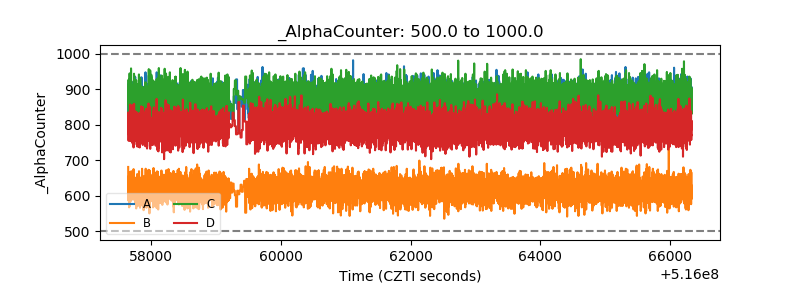 |
| _CPM_Rate | 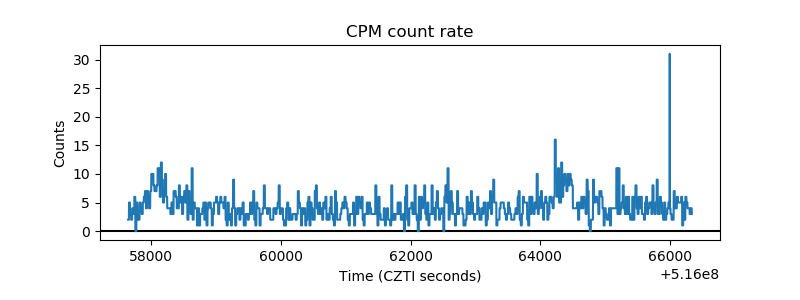 |
| CZT Counter | 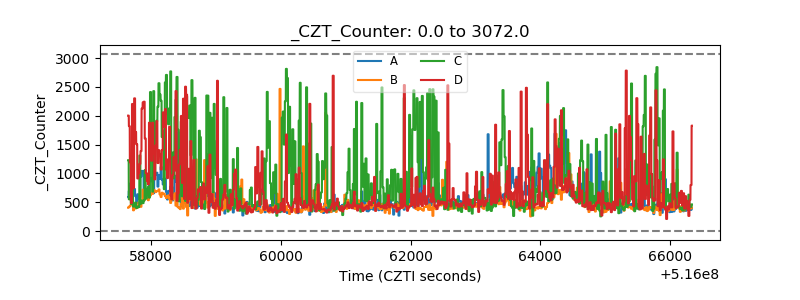 |
| +2.5 Volts monitor | 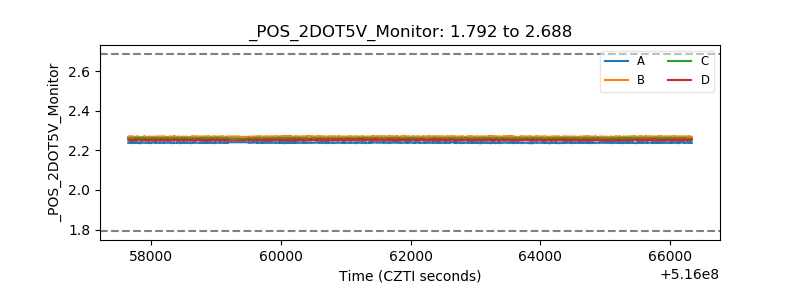 |
| +5 Volts monitor | 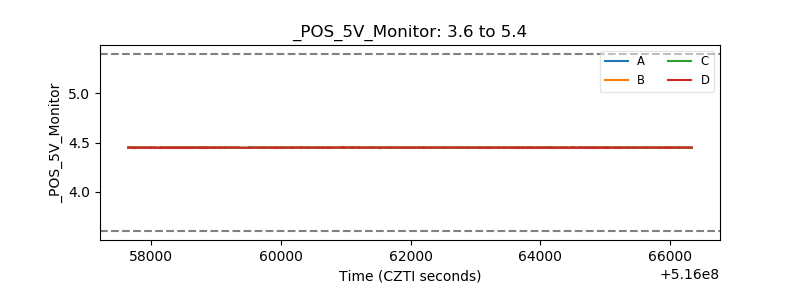 |
| _ROLL_ROT | 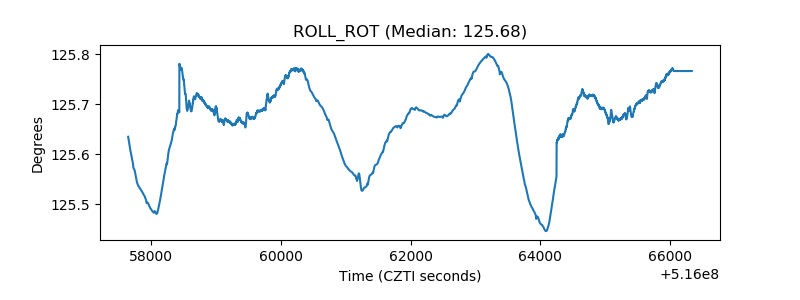 |
| _Roll_DEC | 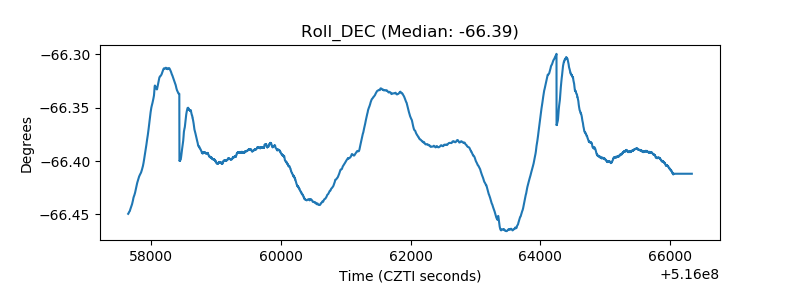 |
| _Roll_RA | 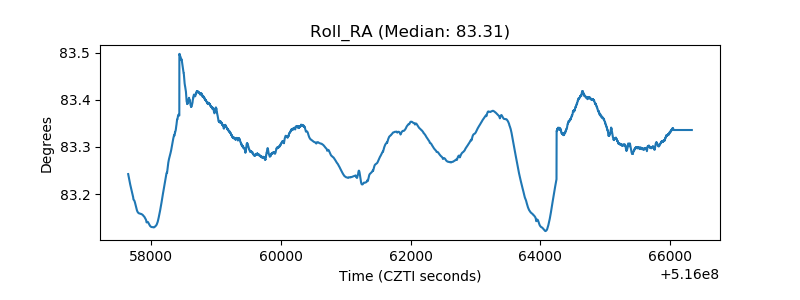 |
| Veto Counter | 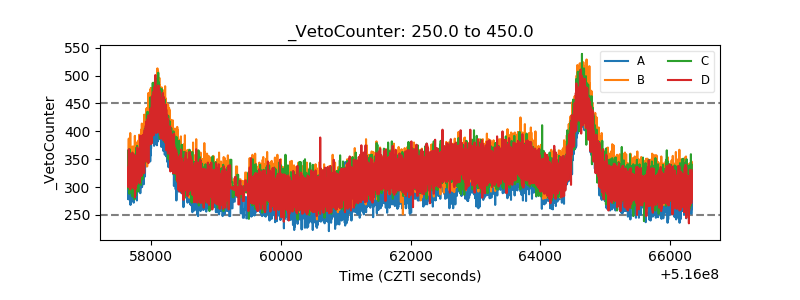 |