| Param | Original file | Final file |
|---|---|---|
| Filename | modeM0/AS1A14_102T01_9000006572_57431cztM0_level2.fits | modeM0/AS1A14_102T01_9000006572_57431cztM0_level2_quad_clean.evt |
| Size (bytes) | 1,304,377,920 | 221,385,600 |
| Size | 1.2 GB | 211.1 MB |
| Events in quadrant A | 11,919,076 | 1,412,256 |
| Events in quadrant B | 9,279,555 | 1,445,956 |
| Events in quadrant C | 13,814,028 | 1,289,964 |
| Events in quadrant D | 11,779,223 | 1,224,630 |
| Mode M0 | |||
|---|---|---|---|
| Quadrant | BADHDUFLAG | Total packets | Discarded packets |
| A | 0 | 49223 | 4 |
| B | 0 | 41599 | 4 |
| C | 0 | 54552 | 4 |
| D | 0 | 48737 | 6 |
| Mode M9 | |||
|---|---|---|---|
| Quadrant | BADHDUFLAG | Total packets | Discarded packets |
| A | 0 | 11 | 0 |
| B | 0 | 11 | 0 |
| C | 0 | 11 | 0 |
| D | 0 | 11 | 0 |
| Mode SS | |||
|---|---|---|---|
| Quadrant | BADHDUFLAG | Total packets | Discarded packets |
| A | 0 | 394 | 0 |
| B | 0 | 394 | 0 |
| C | 0 | 394 | 0 |
| D | 0 | 394 | 0 |
| Quadrant | Total seconds | Saturated seconds | Saturation percentage |
|---|---|---|---|
| A | 19277 | 679 | 3.522332% |
| B | 19277 | 468 | 2.427764% |
| C | 19277 | 1285 | 6.665975% |
| D | 19276 | 875 | 4.539324% |
Noise dominated data is calculated using 1-second bins in cleaned event files. If a bin has >2000 counts, and if more than 50% of those come from <1% of pixels, then it is considered to be noise-dominated and hence unusable.
| Quadrant | # 1 sec bins | Bins with >0 counts | Bins with >2000 counts | High rate bins dominated by noise | Noise dominated (total time) | Noise dominated (detector-on time) | Marked lightcurve |
|---|---|---|---|---|---|---|---|
| A | 20776 | 19562 | 350 | 350 | 1.68% | 1.79% | 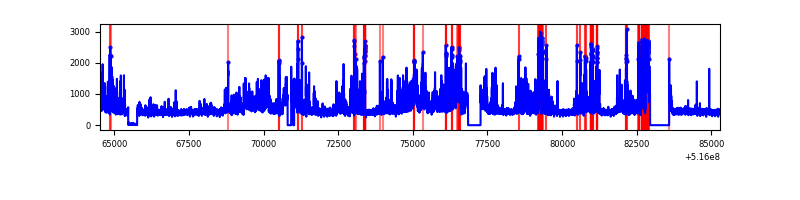 |
| B | 20776 | 19562 | 60 | 60 | 0.29% | 0.31% | 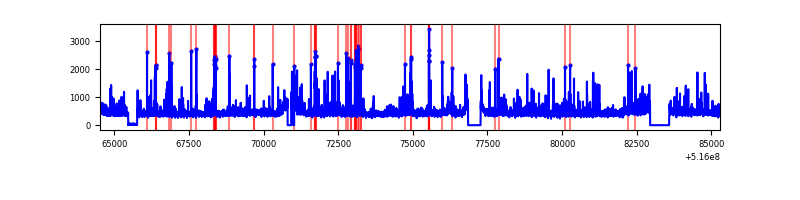 |
| C | 20776 | 19562 | 918 | 918 | 4.42% | 4.69% | 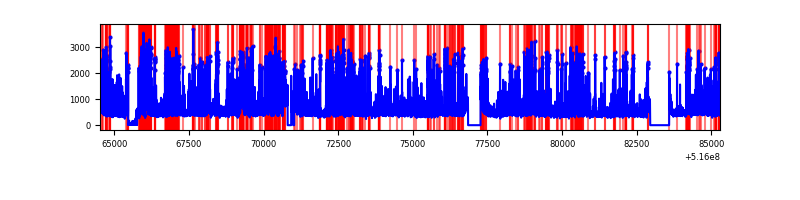 |
| D | 20775 | 19559 | 604 | 604 | 2.91% | 3.09% | 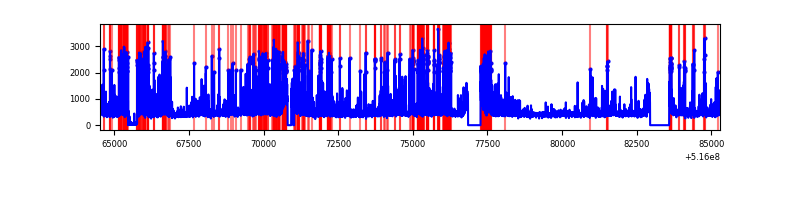 |
Top three noisy pixels from each quadrant. If the there are fewer than three noisy pixels in the level2.evt file, extra rows are filled as -1
| Pixel properties | Quadrant properties | ||||||
|---|---|---|---|---|---|---|---|
| Quadrant | DetID | PixID | Counts | Sigma | Mean | Median | Sigma |
| A | 10 | 251 | 1864796 | 3724.2 | 2053 | 1994 | 500.2 |
| A | 7 | 64 | 1830512 | 3655.65 | 2053 | 1994 | 500.2 |
| A | 0 | 12 | 88682 | 173.31 | 2053 | 1994 | 500.2 |
| B | 0 | 213 | 292162 | 662.92 | 2048 | 1966 | 437.8 |
| B | 5 | 185 | 243437 | 551.61 | 2048 | 1966 | 437.8 |
| B | 0 | 216 | 150625 | 339.59 | 2048 | 1966 | 437.8 |
| C | 15 | 224 | 4502874 | 8484.82 | 1976 | 1956 | 530.5 |
| C | 14 | 254 | 680310 | 1278.79 | 1976 | 1956 | 530.5 |
| C | 13 | 3 | 381401 | 715.3 | 1976 | 1956 | 530.5 |
| D | 2 | 249 | 1154050 | 2094.73 | 1980 | 1891 | 550.0 |
| D | 8 | 240 | 847681 | 1537.72 | 1980 | 1891 | 550.0 |
| D | 15 | 142 | 556443 | 1008.23 | 1980 | 1891 | 550.0 |
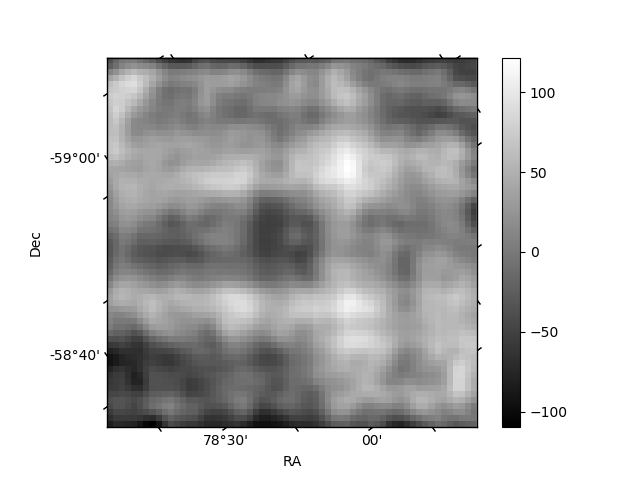
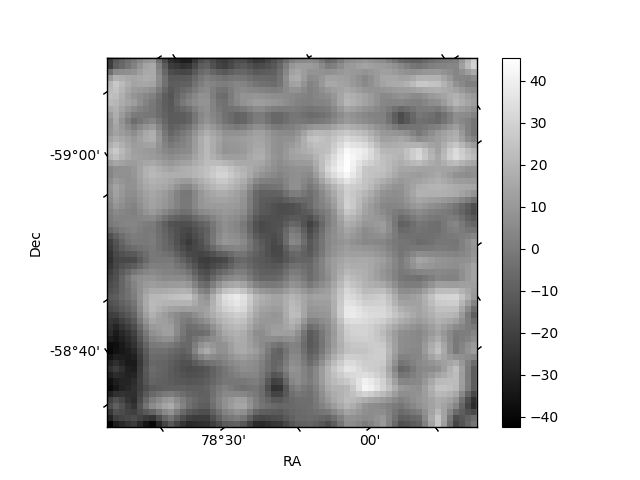
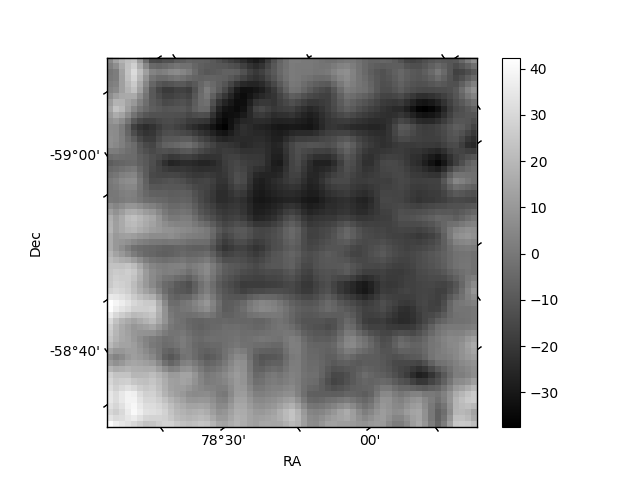
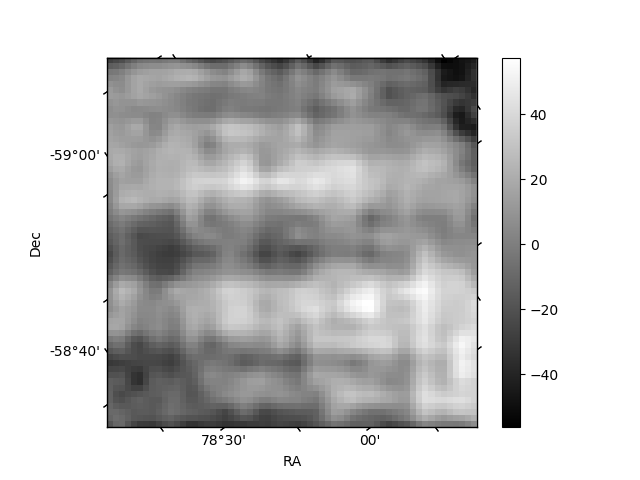
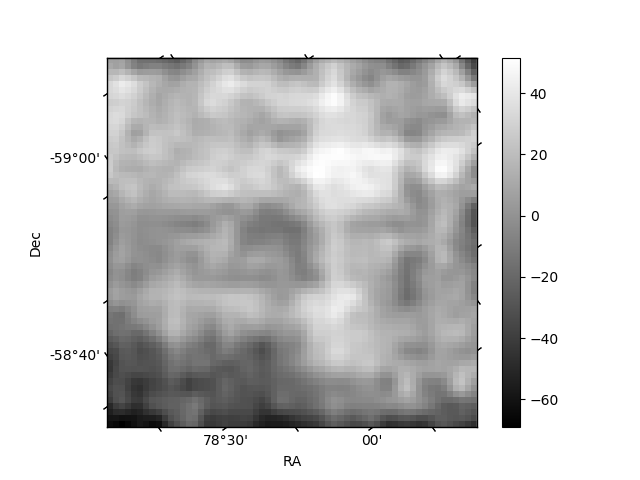
Histogram calculated using DETX and DETY for each event in the final _common_clean file
| Quadrant A | 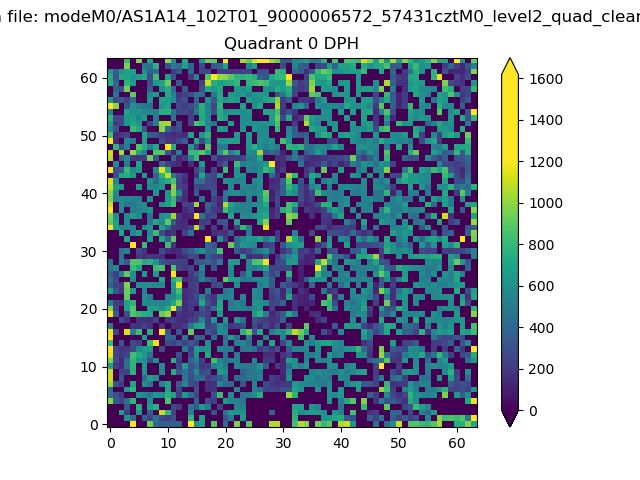 |
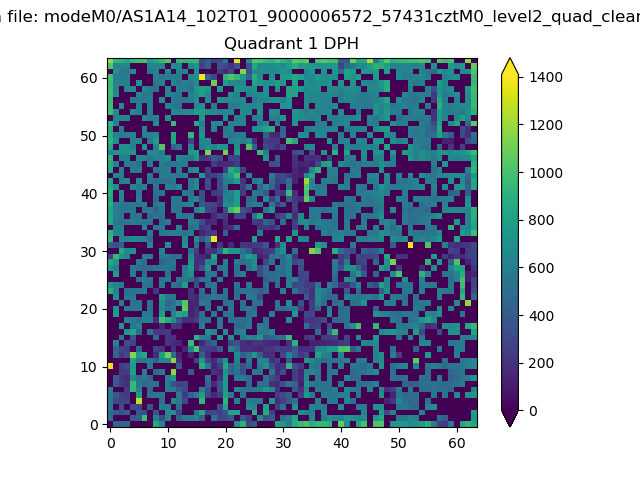 |
Quadrant B |
|---|---|---|---|
| Quadrant D | 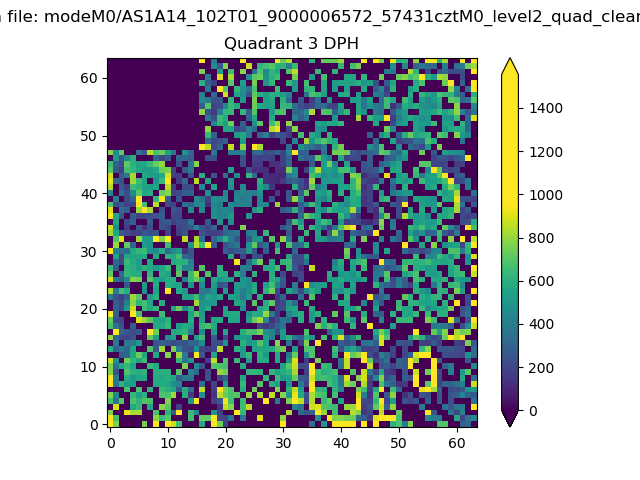 |
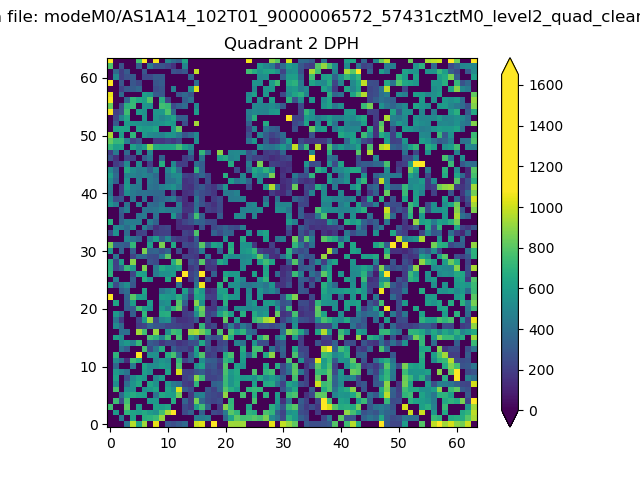 |
Quadrant C |
| Plot type | Count rate plots | Images |
|---|---|---|
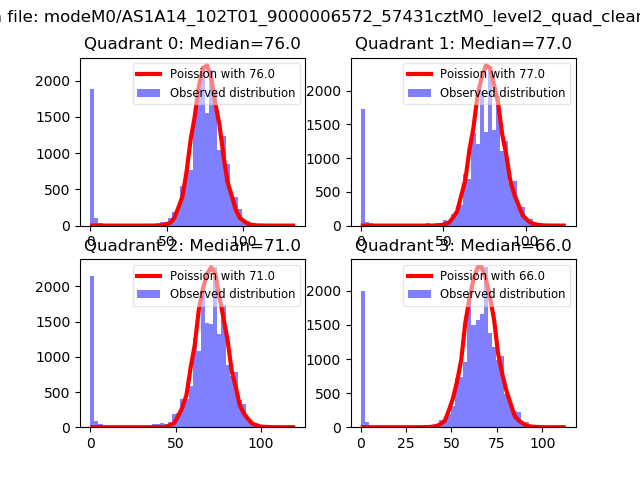
| Comparison with Poisson distribution Blue bars denote a histogram of data divided into 1 sec bins. Red curve is a Poisson curve with rate = median count rate of data. |
 |
 |
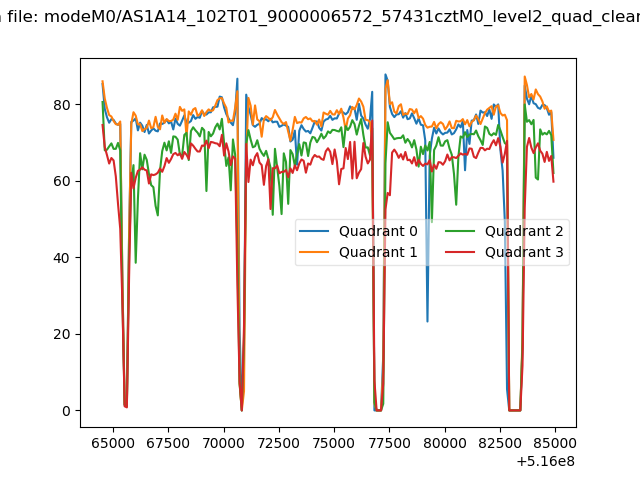
| Quadrant-wise count rates Data is divided into 100 sec bins |
 |
|
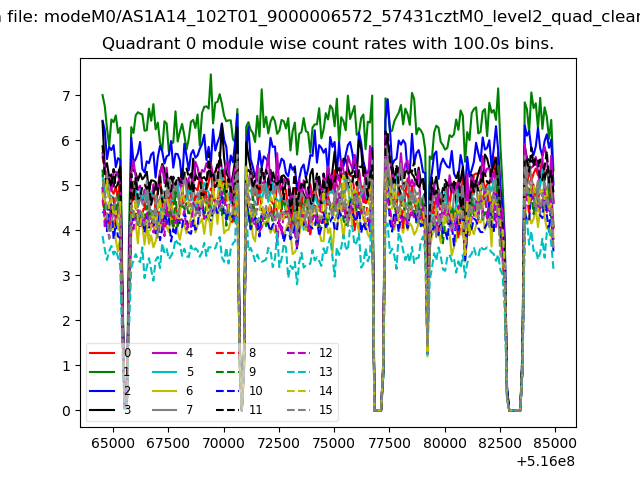
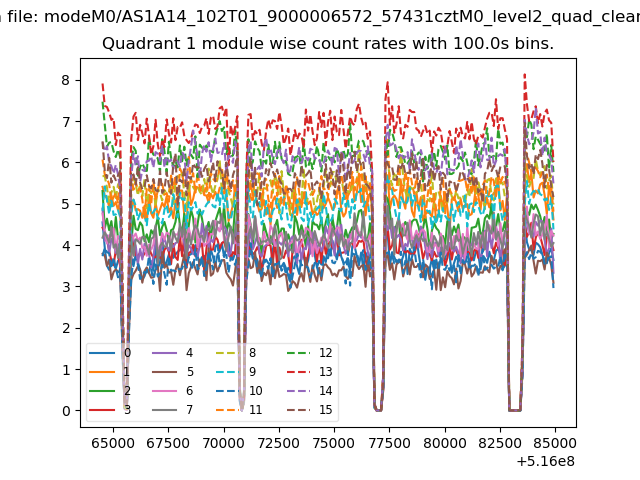
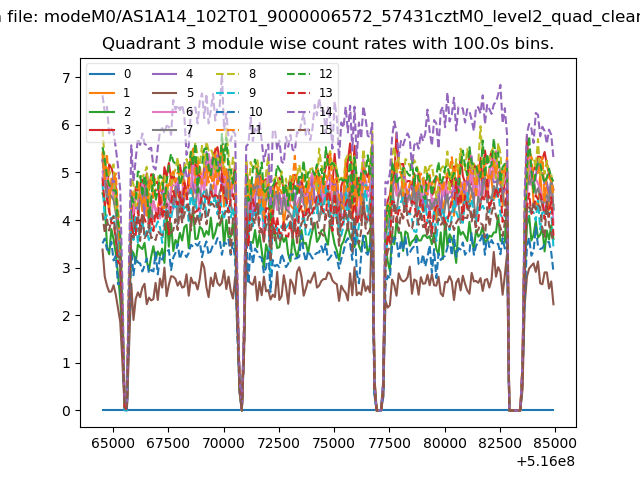
| Module-wise count rates for Quadrant A Data is divided into 100 sec bins |
 |
 |
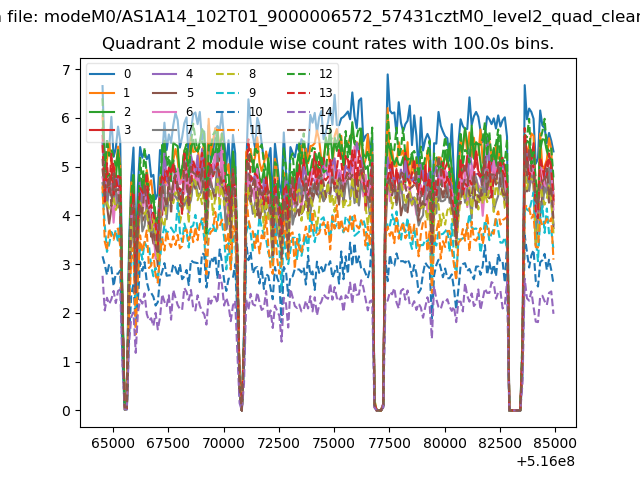
| Module-wise count rates for Quadrant B Data is divided into 100 sec bins |
 |
 |
| Module-wise count rates for Quadrant C Data is divided into 100 sec bins |
 |
 |
| Module-wise count rates for Quadrant D Data is divided into 100 sec bins |
 |
 |
| Parameter | Plot |
|---|---|
| CZT HV Monitor | 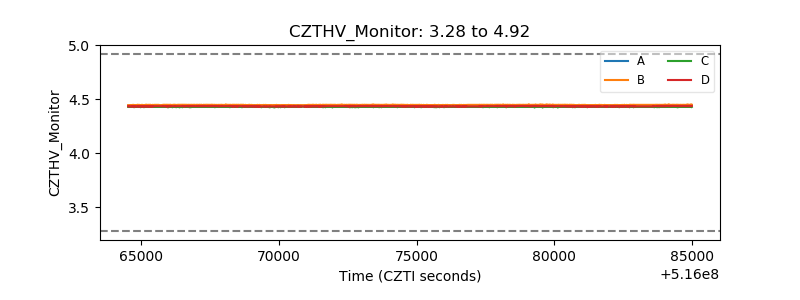 |
| D_VDD | 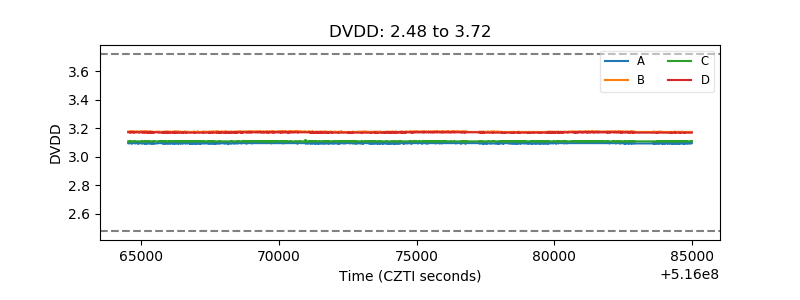 |
| Temperature 1 | 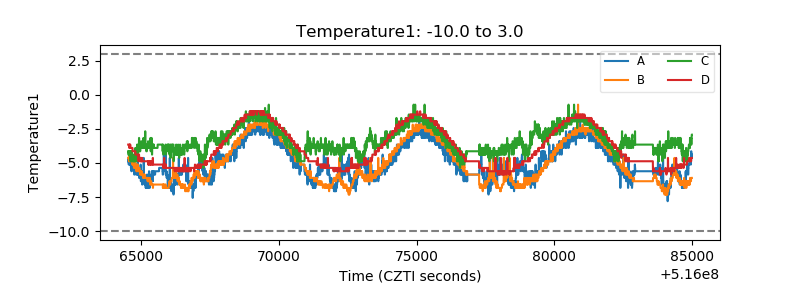 |
| Veto HV Monitor | 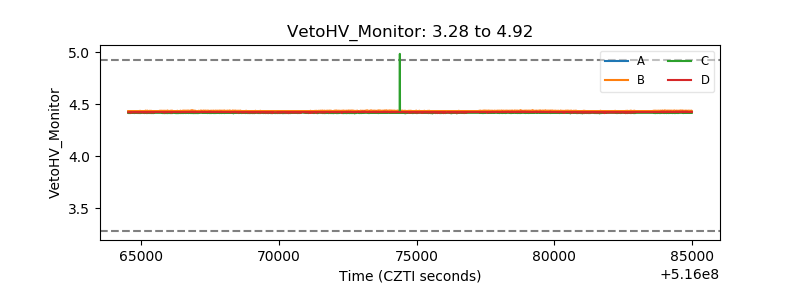 |
| Veto LLD | 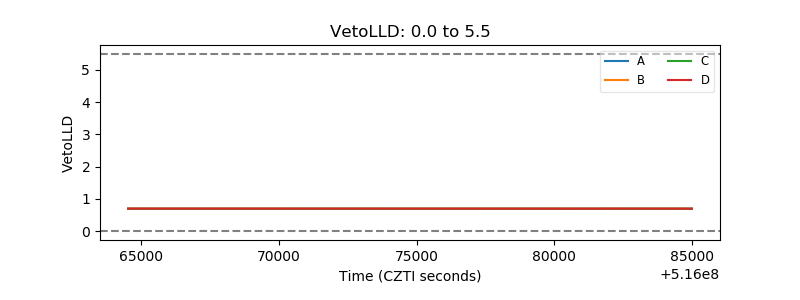 |
| Alpha Counter | 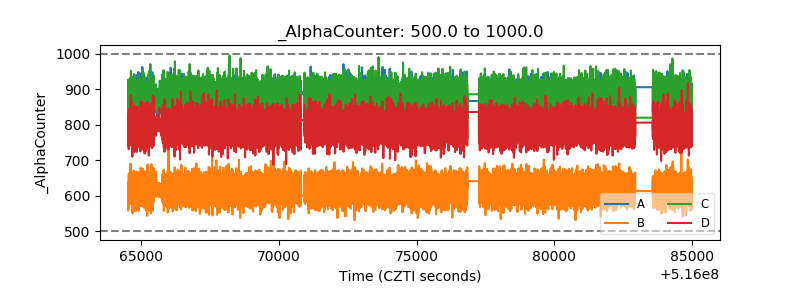 |
| _CPM_Rate | 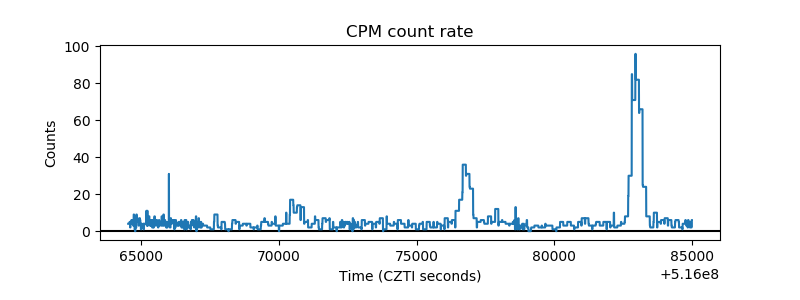 |
| CZT Counter | 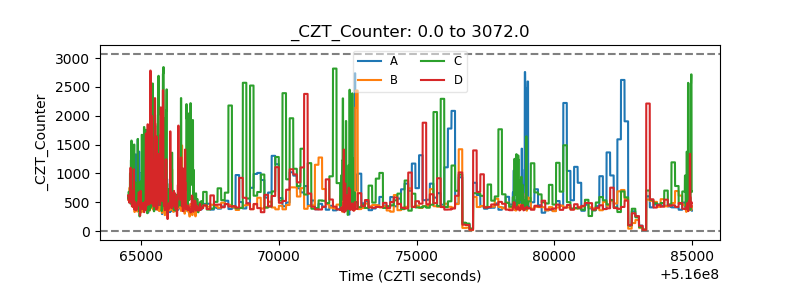 |
| +2.5 Volts monitor |  |
| +5 Volts monitor |  |
| _ROLL_ROT | 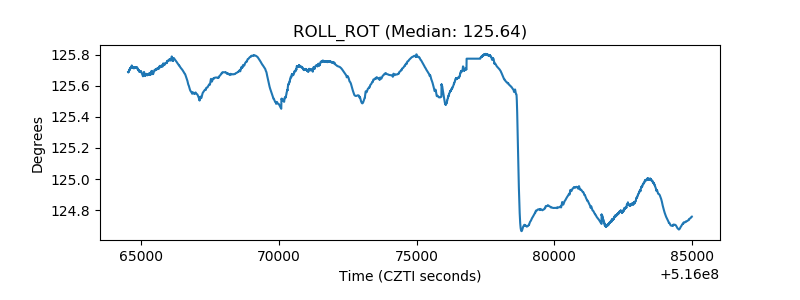 |
| _Roll_DEC | 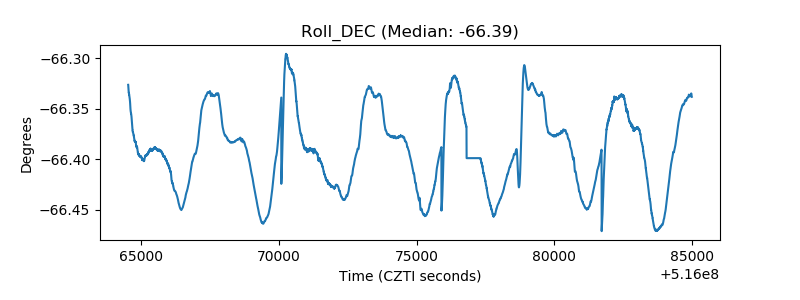 |
| _Roll_RA | 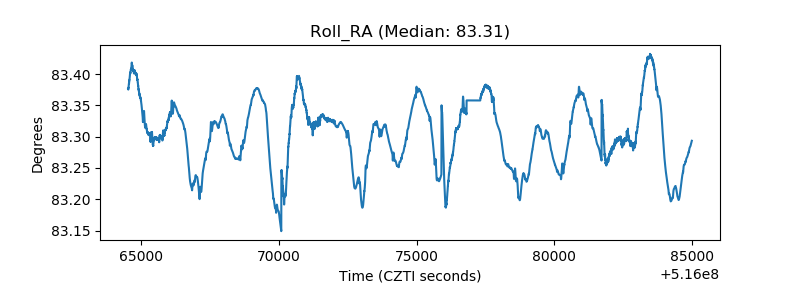 |
| Veto Counter | 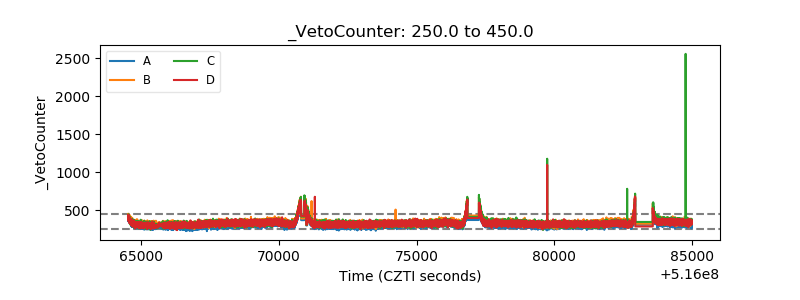 |