| Param | Original file | Final file |
|---|---|---|
| Filename | modeM0/AS1A14_102T01_9000006572_57434cztM0_level2.fits | modeM0/AS1A14_102T01_9000006572_57434cztM0_level2_quad_clean.evt |
| Size (bytes) | 414,478,080 | 96,678,720 |
| Size | 395.3 MB | 92.2 MB |
| Events in quadrant A | 3,259,628 | 632,683 |
| Events in quadrant B | 3,319,498 | 678,848 |
| Events in quadrant C | 4,356,608 | 595,540 |
| Events in quadrant D | 3,890,792 | 557,863 |
| Mode M0 | |||
|---|---|---|---|
| Quadrant | BADHDUFLAG | Total packets | Discarded packets |
| A | 0 | 14511 | 1 |
| B | 0 | 14495 | 1 |
| C | 0 | 17671 | 1 |
| D | 0 | 16283 | 1 |
| Mode M9 | |||
|---|---|---|---|
| Quadrant | BADHDUFLAG | Total packets | Discarded packets |
| A | 0 | 9 | 0 |
| B | 0 | 9 | 0 |
| C | 0 | 9 | 0 |
| D | 0 | 9 | 0 |
| Mode SS | |||
|---|---|---|---|
| Quadrant | BADHDUFLAG | Total packets | Discarded packets |
| A | 0 | 136 | 0 |
| B | 0 | 136 | 0 |
| C | 0 | 136 | 0 |
| D | 0 | 136 | 0 |
| Quadrant | Total seconds | Saturated seconds | Saturation percentage |
|---|---|---|---|
| A | 6628 | 131 | 1.976463% |
| B | 6629 | 130 | 1.961080% |
| C | 6629 | 282 | 4.254035% |
| D | 6629 | 317 | 4.782018% |
Noise dominated data is calculated using 1-second bins in cleaned event files. If a bin has >2000 counts, and if more than 50% of those come from <1% of pixels, then it is considered to be noise-dominated and hence unusable.
| Quadrant | # 1 sec bins | Bins with >0 counts | Bins with >2000 counts | High rate bins dominated by noise | Noise dominated (total time) | Noise dominated (detector-on time) | Marked lightcurve |
|---|---|---|---|---|---|---|---|
| A | 7558 | 6628 | 58 | 58 | 0.77% | 0.88% | 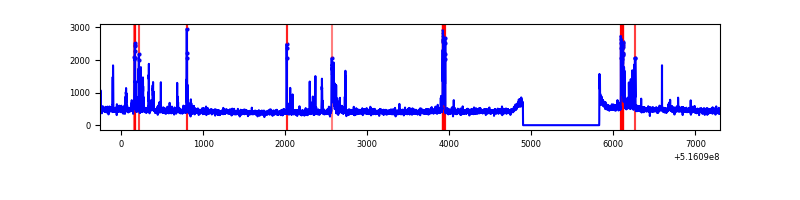 |
| B | 7559 | 6629 | 34 | 34 | 0.45% | 0.51% | 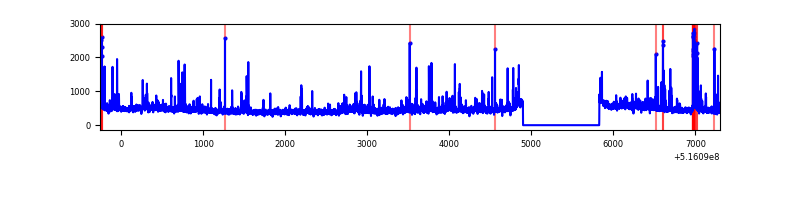 |
| C | 7559 | 6629 | 171 | 171 | 2.26% | 2.58% | 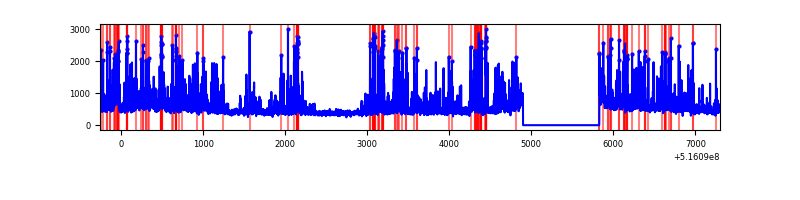 |
| D | 7559 | 6629 | 250 | 250 | 3.31% | 3.77% | 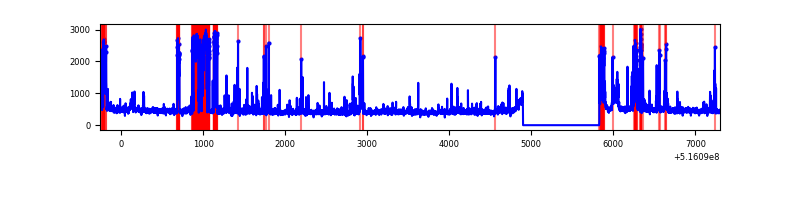 |
Top three noisy pixels from each quadrant. If the there are fewer than three noisy pixels in the level2.evt file, extra rows are filled as -1
| Pixel properties | Quadrant properties | ||||||
|---|---|---|---|---|---|---|---|
| Quadrant | DetID | PixID | Counts | Sigma | Mean | Median | Sigma |
| A | 10 | 251 | 262091 | 1485.61 | 722 | 705 | 175.9 |
| A | 7 | 64 | 99345 | 560.63 | 722 | 705 | 175.9 |
| A | 3 | 14 | 53921 | 302.46 | 722 | 705 | 175.9 |
| B | 10 | 247 | 184345 | 1214.55 | 710 | 684 | 151.2 |
| B | 0 | 63 | 74368 | 487.27 | 710 | 684 | 151.2 |
| B | 8 | 128 | 64481 | 421.89 | 710 | 684 | 151.2 |
| C | 15 | 224 | 977135 | 5124.56 | 699 | 695 | 190.5 |
| C | 13 | 3 | 228720 | 1196.72 | 699 | 695 | 190.5 |
| C | 14 | 254 | 117808 | 614.63 | 699 | 695 | 190.5 |
| D | 8 | 240 | 534332 | 2713.45 | 697 | 663 | 196.7 |
| D | 15 | 142 | 349275 | 1772.53 | 697 | 663 | 196.7 |
| D | 7 | 96 | 74495 | 375.4 | 697 | 663 | 196.7 |
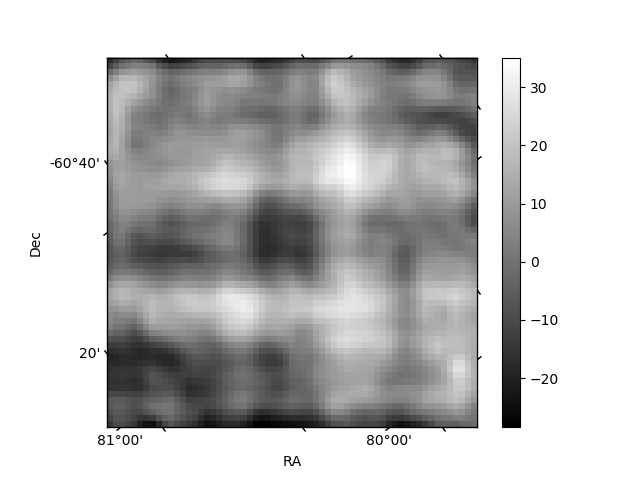
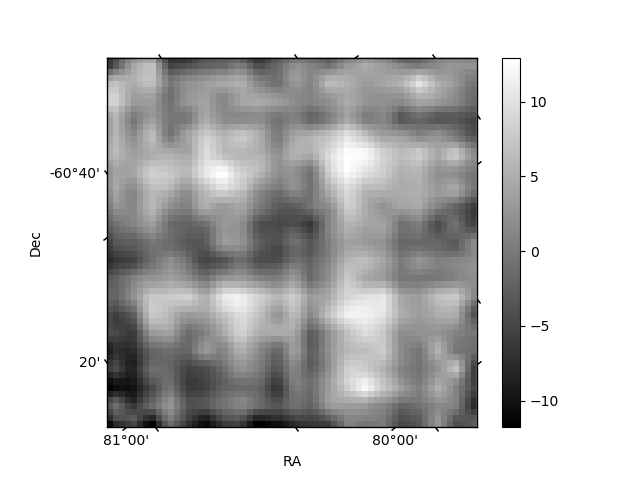
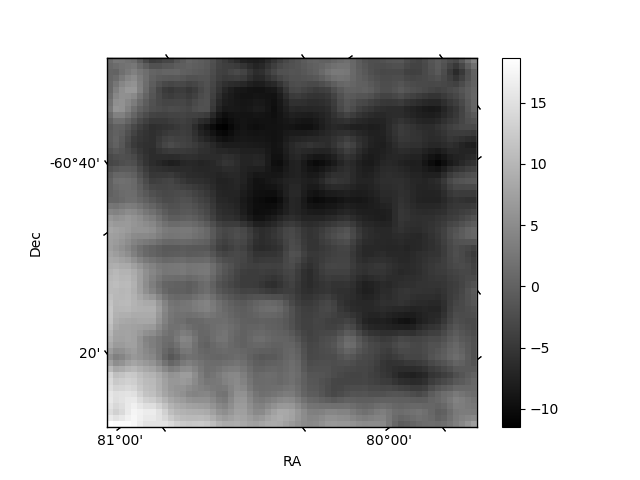
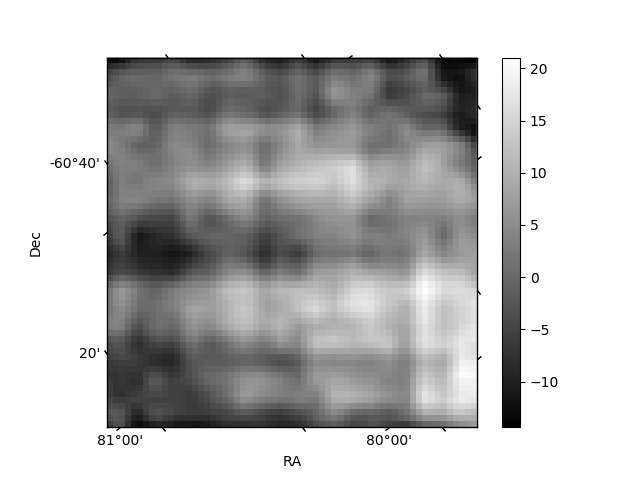
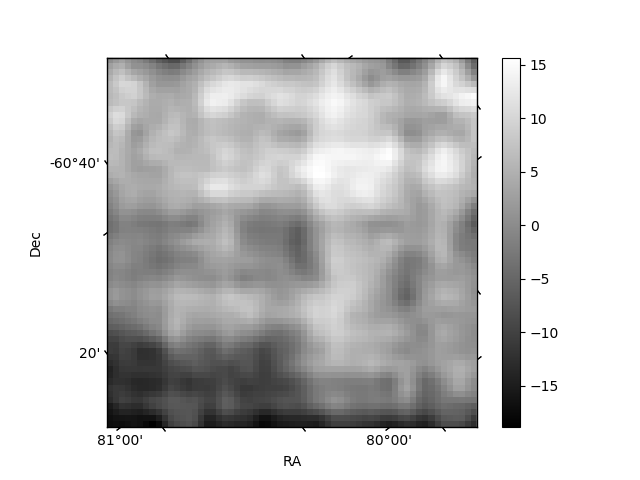
Histogram calculated using DETX and DETY for each event in the final _common_clean file
| Quadrant A | 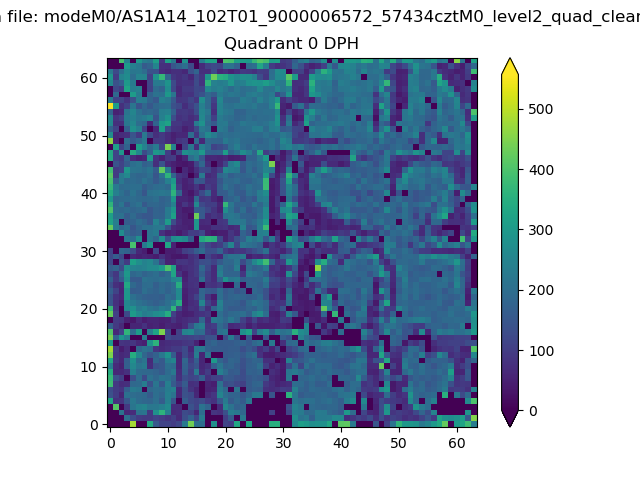 |
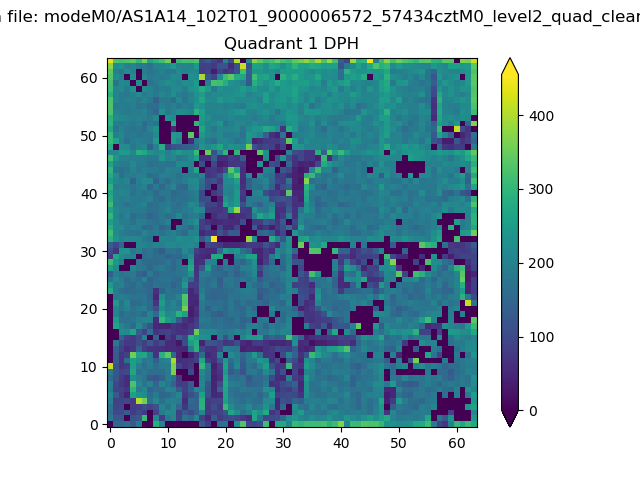 |
Quadrant B |
|---|---|---|---|
| Quadrant D | 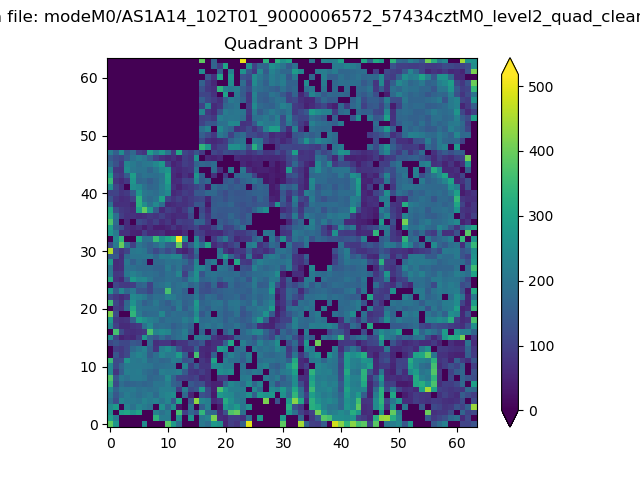 |
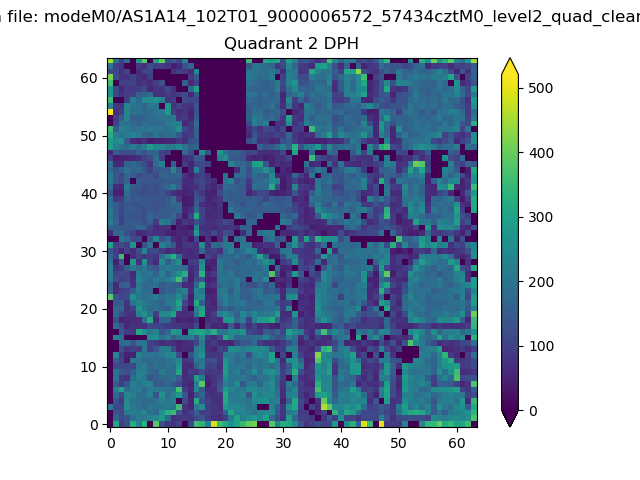 |
Quadrant C |
| Plot type | Count rate plots | Images |
|---|---|---|
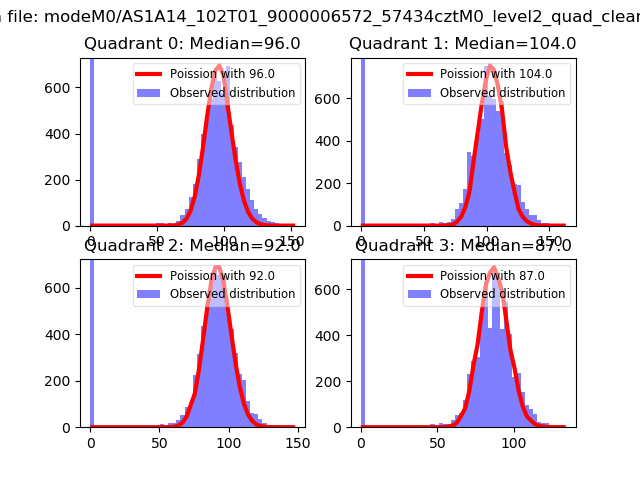
| Comparison with Poisson distribution Blue bars denote a histogram of data divided into 1 sec bins. Red curve is a Poisson curve with rate = median count rate of data. |
 |
 |
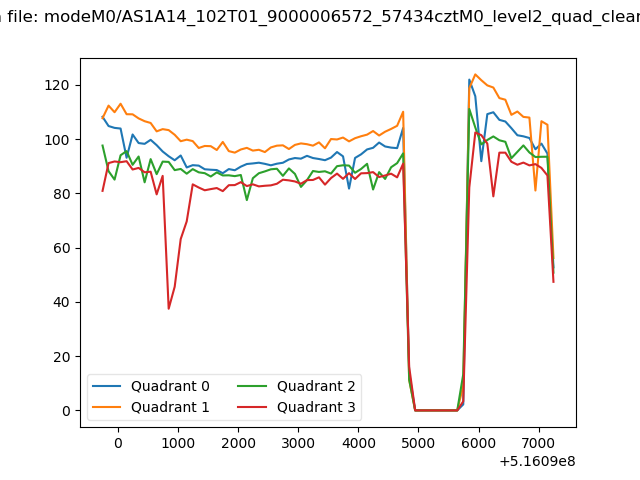
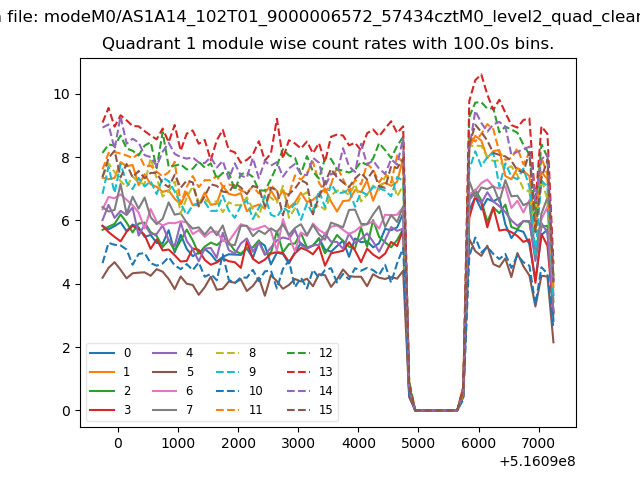
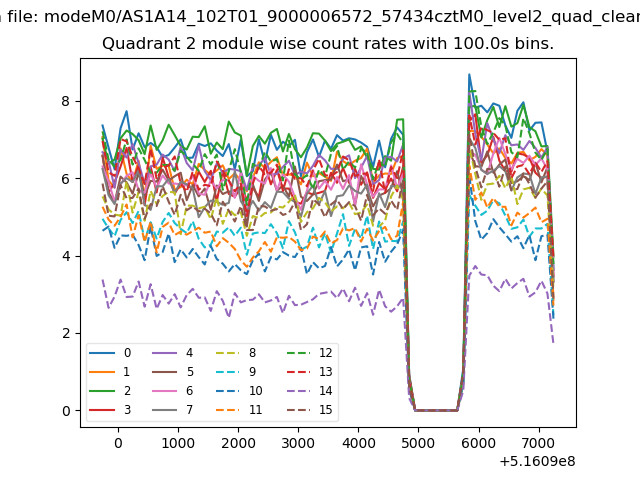
| Quadrant-wise count rates Data is divided into 100 sec bins |
 |
|
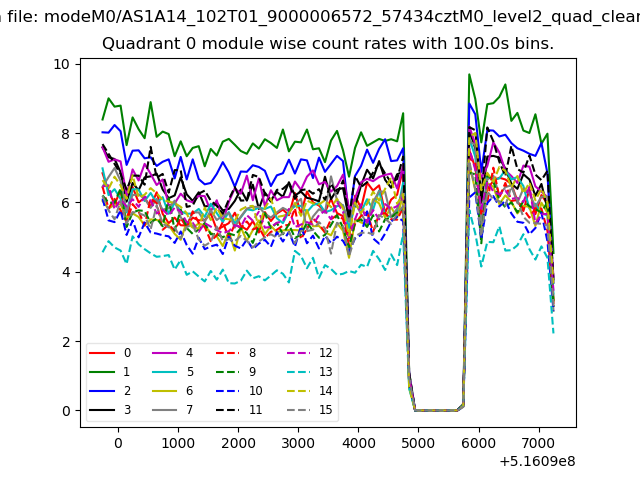
| Module-wise count rates for Quadrant A Data is divided into 100 sec bins |
 |
 |
| Module-wise count rates for Quadrant B Data is divided into 100 sec bins |
 |
 |
| Module-wise count rates for Quadrant C Data is divided into 100 sec bins |
 |
 |
| Module-wise count rates for Quadrant D Data is divided into 100 sec bins |
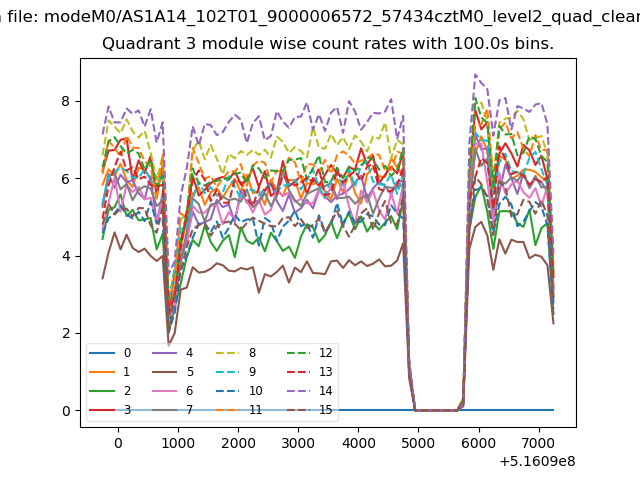 |
 |
| Parameter | Plot |
|---|---|
| CZT HV Monitor | 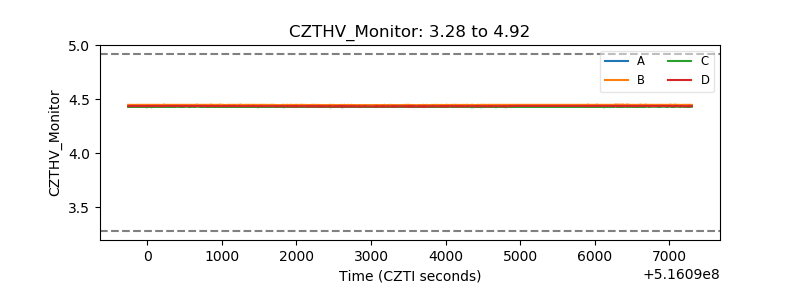 |
| D_VDD | 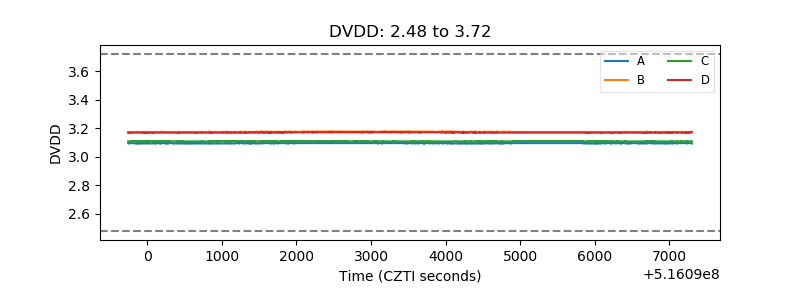 |
| Temperature 1 | 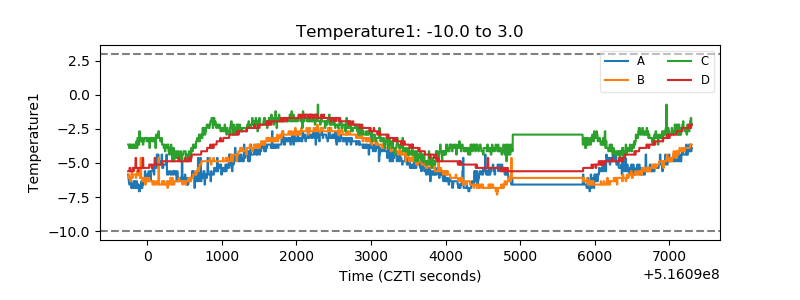 |
| Veto HV Monitor | 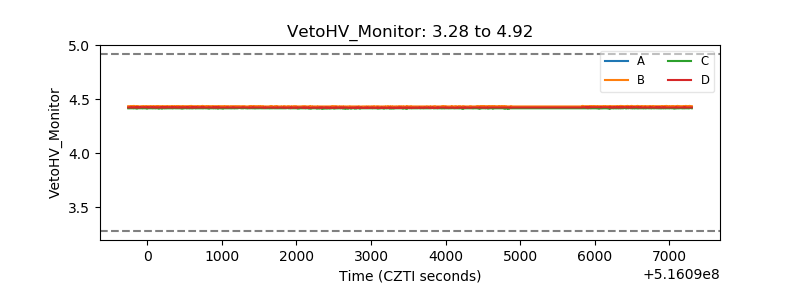 |
| Veto LLD | 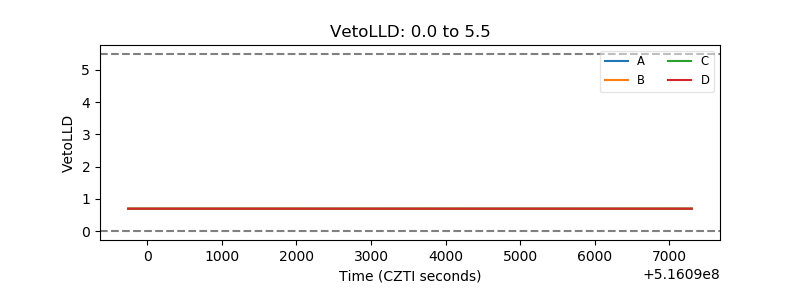 |
| Alpha Counter | 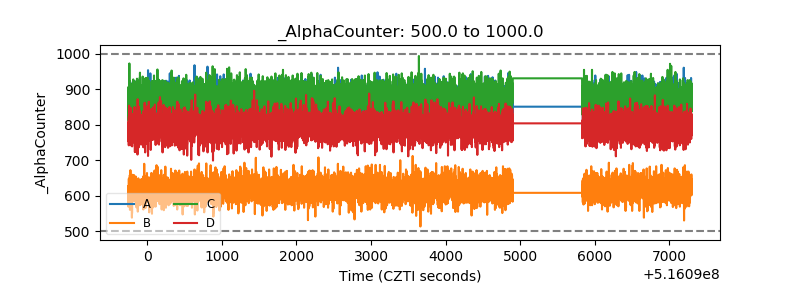 |
| _CPM_Rate | 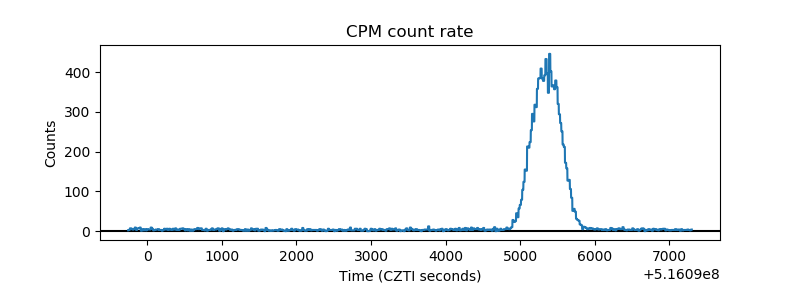 |
| CZT Counter | 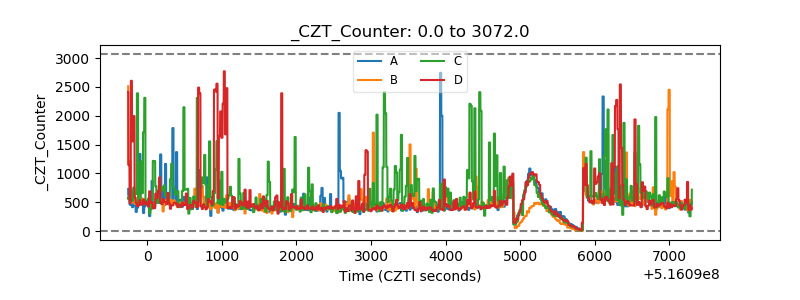 |
| +2.5 Volts monitor |  |
| +5 Volts monitor |  |
| _ROLL_ROT | 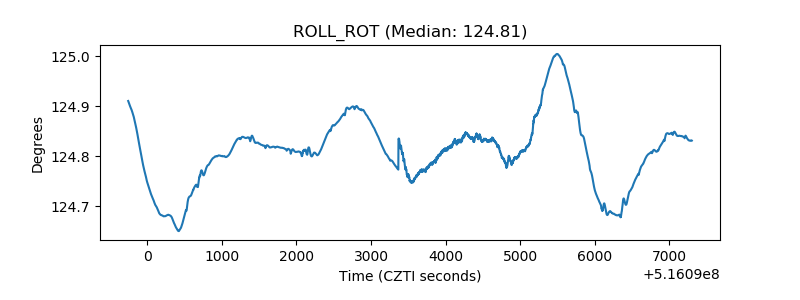 |
| _Roll_DEC | 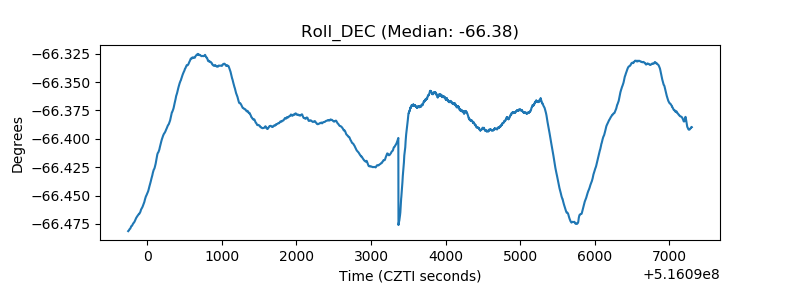 |
| _Roll_RA | 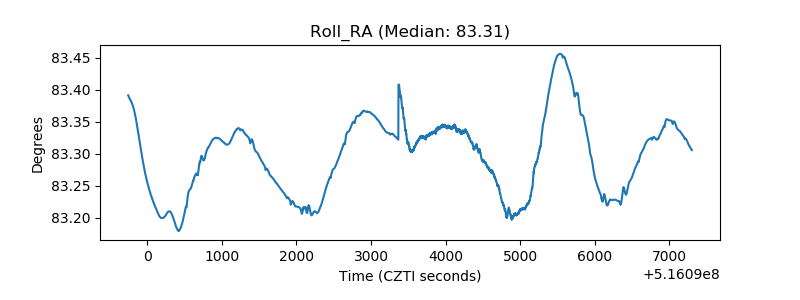 |
| Veto Counter | 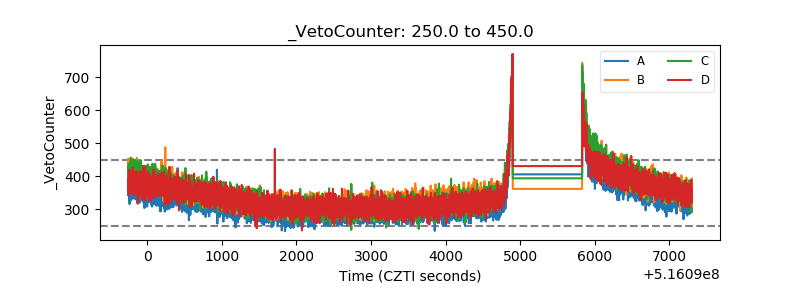 |