| Param | Original file | Final file |
|---|---|---|
| Filename | modeM0/AS1A14_102T01_9000006572_57435cztM0_level2.fits | modeM0/AS1A14_102T01_9000006572_57435cztM0_level2_quad_clean.evt |
| Size (bytes) | 471,551,040 | 99,691,200 |
| Size | 449.7 MB | 95.1 MB |
| Events in quadrant A | 3,243,494 | 667,666 |
| Events in quadrant B | 3,232,797 | 713,806 |
| Events in quadrant C | 5,503,173 | 613,028 |
| Events in quadrant D | 4,949,810 | 552,685 |
| Mode M0 | |||
|---|---|---|---|
| Quadrant | BADHDUFLAG | Total packets | Discarded packets |
| A | 0 | 14409 | 1 |
| B | 0 | 14487 | 1 |
| C | 0 | 20991 | 1 |
| D | 0 | 19518 | 1 |
| Mode M9 | |||
|---|---|---|---|
| Quadrant | BADHDUFLAG | Total packets | Discarded packets |
| A | 0 | 11 | 0 |
| B | 0 | 11 | 0 |
| C | 0 | 11 | 0 |
| D | 0 | 11 | 0 |
| Mode SS | |||
|---|---|---|---|
| Quadrant | BADHDUFLAG | Total packets | Discarded packets |
| A | 0 | 136 | 0 |
| B | 0 | 136 | 0 |
| C | 0 | 136 | 0 |
| D | 0 | 136 | 0 |
| Quadrant | Total seconds | Saturated seconds | Saturation percentage |
|---|---|---|---|
| A | 6767 | 85 | 1.256096% |
| B | 6768 | 99 | 1.462766% |
| C | 6768 | 463 | 6.841017% |
| D | 6768 | 647 | 9.559693% |
Noise dominated data is calculated using 1-second bins in cleaned event files. If a bin has >2000 counts, and if more than 50% of those come from <1% of pixels, then it is considered to be noise-dominated and hence unusable.
| Quadrant | # 1 sec bins | Bins with >0 counts | Bins with >2000 counts | High rate bins dominated by noise | Noise dominated (total time) | Noise dominated (detector-on time) | Marked lightcurve |
|---|---|---|---|---|---|---|---|
| A | 7822 | 6767 | 26 | 26 | 0.33% | 0.38% | 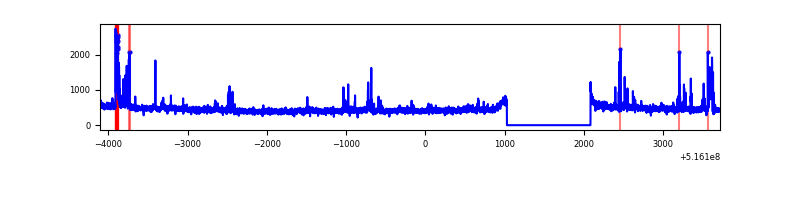 |
| B | 7823 | 6768 | 38 | 38 | 0.49% | 0.56% | 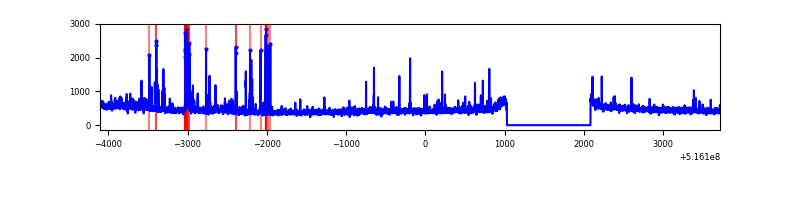 |
| C | 7823 | 6768 | 410 | 410 | 5.24% | 6.06% | 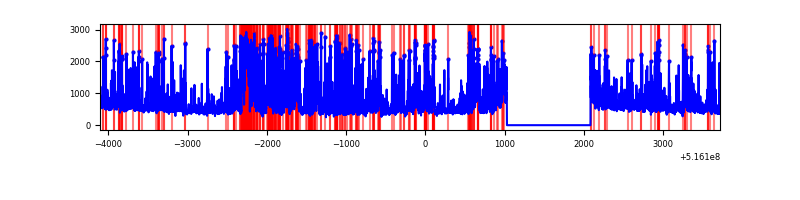 |
| D | 7823 | 6768 | 581 | 581 | 7.43% | 8.58% | 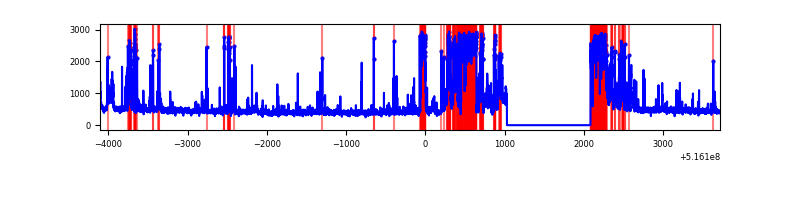 |
Top three noisy pixels from each quadrant. If the there are fewer than three noisy pixels in the level2.evt file, extra rows are filled as -1
| Pixel properties | Quadrant properties | ||||||
|---|---|---|---|---|---|---|---|
| Quadrant | DetID | PixID | Counts | Sigma | Mean | Median | Sigma |
| A | 3 | 14 | 133459 | 727.68 | 750 | 734 | 182.4 |
| A | 7 | 64 | 110942 | 604.23 | 750 | 734 | 182.4 |
| A | 10 | 251 | 57560 | 311.56 | 750 | 734 | 182.4 |
| B | 10 | 247 | 186049 | 1181.76 | 734 | 705 | 156.8 |
| B | 0 | 213 | 23521 | 145.48 | 734 | 705 | 156.8 |
| B | 0 | 63 | 22328 | 137.87 | 734 | 705 | 156.8 |
| C | 15 | 224 | 1591560 | 8233.46 | 710 | 705 | 193.2 |
| C | 6 | 223 | 348674 | 1800.91 | 710 | 705 | 193.2 |
| C | 14 | 245 | 297029 | 1533.62 | 710 | 705 | 193.2 |
| D | 15 | 142 | 1845515 | 9427.64 | 693 | 659 | 195.7 |
| D | 7 | 96 | 115358 | 586.14 | 693 | 659 | 195.7 |
| D | 8 | 240 | 64954 | 328.56 | 693 | 659 | 195.7 |
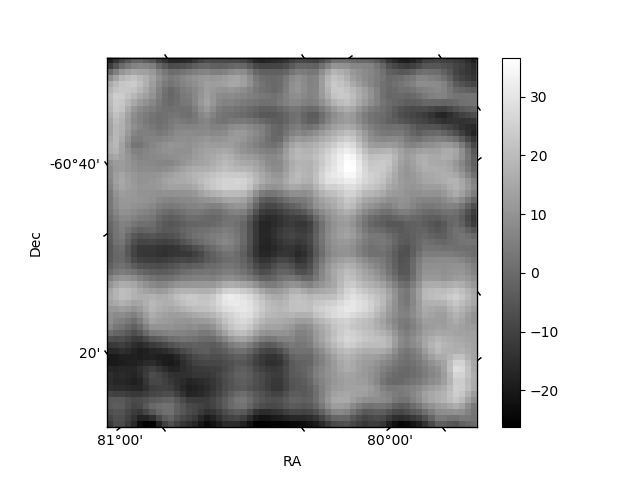
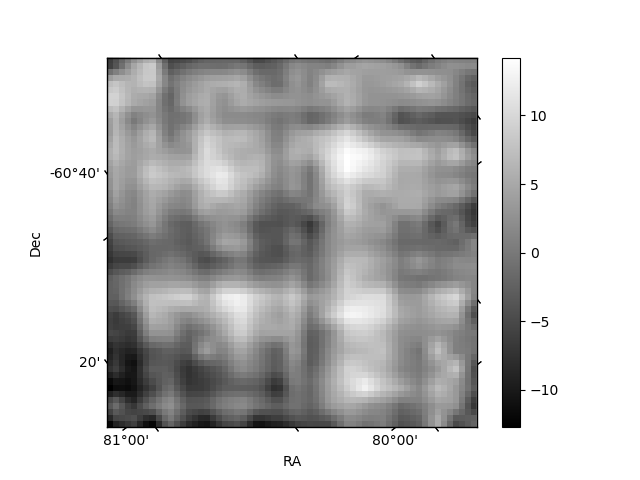
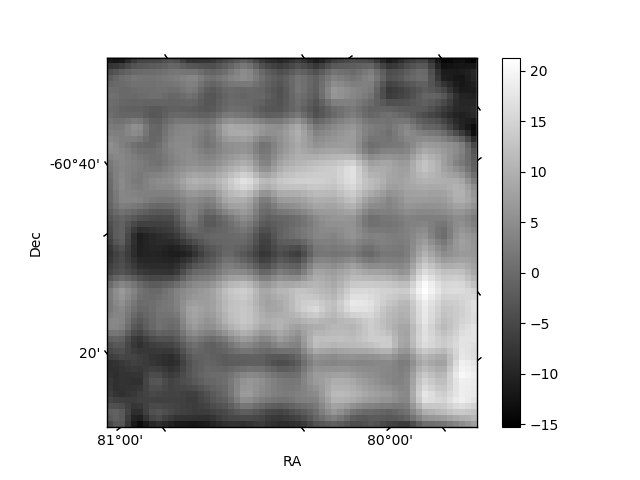
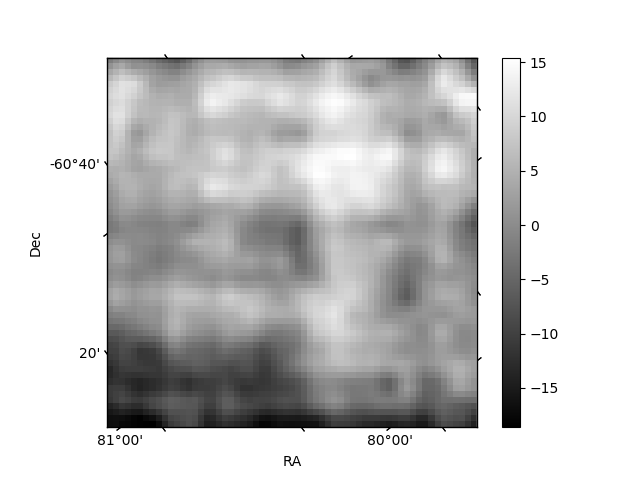
Histogram calculated using DETX and DETY for each event in the final _common_clean file
| Quadrant A | 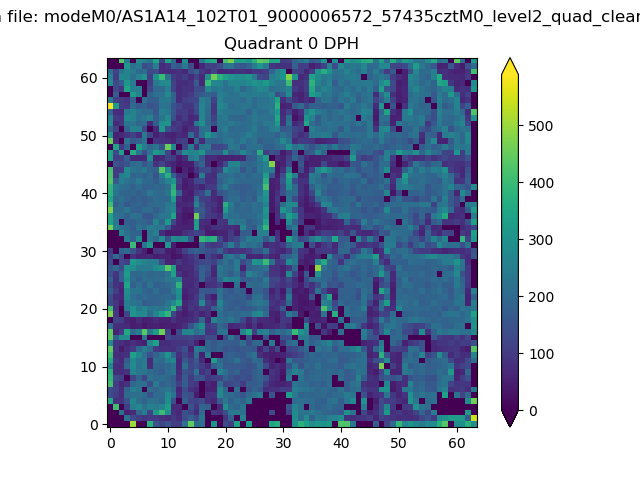 |
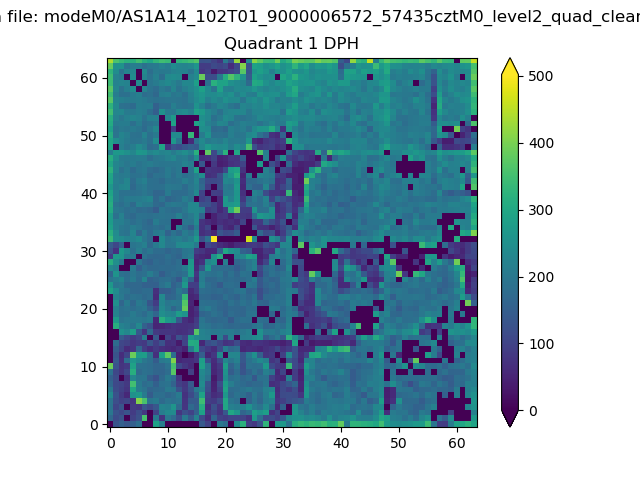 |
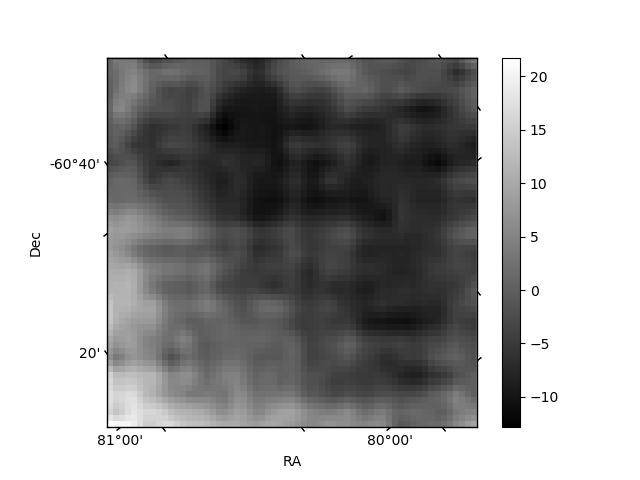
Quadrant B |
|---|---|---|---|
| Quadrant D | 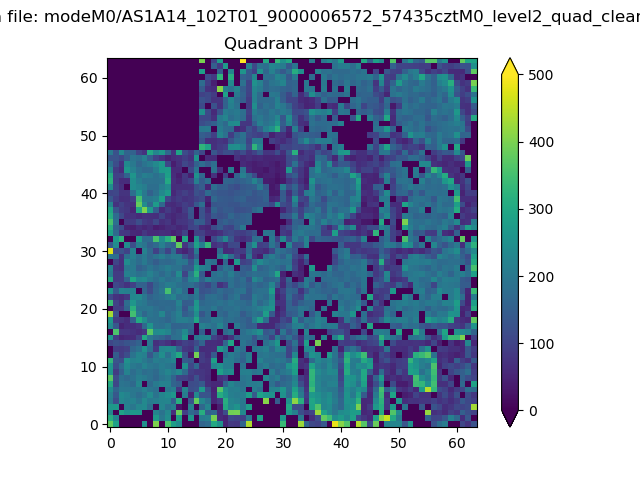 |
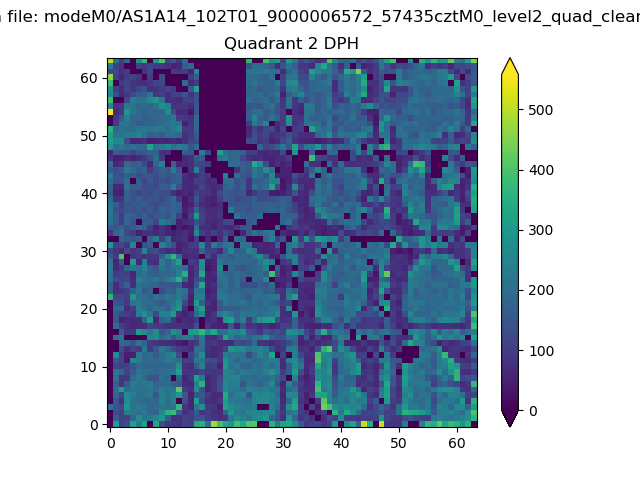 |
Quadrant C |
| Plot type | Count rate plots | Images |
|---|---|---|
| Comparison with Poisson distribution Blue bars denote a histogram of data divided into 1 sec bins. Red curve is a Poisson curve with rate = median count rate of data. |
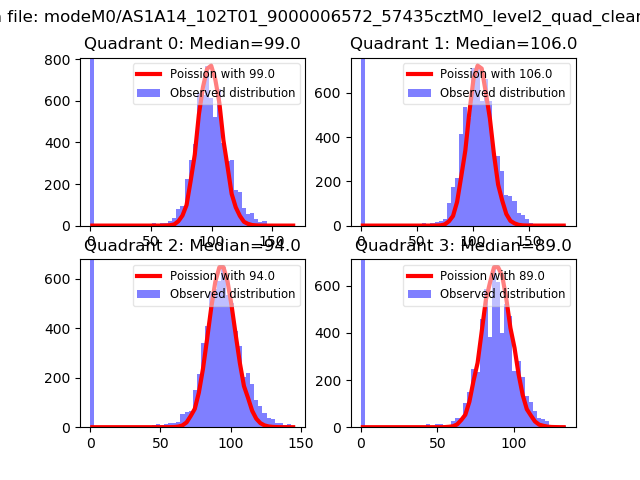 |
 |
| Quadrant-wise count rates Data is divided into 100 sec bins |
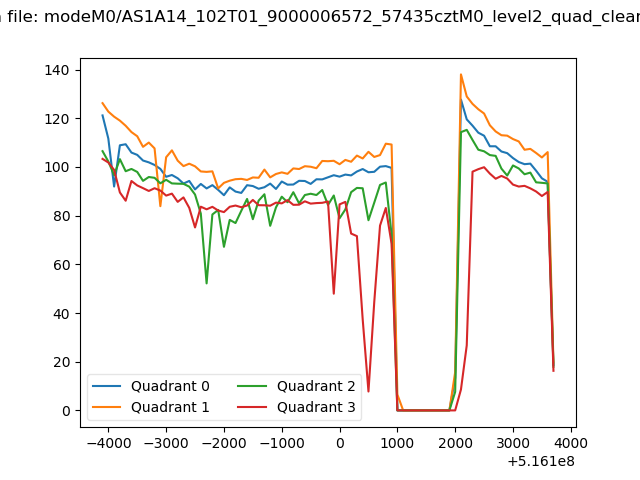 |
|
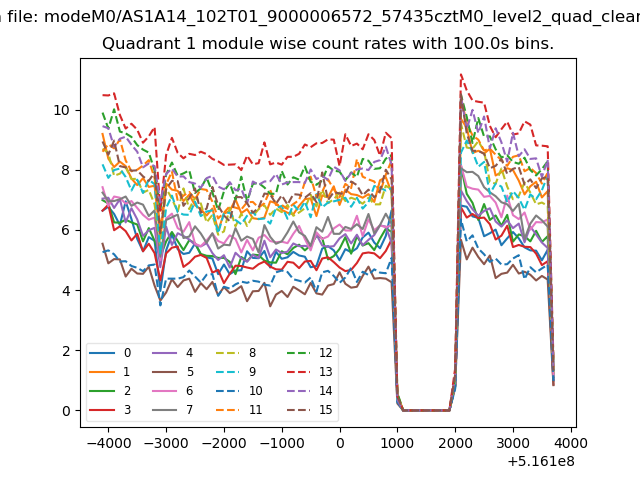
| Module-wise count rates for Quadrant A Data is divided into 100 sec bins |
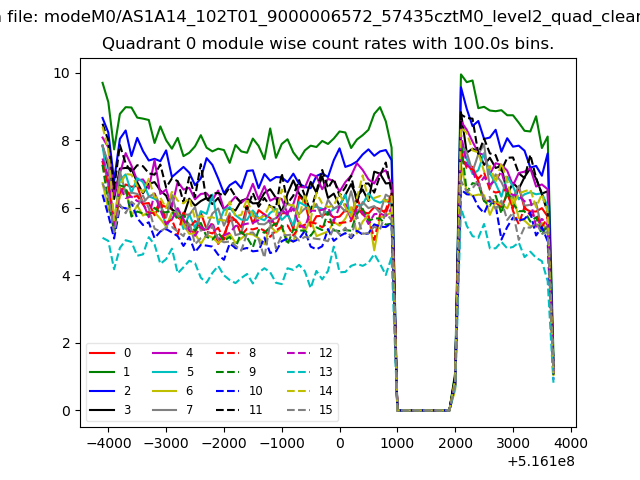 |
 |
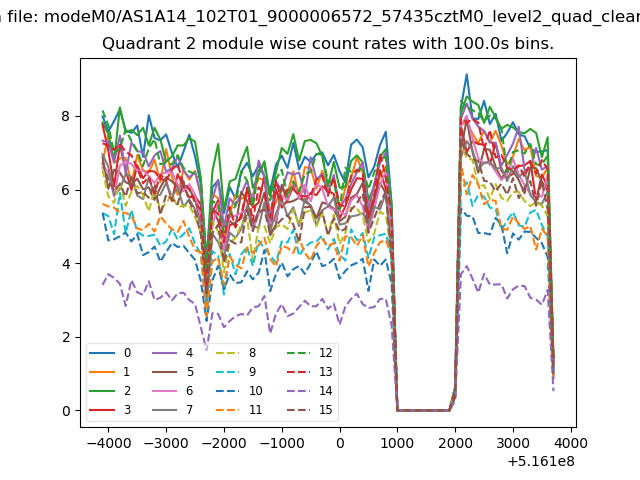
| Module-wise count rates for Quadrant B Data is divided into 100 sec bins |
 |
 |
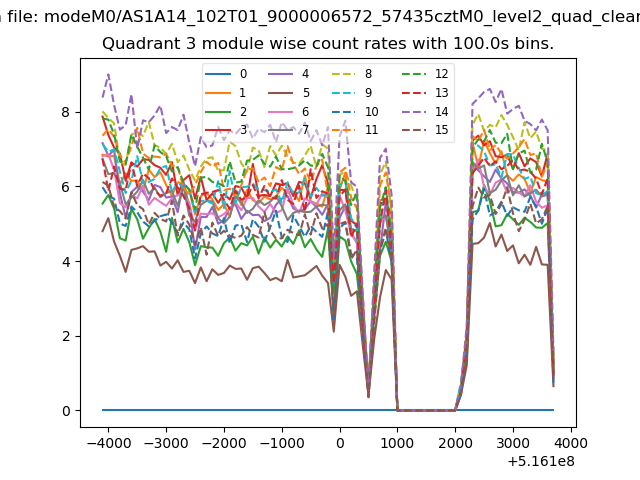
| Module-wise count rates for Quadrant C Data is divided into 100 sec bins |
 |
 |
| Module-wise count rates for Quadrant D Data is divided into 100 sec bins |
 |
 |
| Parameter | Plot |
|---|---|
| CZT HV Monitor | 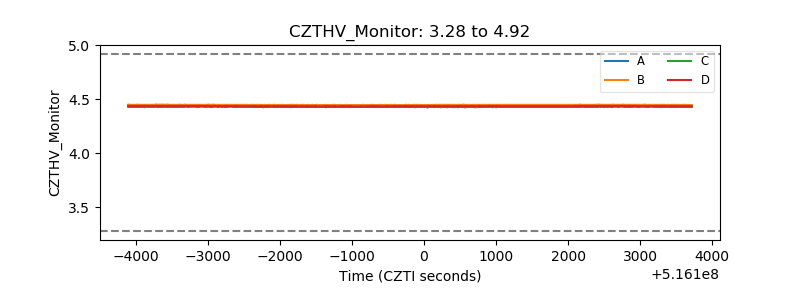 |
| D_VDD | 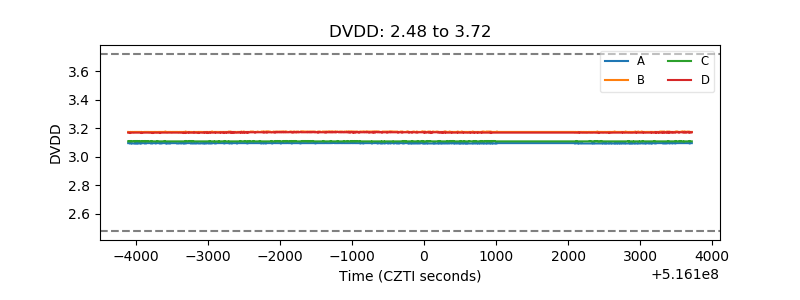 |
| Temperature 1 | 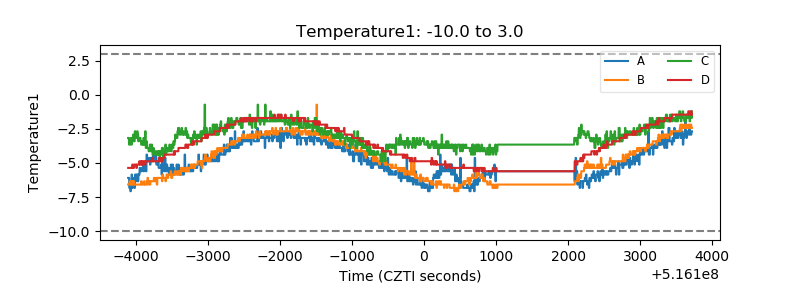 |
| Veto HV Monitor | 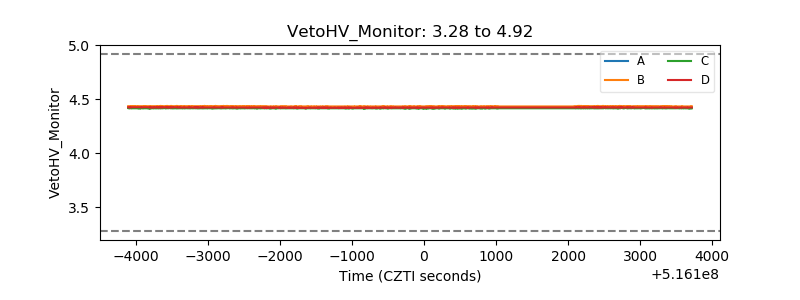 |
| Veto LLD | 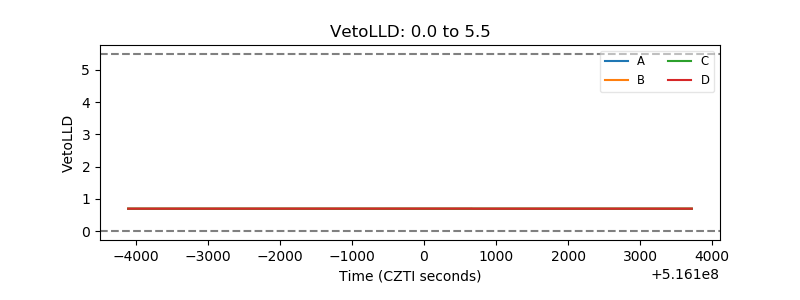 |
| Alpha Counter | 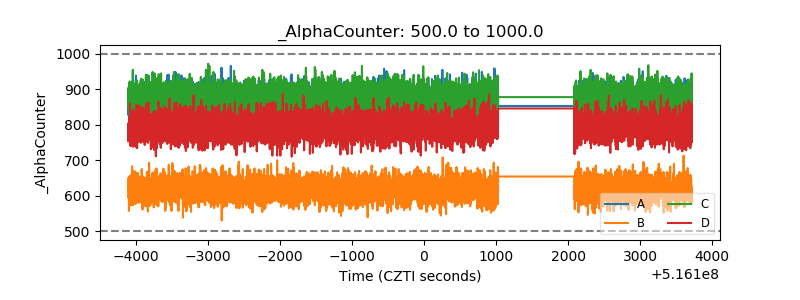 |
| _CPM_Rate | 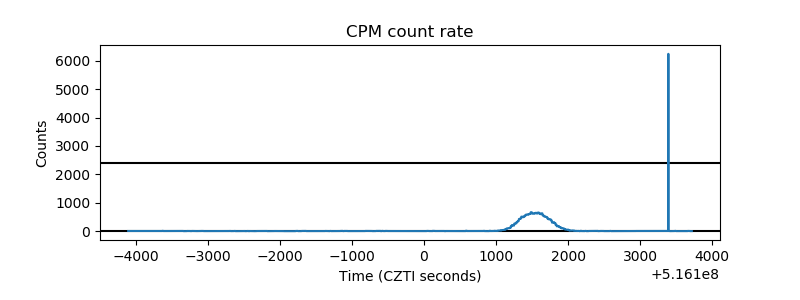 |
| CZT Counter | 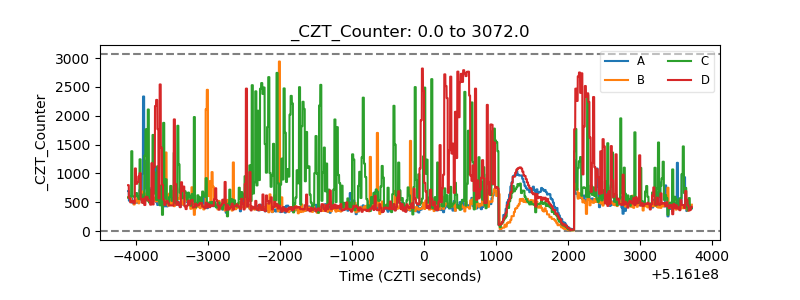 |
| +2.5 Volts monitor |  |
| +5 Volts monitor |  |
| _ROLL_ROT | 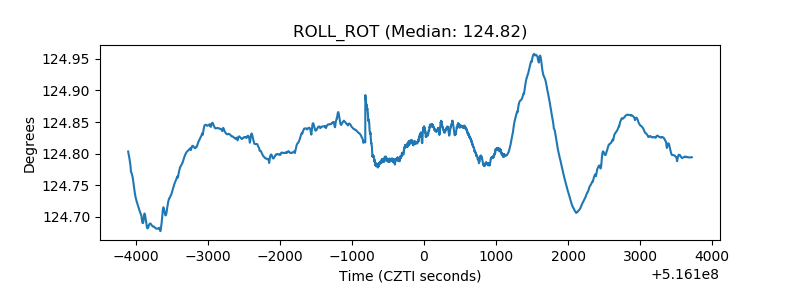 |
| _Roll_DEC | 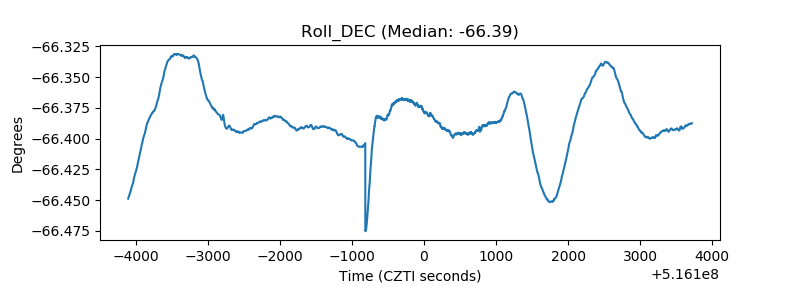 |
| _Roll_RA | 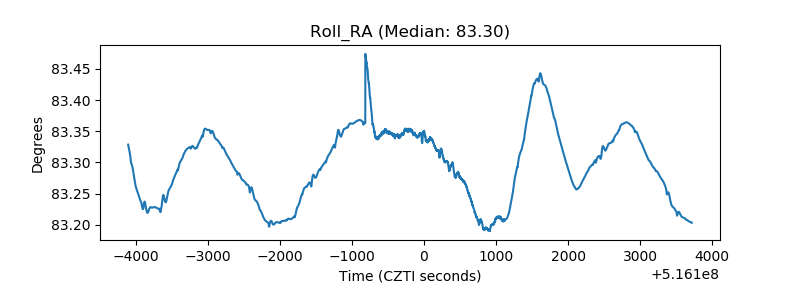 |
| Veto Counter | 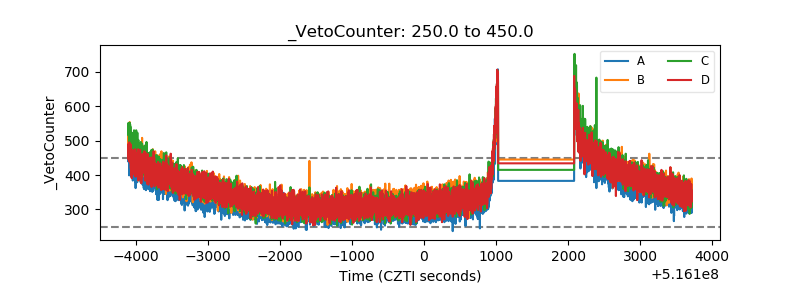 |