| Param | Original file | Final file |
|---|---|---|
| Filename | modeM0/AS1A14_102T01_9000006572_57436cztM0_level2.fits | modeM0/AS1A14_102T01_9000006572_57436cztM0_level2_quad_clean.evt |
| Size (bytes) | 480,882,240 | 87,808,320 |
| Size | 458.6 MB | 83.7 MB |
| Events in quadrant A | 4,282,225 | 592,088 |
| Events in quadrant B | 2,738,304 | 639,589 |
| Events in quadrant C | 7,019,429 | 468,034 |
| Events in quadrant D | 3,292,742 | 538,481 |
| Mode M0 | |||
|---|---|---|---|
| Quadrant | BADHDUFLAG | Total packets | Discarded packets |
| A | 0 | 17035 | 1 |
| B | 0 | 12566 | 1 |
| C | 0 | 25061 | 1 |
| D | 0 | 14237 | 1 |
| Mode M9 | |||
|---|---|---|---|
| Quadrant | BADHDUFLAG | Total packets | Discarded packets |
| A | 0 | 11 | 0 |
| B | 0 | 11 | 0 |
| C | 0 | 11 | 0 |
| D | 0 | 11 | 0 |
| Mode SS | |||
|---|---|---|---|
| Quadrant | BADHDUFLAG | Total packets | Discarded packets |
| A | 0 | 122 | 0 |
| B | 0 | 122 | 0 |
| C | 0 | 122 | 0 |
| D | 0 | 122 | 0 |
| Quadrant | Total seconds | Saturated seconds | Saturation percentage |
|---|---|---|---|
| A | 6021 | 292 | 4.849693% |
| B | 6022 | 81 | 1.345068% |
| C | 6022 | 1357 | 22.534042% |
| D | 6022 | 135 | 2.241780% |
Noise dominated data is calculated using 1-second bins in cleaned event files. If a bin has >2000 counts, and if more than 50% of those come from <1% of pixels, then it is considered to be noise-dominated and hence unusable.
| Quadrant | # 1 sec bins | Bins with >0 counts | Bins with >2000 counts | High rate bins dominated by noise | Noise dominated (total time) | Noise dominated (detector-on time) | Marked lightcurve |
|---|---|---|---|---|---|---|---|
| A | 7130 | 6020 | 54 | 54 | 0.76% | 0.90% | 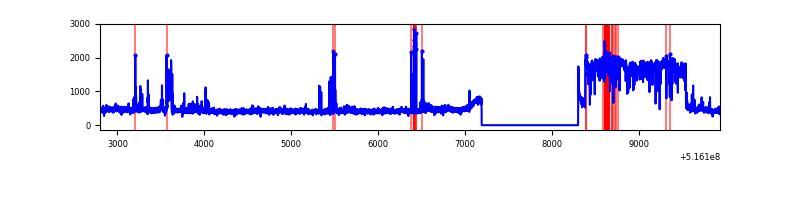 |
| B | 7131 | 6021 | 5 | 5 | 0.07% | 0.08% | 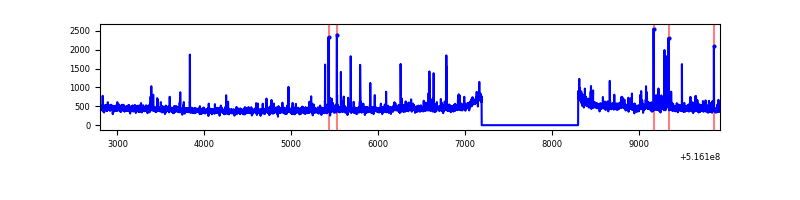 |
| C | 7131 | 6021 | 1238 | 1238 | 17.36% | 20.56% | 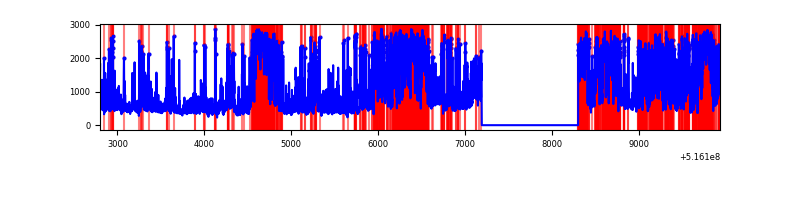 |
| D | 7131 | 6021 | 73 | 73 | 1.02% | 1.21% | 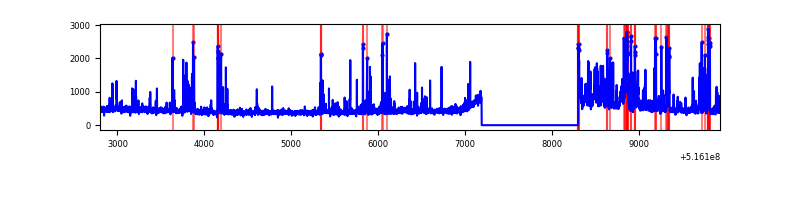 |
Top three noisy pixels from each quadrant. If the there are fewer than three noisy pixels in the level2.evt file, extra rows are filled as -1
| Pixel properties | Quadrant properties | ||||||
|---|---|---|---|---|---|---|---|
| Quadrant | DetID | PixID | Counts | Sigma | Mean | Median | Sigma |
| A | 0 | 12 | 1472218 | 9109.26 | 661 | 645 | 161.5 |
| A | 3 | 14 | 101215 | 622.54 | 661 | 645 | 161.5 |
| A | 7 | 64 | 82822 | 508.69 | 661 | 645 | 161.5 |
| B | 10 | 247 | 38748 | 274.93 | 648 | 623 | 138.7 |
| B | 7 | 252 | 33875 | 239.79 | 648 | 623 | 138.7 |
| B | 5 | 185 | 24074 | 169.11 | 648 | 623 | 138.7 |
| C | 14 | 245 | 2157555 | 13598.31 | 577 | 572 | 158.6 |
| C | 15 | 224 | 1980474 | 12481.94 | 577 | 572 | 158.6 |
| C | 13 | 3 | 349899 | 2202.27 | 577 | 572 | 158.6 |
| D | 15 | 142 | 262084 | 1449.48 | 639 | 610 | 180.4 |
| D | 2 | 249 | 195879 | 1082.47 | 639 | 610 | 180.4 |
| D | 7 | 96 | 71104 | 390.78 | 639 | 610 | 180.4 |
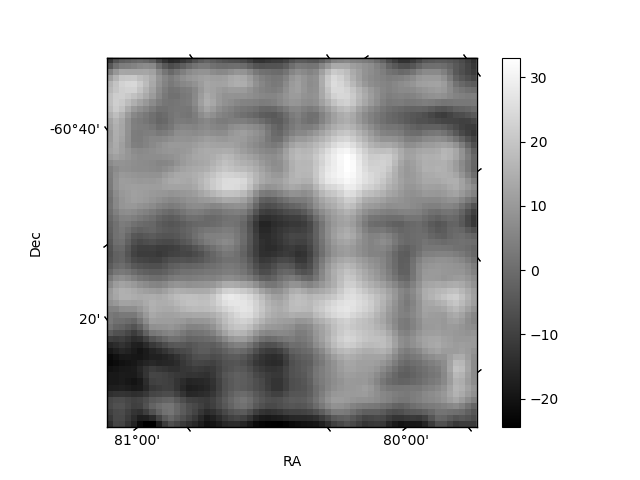
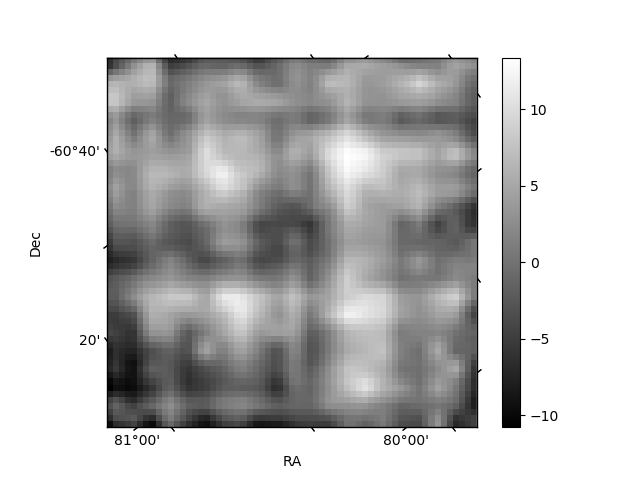
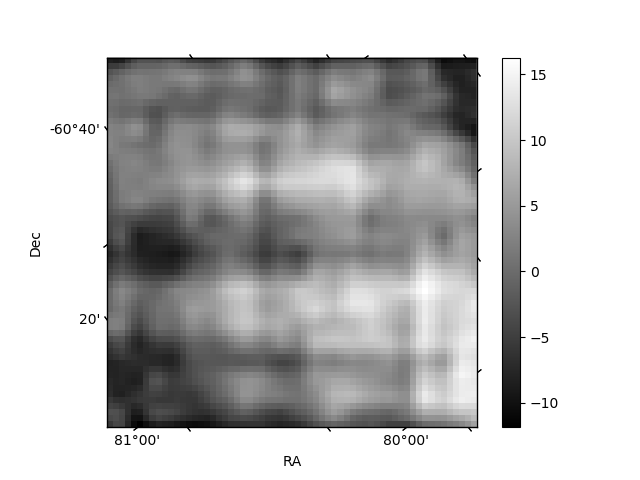
Histogram calculated using DETX and DETY for each event in the final _common_clean file
| Quadrant A | 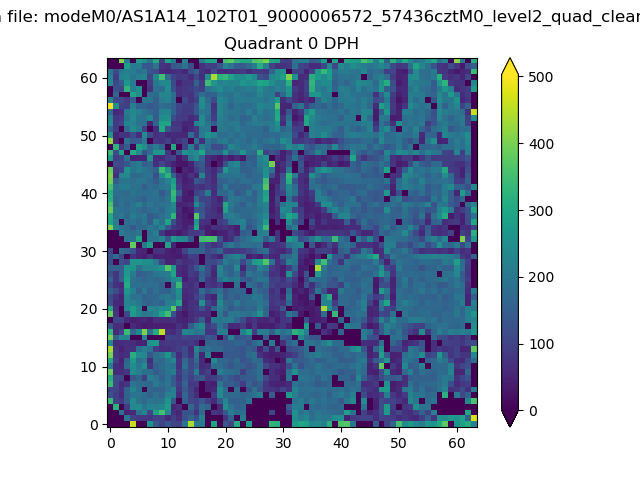 |
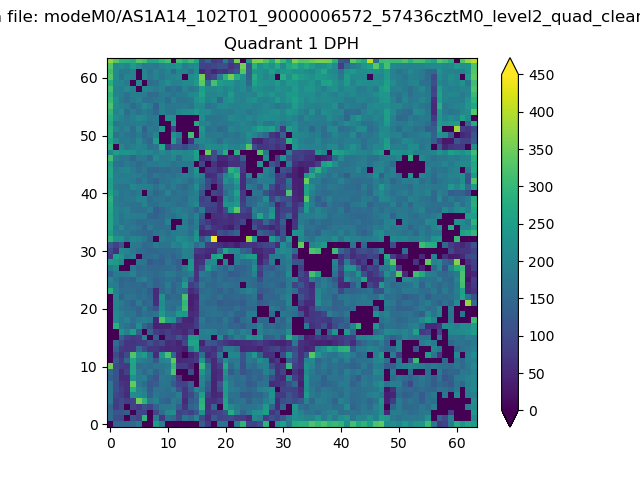 |
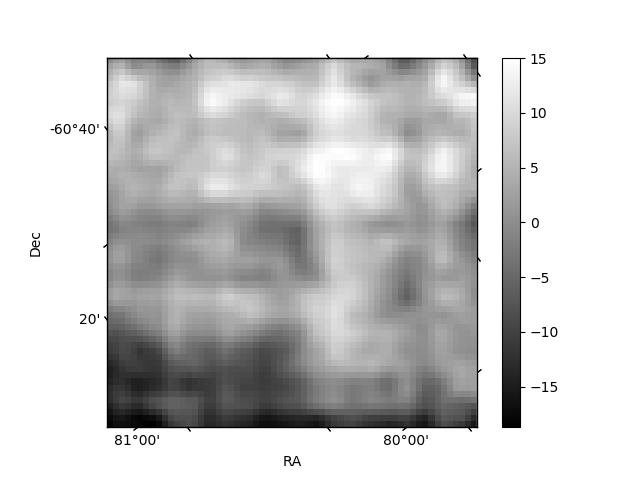
Quadrant B |
|---|---|---|---|
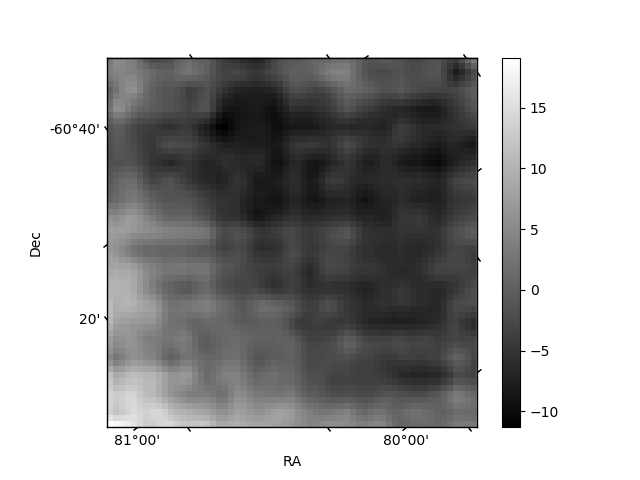
| Quadrant D | 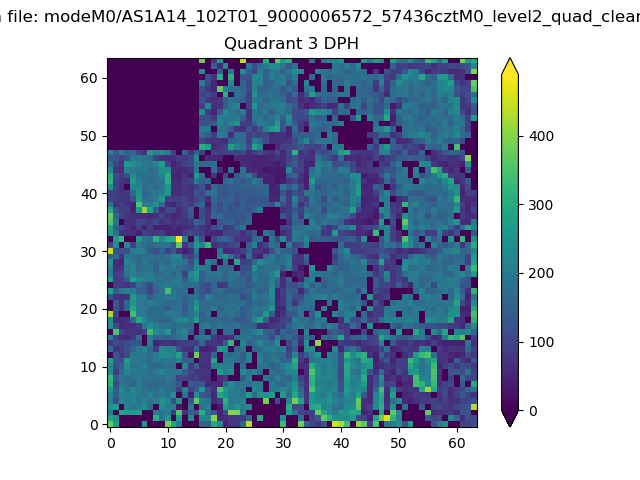 |
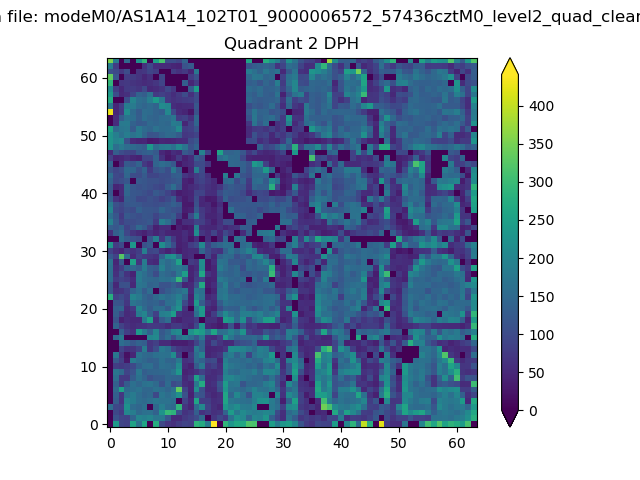 |
Quadrant C |
| Plot type | Count rate plots | Images |
|---|---|---|
| Comparison with Poisson distribution Blue bars denote a histogram of data divided into 1 sec bins. Red curve is a Poisson curve with rate = median count rate of data. |
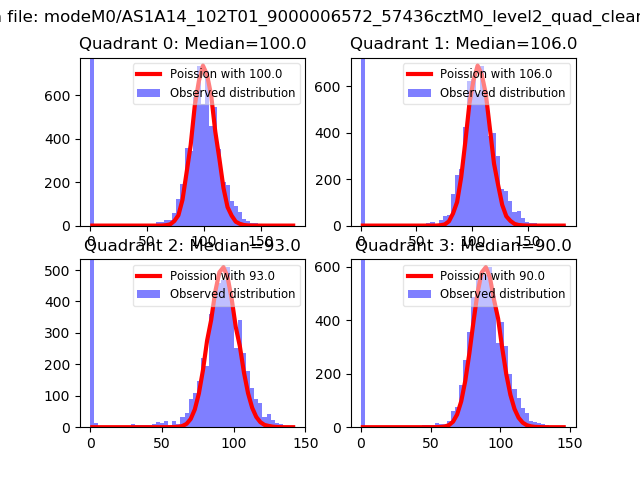 |
 |
| Quadrant-wise count rates Data is divided into 100 sec bins |
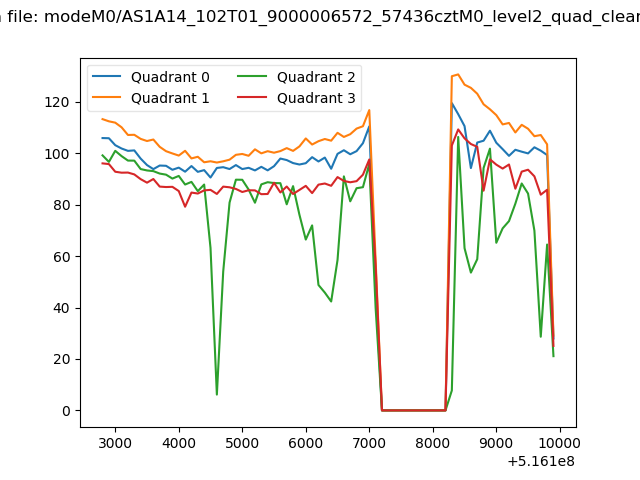 |
|
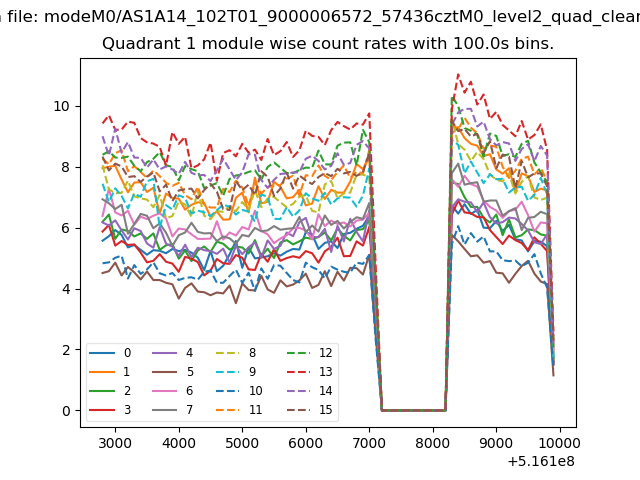
| Module-wise count rates for Quadrant A Data is divided into 100 sec bins |
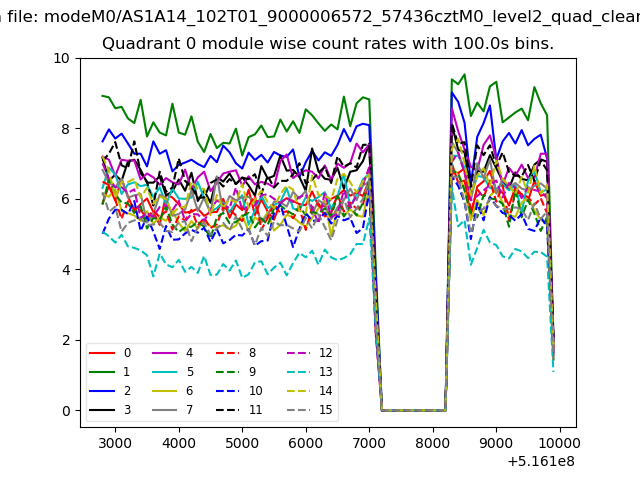 |
 |
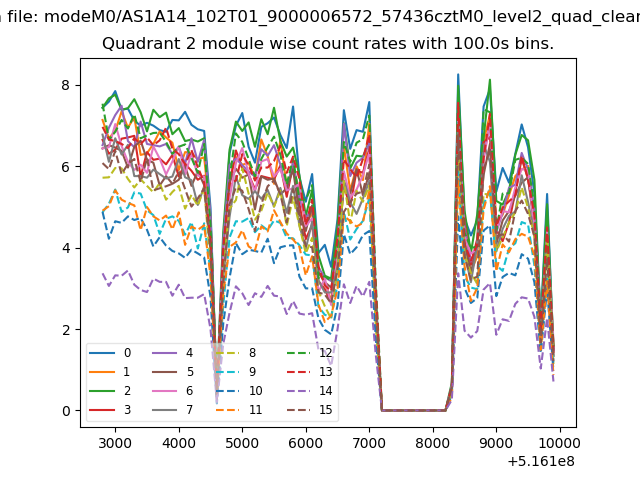
| Module-wise count rates for Quadrant B Data is divided into 100 sec bins |
 |
 |
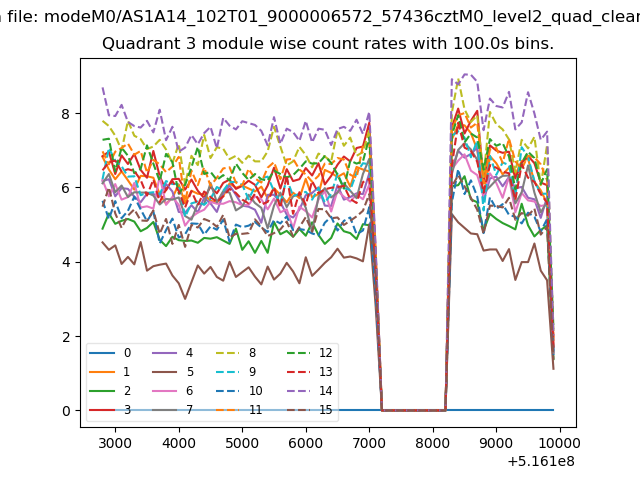
| Module-wise count rates for Quadrant C Data is divided into 100 sec bins |
 |
 |
| Module-wise count rates for Quadrant D Data is divided into 100 sec bins |
 |
 |
| Parameter | Plot |
|---|---|
| CZT HV Monitor | 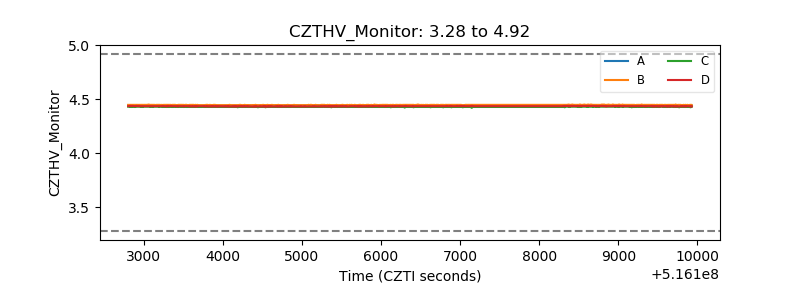 |
| D_VDD | 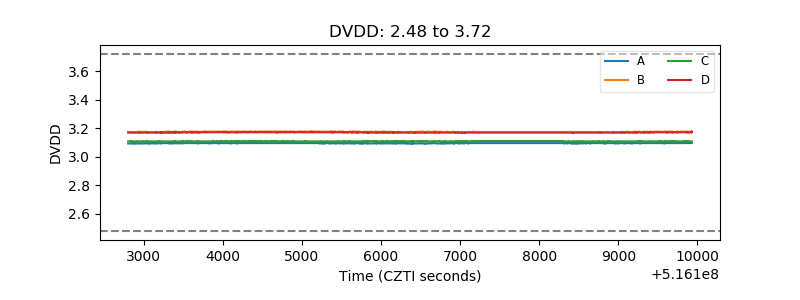 |
| Temperature 1 | 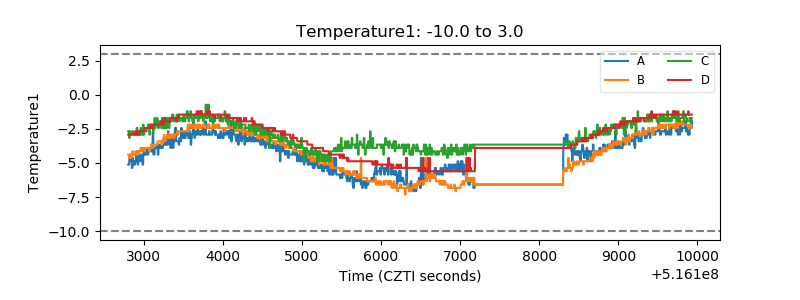 |
| Veto HV Monitor |  |
| Veto LLD | 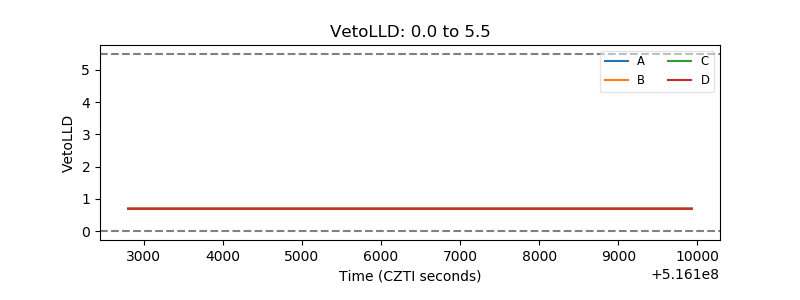 |
| Alpha Counter | 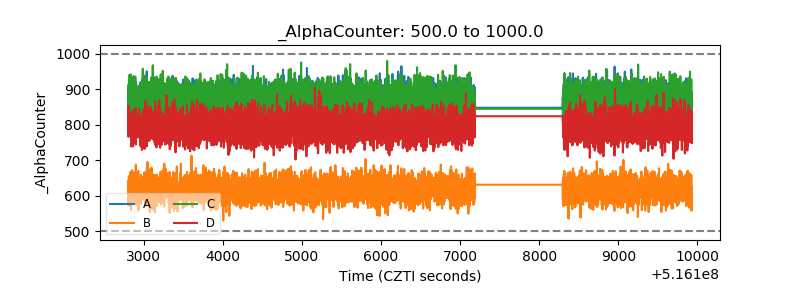 |
| _CPM_Rate | 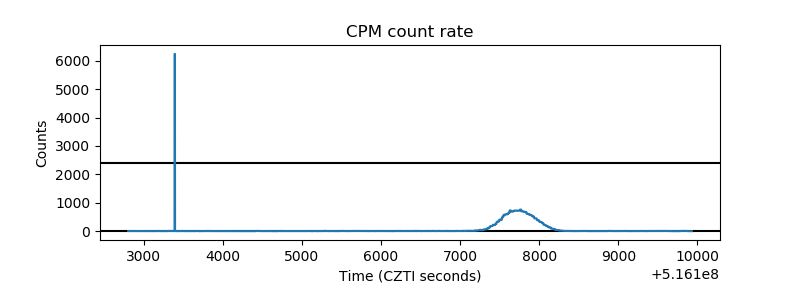 |
| CZT Counter | 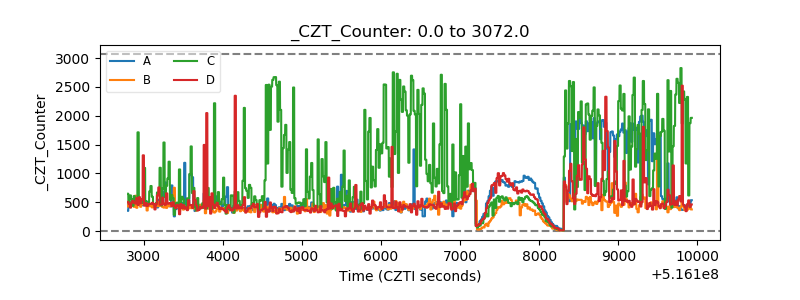 |
| +2.5 Volts monitor | 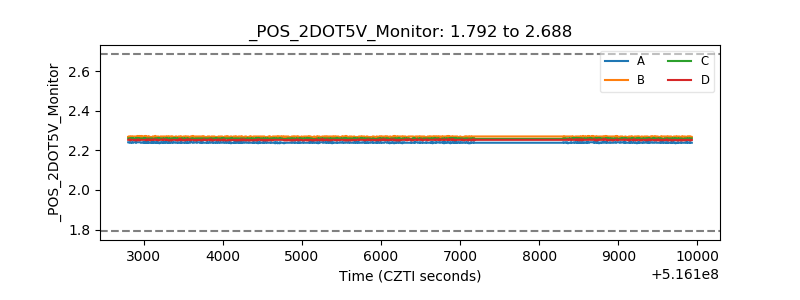 |
| +5 Volts monitor | 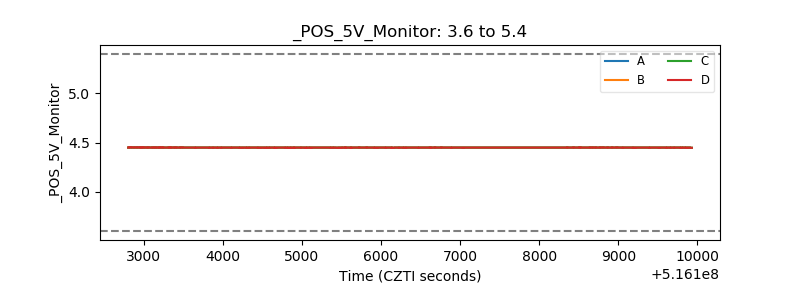 |
| _ROLL_ROT | 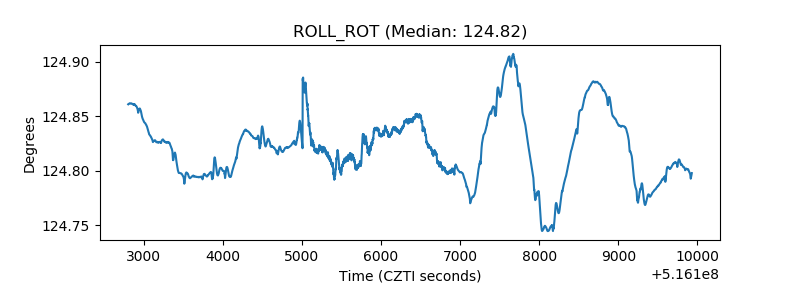 |
| _Roll_DEC | 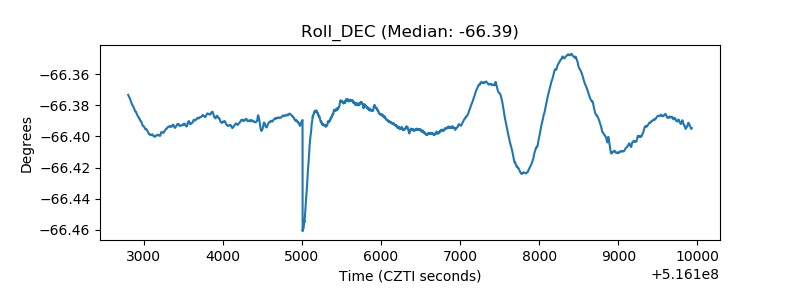 |
| _Roll_RA | 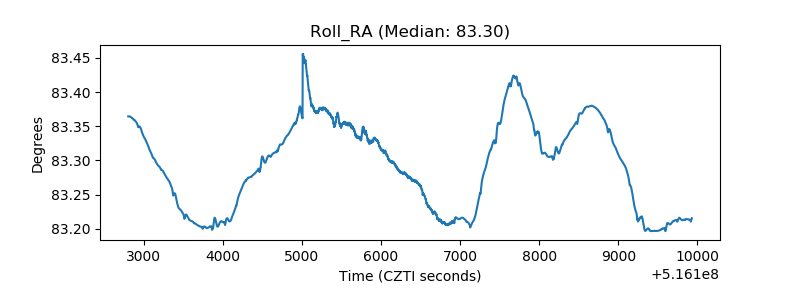 |
| Veto Counter | 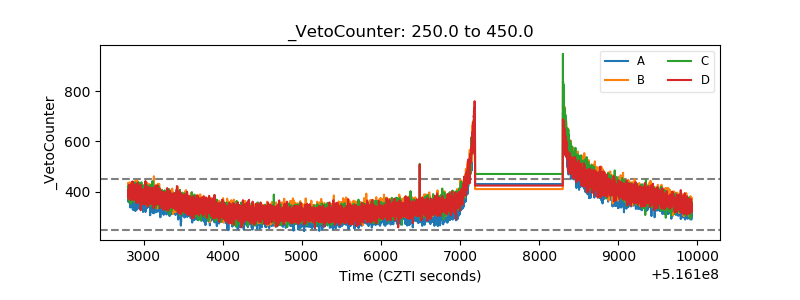 |