| Param | Original file | Final file |
|---|---|---|
| Filename | modeM0/AS1A14_102T01_9000006572_57438cztM0_level2.fits | modeM0/AS1A14_102T01_9000006572_57438cztM0_level2_quad_clean.evt |
| Size (bytes) | 455,846,400 | 89,173,440 |
| Size | 434.7 MB | 85.0 MB |
| Events in quadrant A | 4,314,104 | 576,016 |
| Events in quadrant B | 2,832,362 | 644,918 |
| Events in quadrant C | 5,236,011 | 524,788 |
| Events in quadrant D | 4,016,075 | 527,467 |
| Mode M0 | |||
|---|---|---|---|
| Quadrant | BADHDUFLAG | Total packets | Discarded packets |
| A | 0 | 17359 | 1 |
| B | 0 | 12925 | 1 |
| C | 0 | 19964 | 6 |
| D | 0 | 16296 | 1 |
| Mode M9 | |||
|---|---|---|---|
| Quadrant | BADHDUFLAG | Total packets | Discarded packets |
| A | 0 | 12 | 0 |
| B | 0 | 12 | 0 |
| C | 0 | 12 | 0 |
| D | 0 | 12 | 0 |
| Mode SS | |||
|---|---|---|---|
| Quadrant | BADHDUFLAG | Total packets | Discarded packets |
| A | 0 | 124 | 0 |
| B | 0 | 124 | 0 |
| C | 0 | 124 | 0 |
| D | 0 | 124 | 0 |
| Quadrant | Total seconds | Saturated seconds | Saturation percentage |
|---|---|---|---|
| A | 6115 | 426 | 6.966476% |
| B | 6115 | 97 | 1.586263% |
| C | 6114 | 676 | 11.056591% |
| D | 6115 | 295 | 4.824203% |
Noise dominated data is calculated using 1-second bins in cleaned event files. If a bin has >2000 counts, and if more than 50% of those come from <1% of pixels, then it is considered to be noise-dominated and hence unusable.
| Quadrant | # 1 sec bins | Bins with >0 counts | Bins with >2000 counts | High rate bins dominated by noise | Noise dominated (total time) | Noise dominated (detector-on time) | Marked lightcurve |
|---|---|---|---|---|---|---|---|
| A | 7235 | 6116 | 134 | 134 | 1.85% | 2.19% | 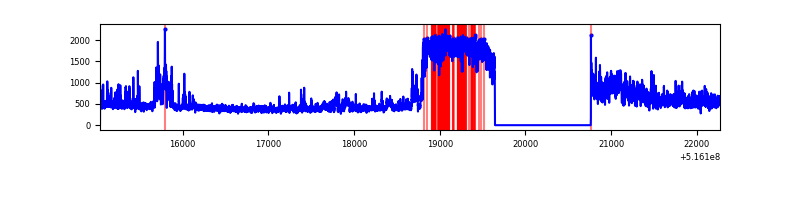 |
| B | 7235 | 6116 | 18 | 18 | 0.25% | 0.29% | 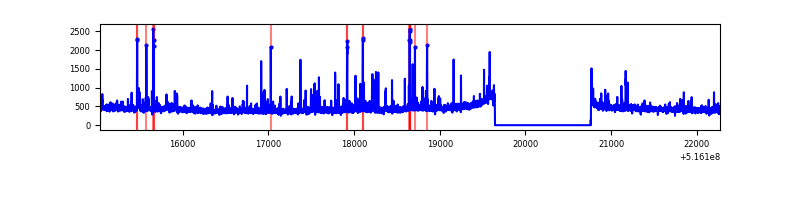 |
| C | 7234 | 6115 | 589 | 589 | 8.14% | 9.63% | 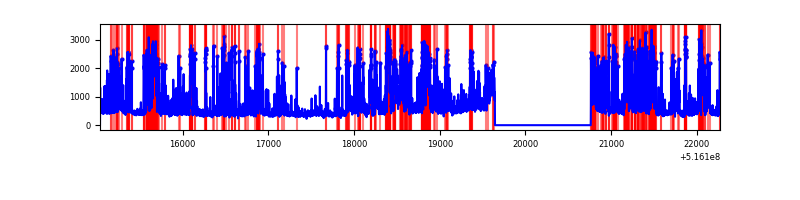 |
| D | 7235 | 6116 | 258 | 258 | 3.57% | 4.22% | 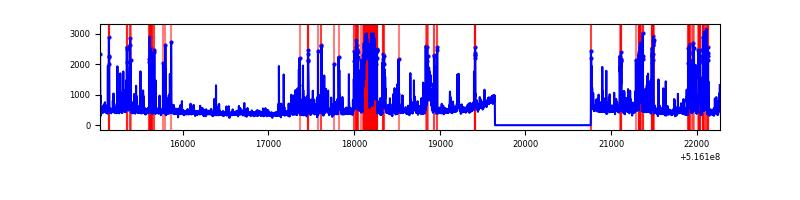 |
Top three noisy pixels from each quadrant. If the there are fewer than three noisy pixels in the level2.evt file, extra rows are filled as -1
| Pixel properties | Quadrant properties | ||||||
|---|---|---|---|---|---|---|---|
| Quadrant | DetID | PixID | Counts | Sigma | Mean | Median | Sigma |
| A | 0 | 12 | 1604185 | 9993.85 | 654 | 636 | 160.5 |
| A | 5 | 242 | 93629 | 579.56 | 654 | 636 | 160.5 |
| A | 3 | 14 | 55434 | 341.52 | 654 | 636 | 160.5 |
| B | 0 | 213 | 64754 | 463.71 | 652 | 629 | 138.3 |
| B | 10 | 247 | 50099 | 357.73 | 652 | 629 | 138.3 |
| B | 0 | 245 | 24704 | 174.09 | 652 | 629 | 138.3 |
| C | 15 | 224 | 2631178 | 15829.21 | 605 | 601 | 166.2 |
| C | 14 | 254 | 97673 | 584.12 | 605 | 601 | 166.2 |
| C | 14 | 96 | 41555 | 246.43 | 605 | 601 | 166.2 |
| D | 2 | 249 | 517420 | 2881.87 | 632 | 604 | 179.3 |
| D | 15 | 142 | 319172 | 1776.4 | 632 | 604 | 179.3 |
| D | 15 | 94 | 225669 | 1255.01 | 632 | 604 | 179.3 |
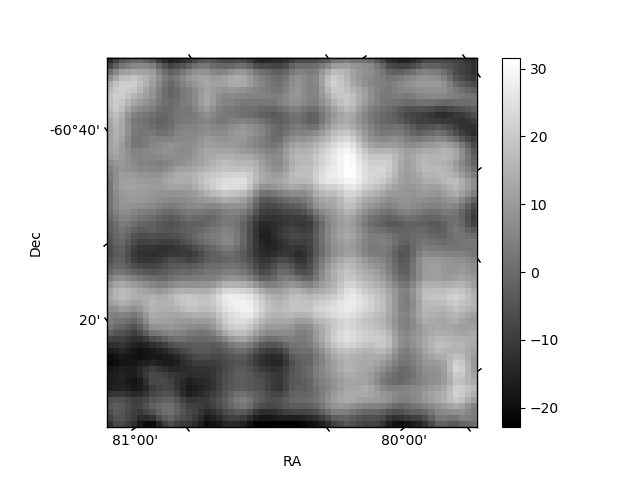
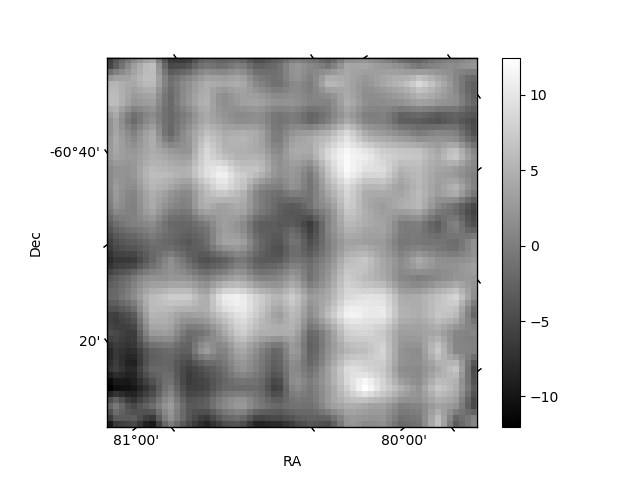
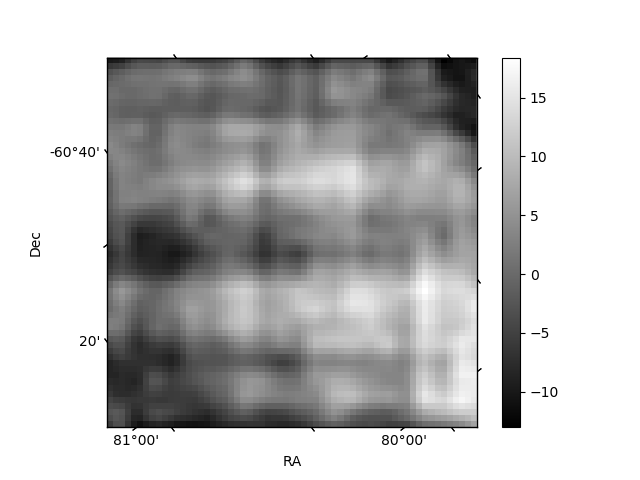
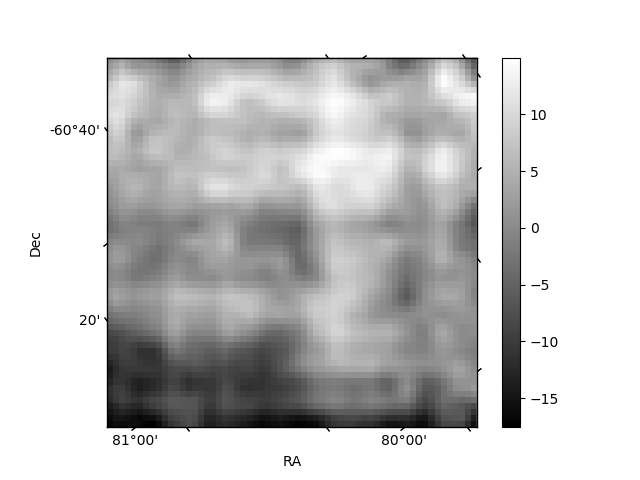
Histogram calculated using DETX and DETY for each event in the final _common_clean file
| Quadrant A | 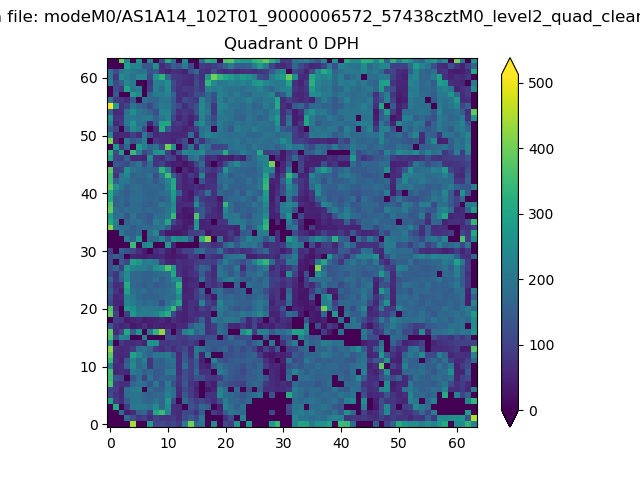 |
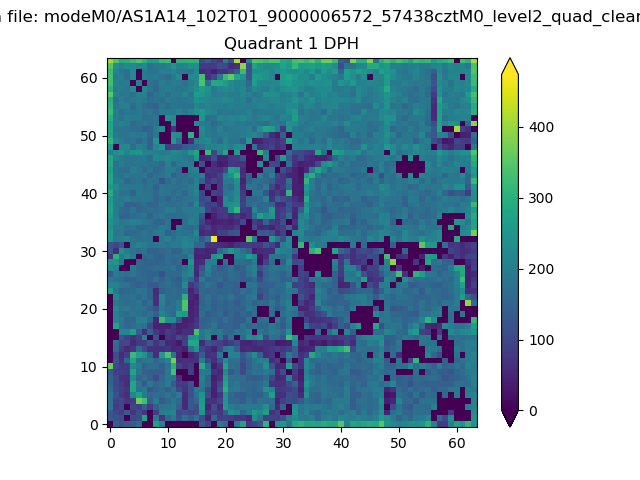 |
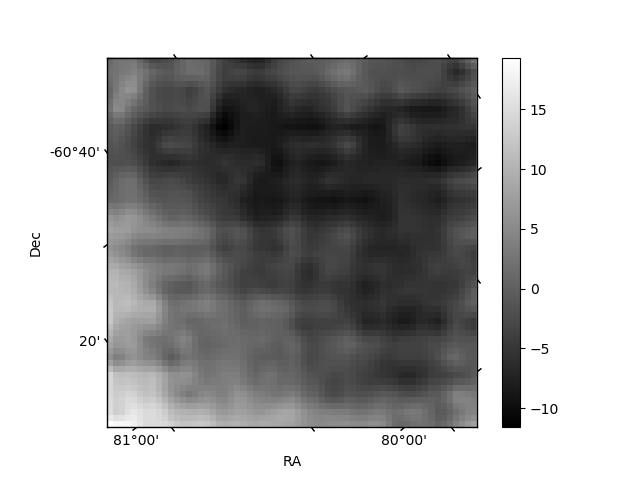
Quadrant B |
|---|---|---|---|
| Quadrant D | 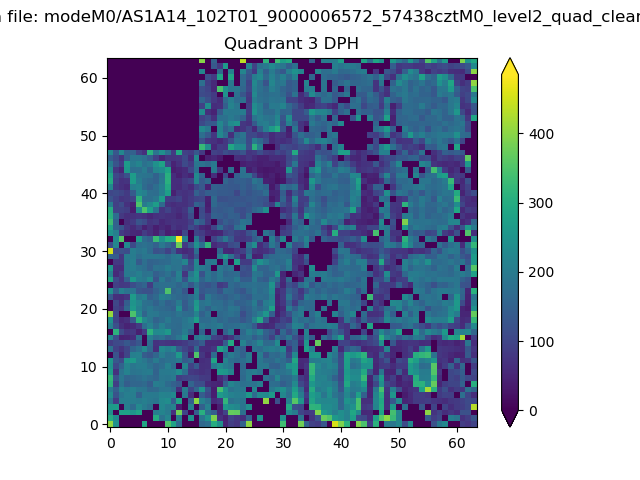 |
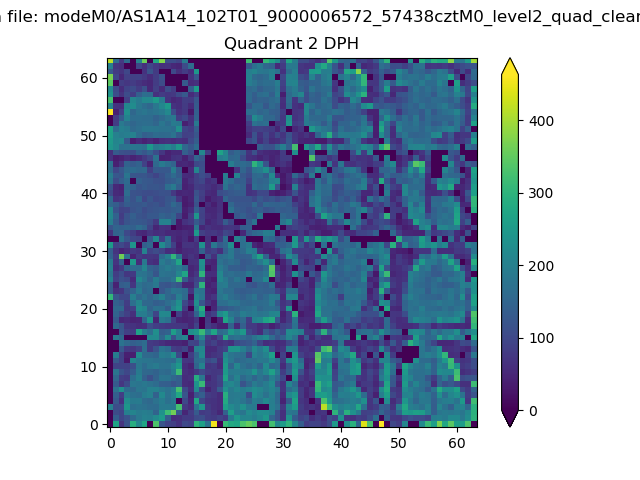 |
Quadrant C |
| Plot type | Count rate plots | Images |
|---|---|---|
| Comparison with Poisson distribution Blue bars denote a histogram of data divided into 1 sec bins. Red curve is a Poisson curve with rate = median count rate of data. |
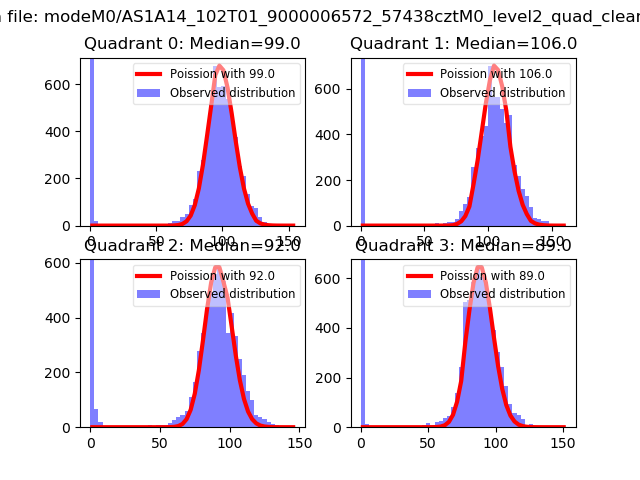 |
 |
| Quadrant-wise count rates Data is divided into 100 sec bins |
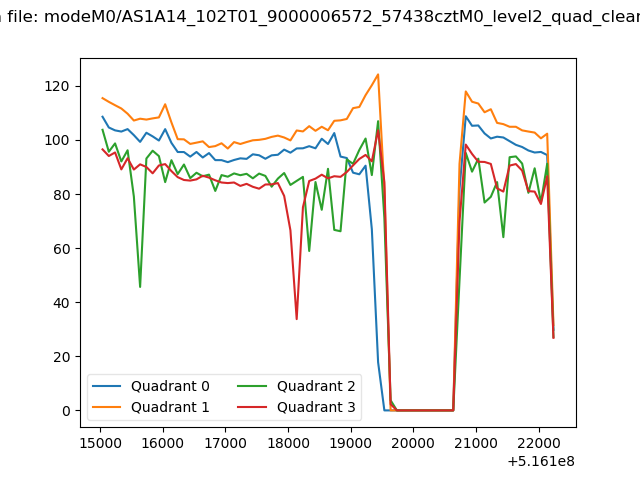 |
|
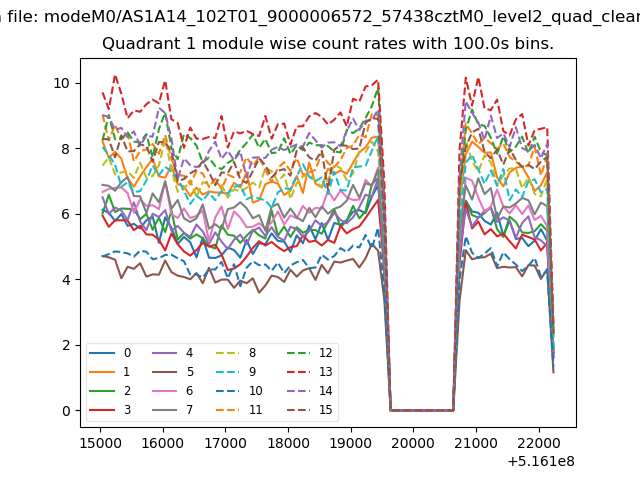
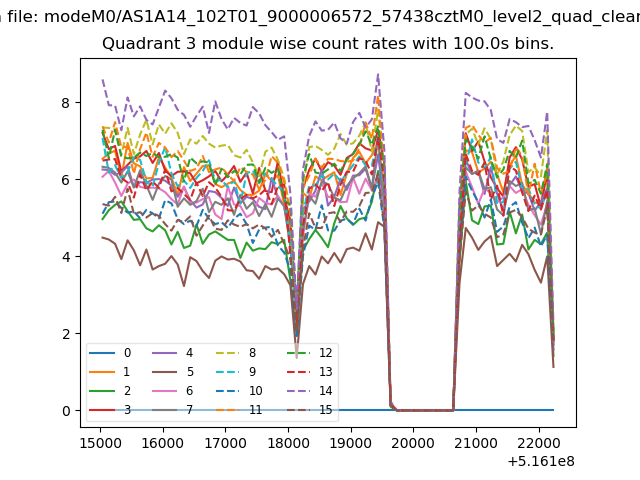
| Module-wise count rates for Quadrant A Data is divided into 100 sec bins |
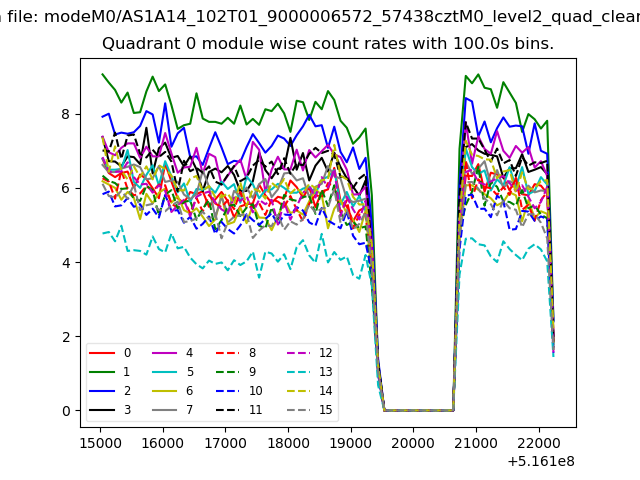 |
 |
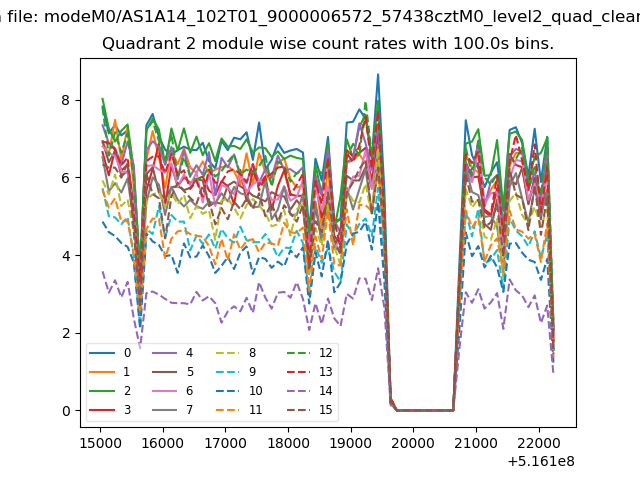
| Module-wise count rates for Quadrant B Data is divided into 100 sec bins |
 |
 |
| Module-wise count rates for Quadrant C Data is divided into 100 sec bins |
 |
 |
| Module-wise count rates for Quadrant D Data is divided into 100 sec bins |
 |
 |
| Parameter | Plot |
|---|---|
| CZT HV Monitor | 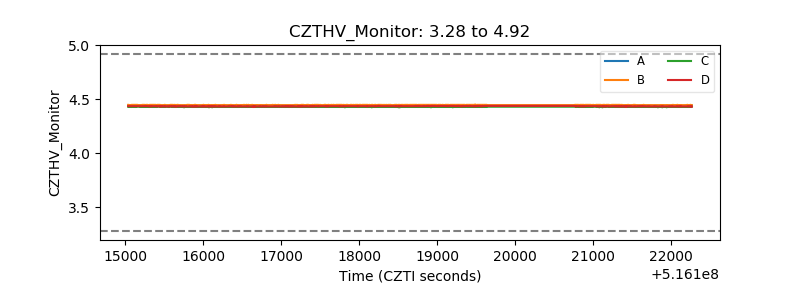 |
| D_VDD | 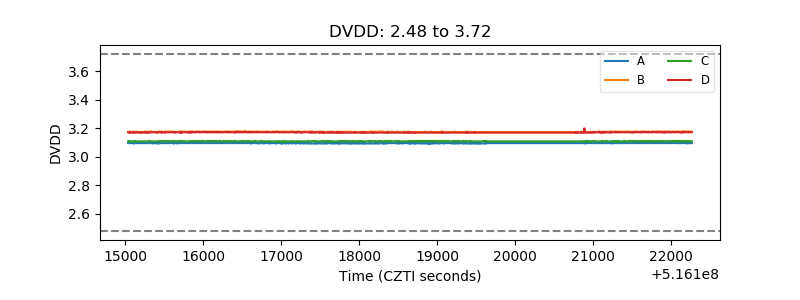 |
| Temperature 1 | 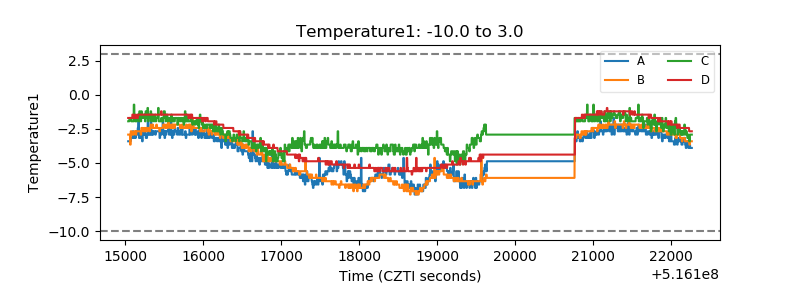 |
| Veto HV Monitor | 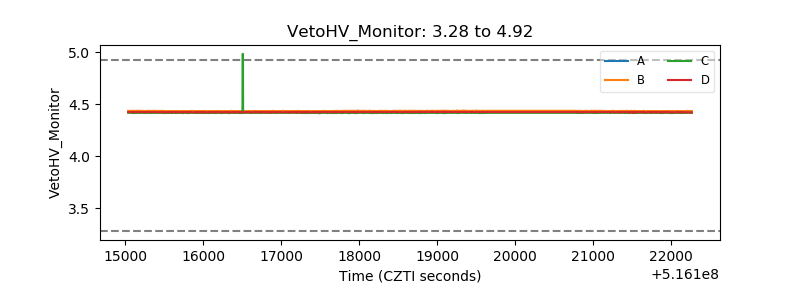 |
| Veto LLD | 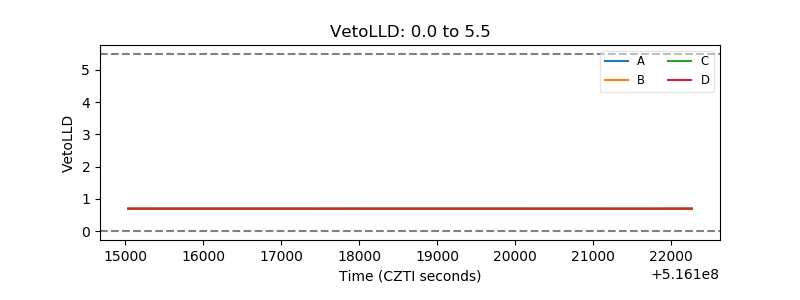 |
| Alpha Counter | 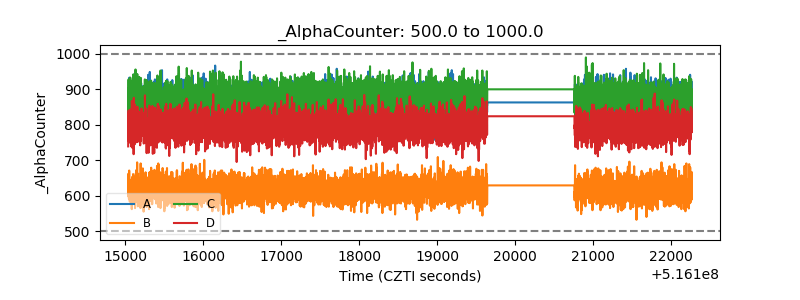 |
| _CPM_Rate | 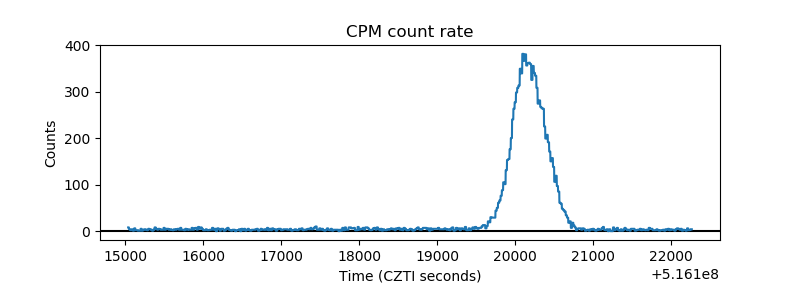 |
| CZT Counter | 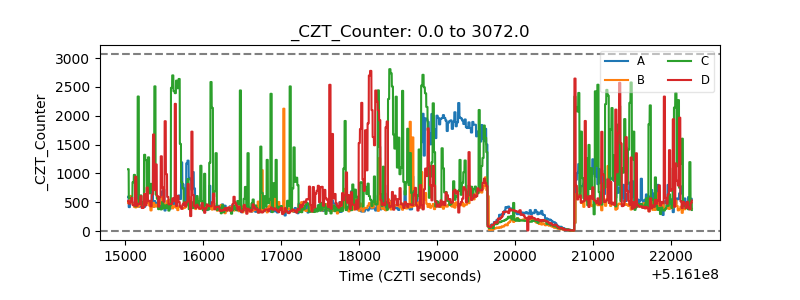 |
| +2.5 Volts monitor |  |
| +5 Volts monitor |  |
| _ROLL_ROT | 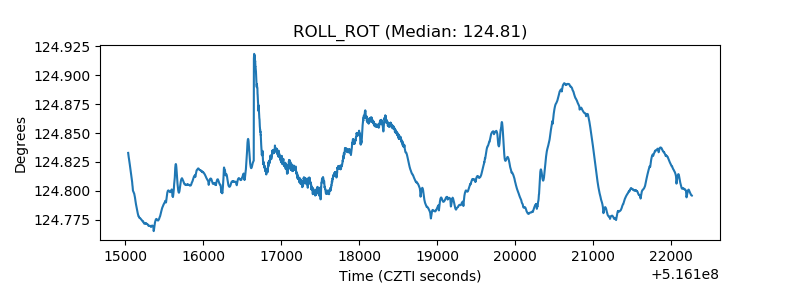 |
| _Roll_DEC | 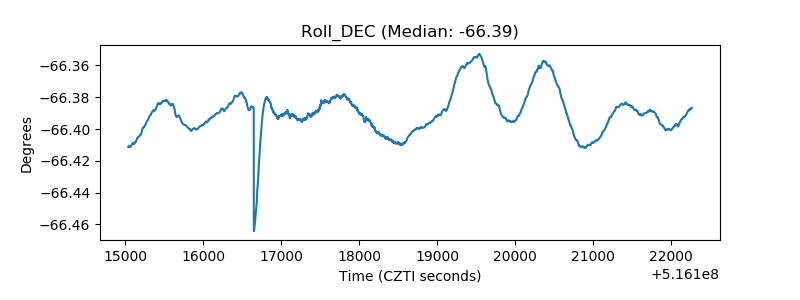 |
| _Roll_RA | 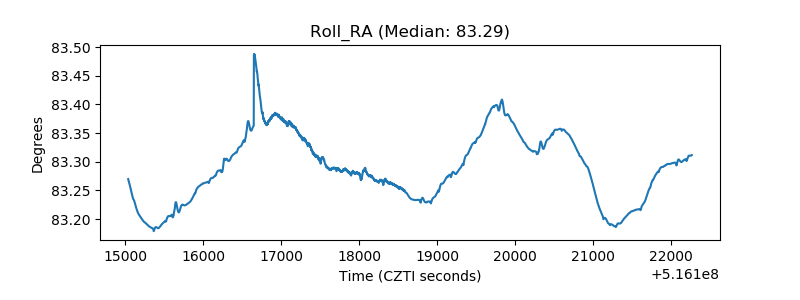 |
| Veto Counter | 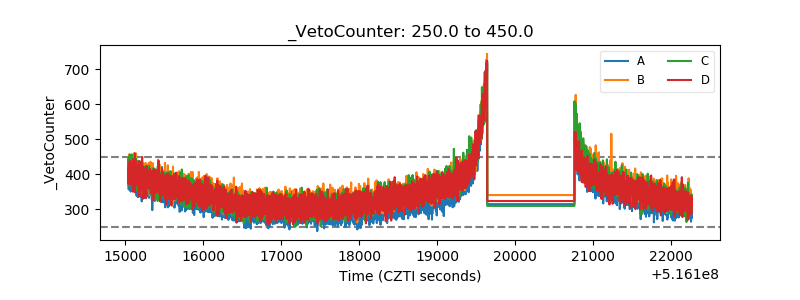 |