| Param | Original file | Final file |
|---|---|---|
| Filename | modeM0/AS1A14_102T01_9000006572_57439cztM0_level2.fits | modeM0/AS1A14_102T01_9000006572_57439cztM0_level2_quad_clean.evt |
| Size (bytes) | 533,027,520 | 90,138,240 |
| Size | 508.3 MB | 86.0 MB |
| Events in quadrant A | 4,965,233 | 611,220 |
| Events in quadrant B | 2,888,797 | 649,865 |
| Events in quadrant C | 6,079,825 | 509,352 |
| Events in quadrant D | 5,305,457 | 516,737 |
| Mode M0 | |||
|---|---|---|---|
| Quadrant | BADHDUFLAG | Total packets | Discarded packets |
| A | 0 | 19156 | 1 |
| B | 0 | 13385 | 2 |
| C | 0 | 22561 | 1 |
| D | 0 | 20182 | 1 |
| Mode M9 | |||
|---|---|---|---|
| Quadrant | BADHDUFLAG | Total packets | Discarded packets |
| A | 0 | 9 | 0 |
| B | 0 | 9 | 0 |
| C | 0 | 9 | 0 |
| D | 0 | 9 | 0 |
| Mode SS | |||
|---|---|---|---|
| Quadrant | BADHDUFLAG | Total packets | Discarded packets |
| A | 0 | 128 | 0 |
| B | 0 | 128 | 0 |
| C | 0 | 128 | 0 |
| D | 0 | 128 | 0 |
| Quadrant | Total seconds | Saturated seconds | Saturation percentage |
|---|---|---|---|
| A | 6338 | 97 | 1.530451% |
| B | 6337 | 110 | 1.735837% |
| C | 6338 | 923 | 14.562954% |
| D | 6338 | 561 | 8.851373% |
Noise dominated data is calculated using 1-second bins in cleaned event files. If a bin has >2000 counts, and if more than 50% of those come from <1% of pixels, then it is considered to be noise-dominated and hence unusable.
| Quadrant | # 1 sec bins | Bins with >0 counts | Bins with >2000 counts | High rate bins dominated by noise | Noise dominated (total time) | Noise dominated (detector-on time) | Marked lightcurve |
|---|---|---|---|---|---|---|---|
| A | 7233 | 6339 | 2 | 2 | 0.03% | 0.03% | 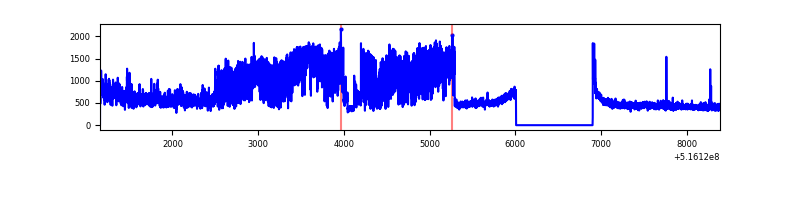 |
| B | 7232 | 6338 | 15 | 15 | 0.21% | 0.24% | 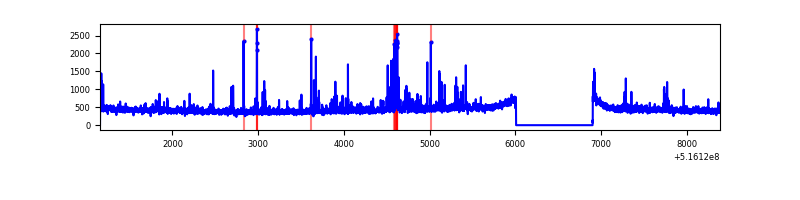 |
| C | 7233 | 6339 | 801 | 801 | 11.07% | 12.64% | 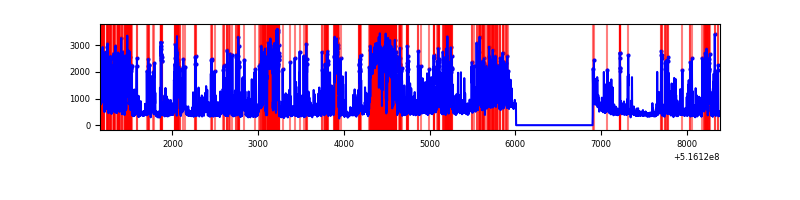 |
| D | 7233 | 6339 | 534 | 534 | 7.38% | 8.42% | 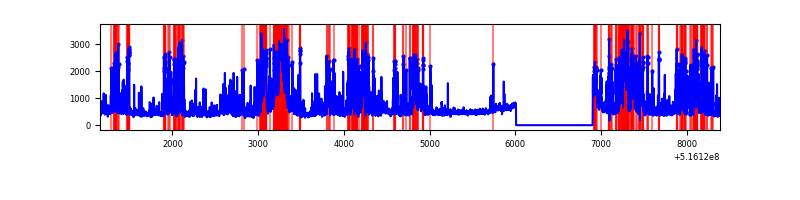 |
Top three noisy pixels from each quadrant. If the there are fewer than three noisy pixels in the level2.evt file, extra rows are filled as -1
| Pixel properties | Quadrant properties | ||||||
|---|---|---|---|---|---|---|---|
| Quadrant | DetID | PixID | Counts | Sigma | Mean | Median | Sigma |
| A | 0 | 12 | 2218312 | 13175.86 | 681 | 665 | 168.3 |
| A | 3 | 14 | 56832 | 333.71 | 681 | 665 | 168.3 |
| A | 10 | 251 | 36596 | 213.48 | 681 | 665 | 168.3 |
| B | 10 | 247 | 46066 | 319.76 | 671 | 646 | 142.0 |
| B | 5 | 185 | 39231 | 271.64 | 671 | 646 | 142.0 |
| B | 4 | 201 | 31910 | 220.1 | 671 | 646 | 142.0 |
| C | 15 | 224 | 2924850 | 17668.0 | 607 | 603 | 165.5 |
| C | 12 | 2 | 389227 | 2348.03 | 607 | 603 | 165.5 |
| C | 14 | 245 | 130165 | 782.8 | 607 | 603 | 165.5 |
| D | 2 | 249 | 1211051 | 6810.53 | 633 | 602 | 177.7 |
| D | 15 | 142 | 639742 | 3596.09 | 633 | 602 | 177.7 |
| D | 8 | 240 | 377168 | 2118.73 | 633 | 602 | 177.7 |
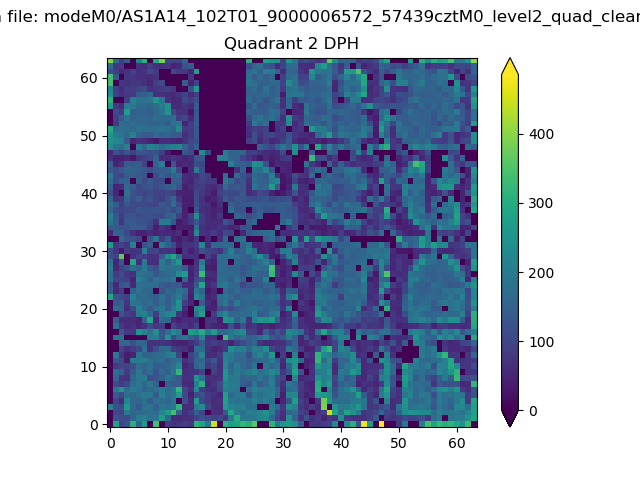
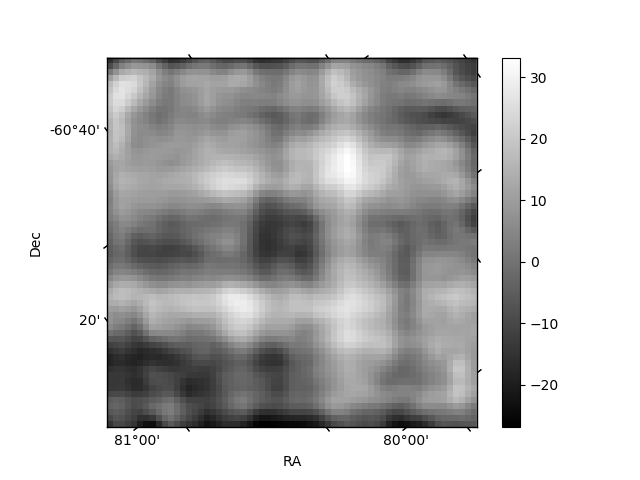
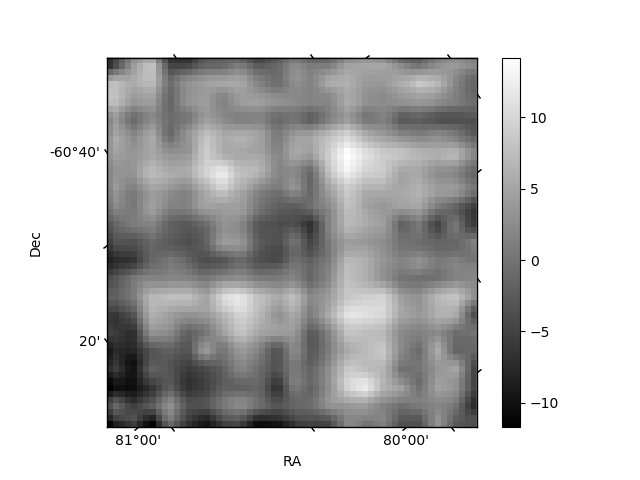
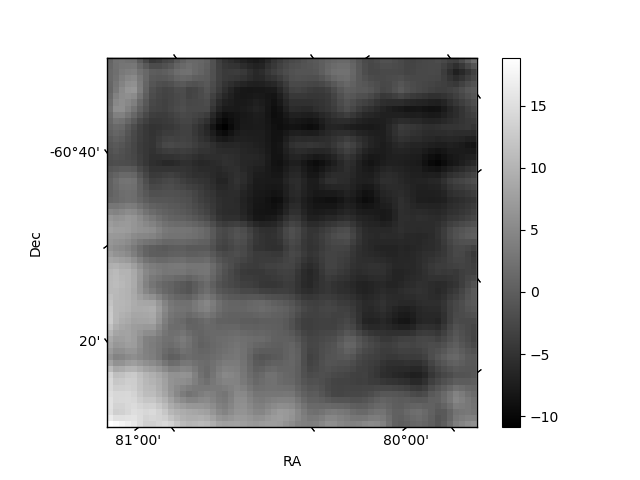
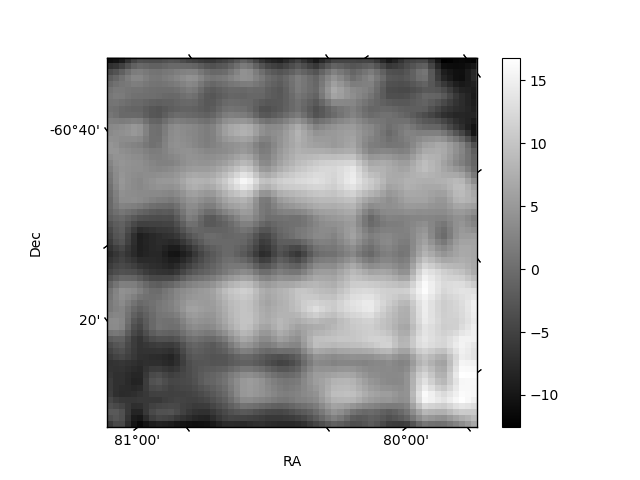
Histogram calculated using DETX and DETY for each event in the final _common_clean file
| Quadrant A | 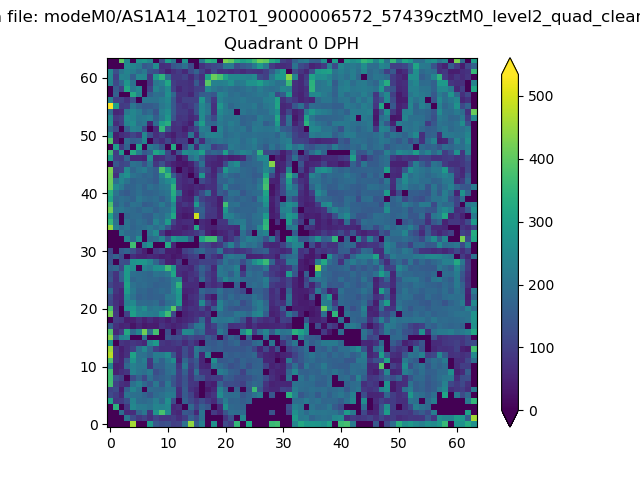 |
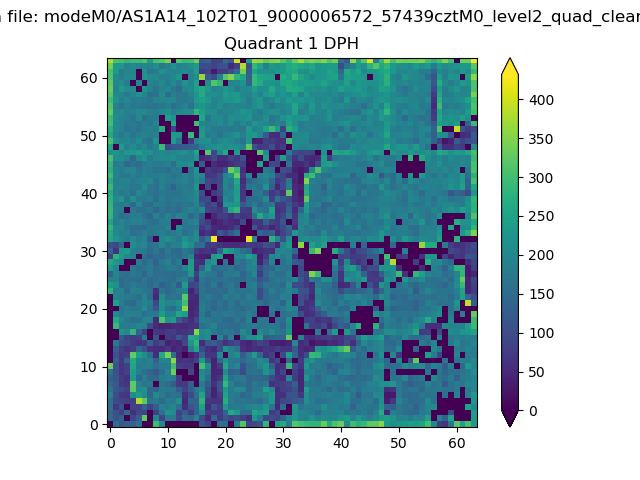 |
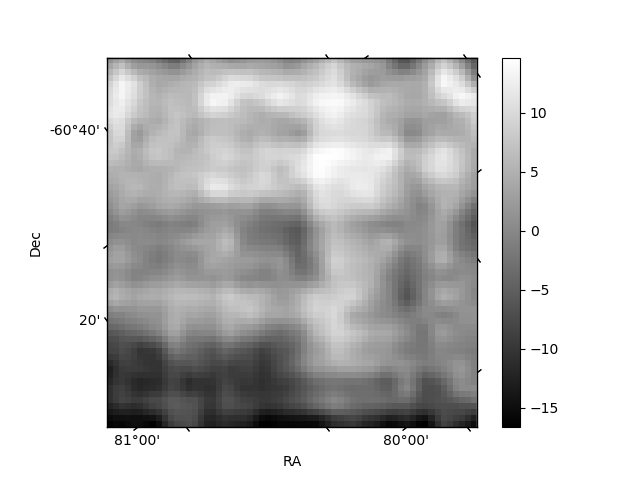
Quadrant B |
|---|---|---|---|
| Quadrant D | 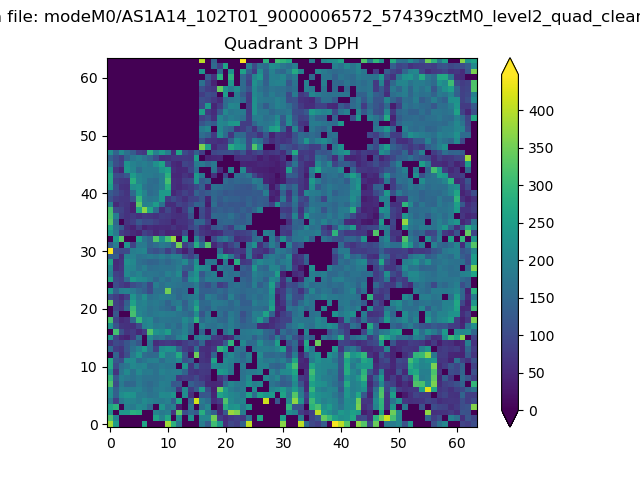 |
 |
Quadrant C |
| Plot type | Count rate plots | Images |
|---|---|---|
| Comparison with Poisson distribution Blue bars denote a histogram of data divided into 1 sec bins. Red curve is a Poisson curve with rate = median count rate of data. |
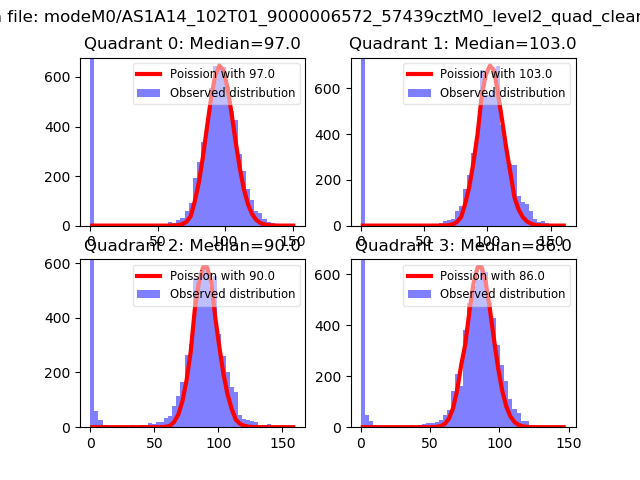 |
 |
| Quadrant-wise count rates Data is divided into 100 sec bins |
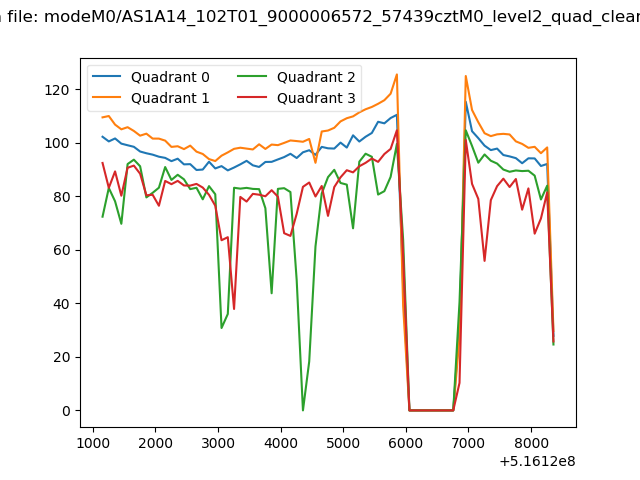 |
|
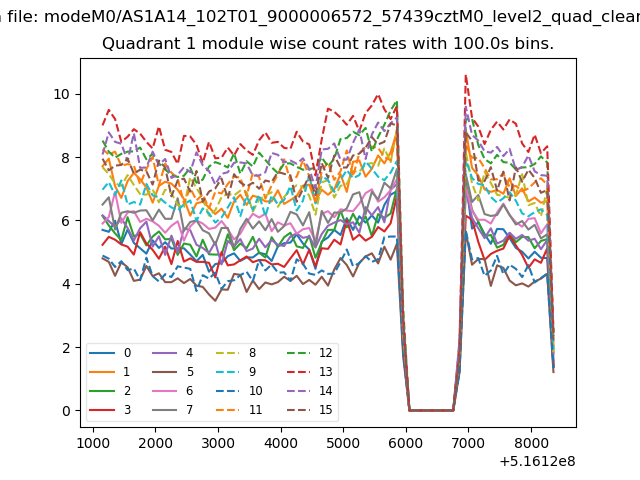
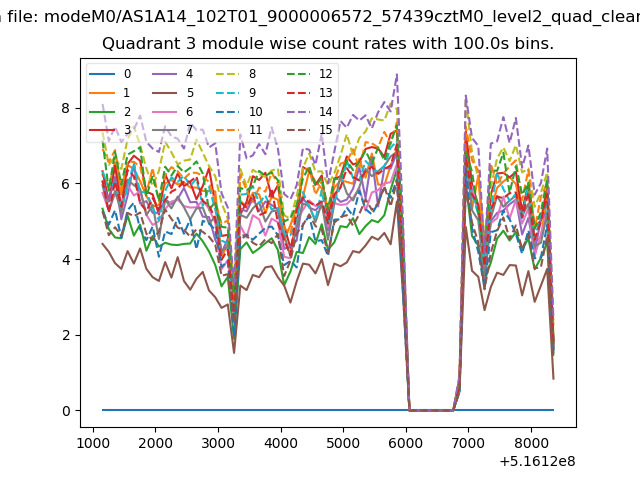
| Module-wise count rates for Quadrant A Data is divided into 100 sec bins |
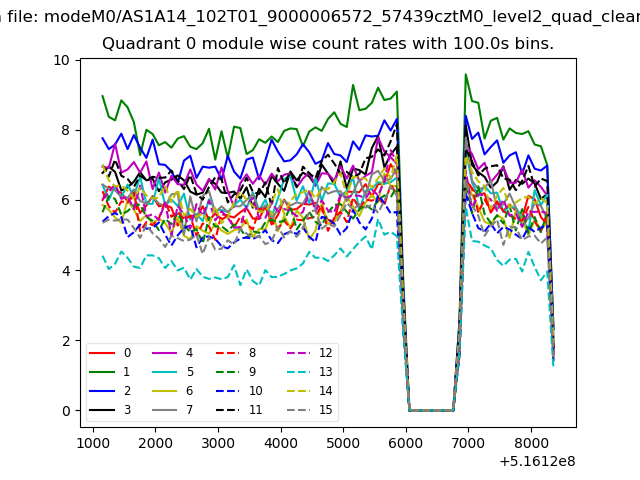 |
 |
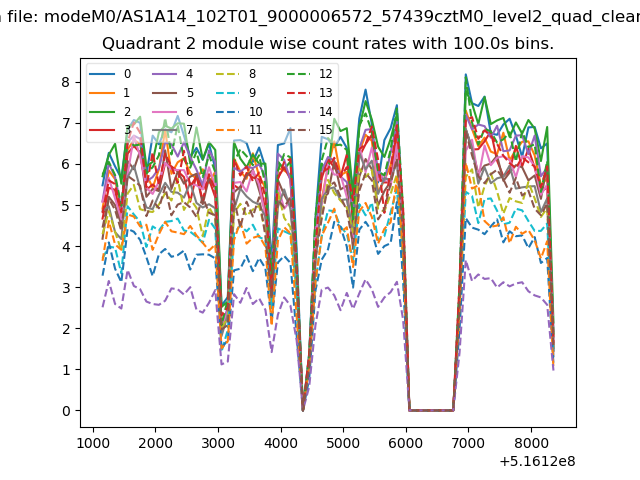
| Module-wise count rates for Quadrant B Data is divided into 100 sec bins |
 |
 |
| Module-wise count rates for Quadrant C Data is divided into 100 sec bins |
 |
 |
| Module-wise count rates for Quadrant D Data is divided into 100 sec bins |
 |
 |
| Parameter | Plot |
|---|---|
| CZT HV Monitor | 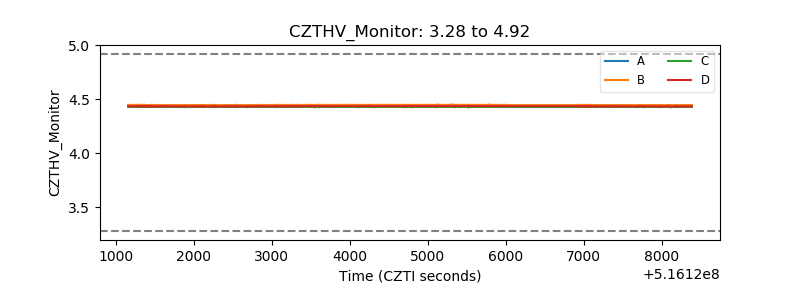 |
| D_VDD | 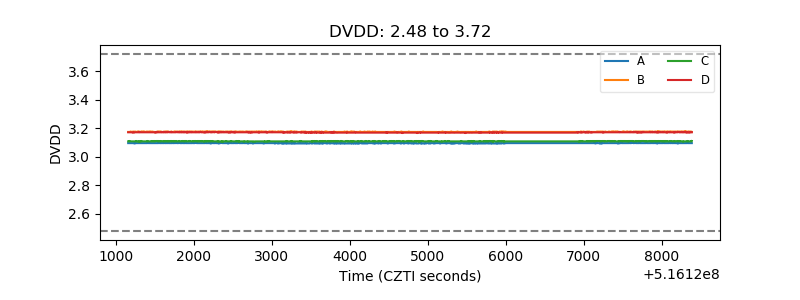 |
| Temperature 1 | 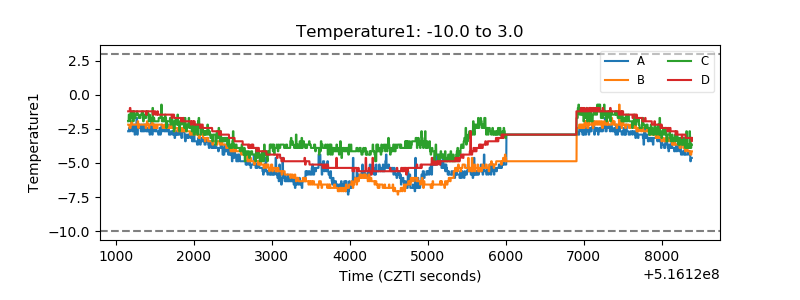 |
| Veto HV Monitor |  |
| Veto LLD | 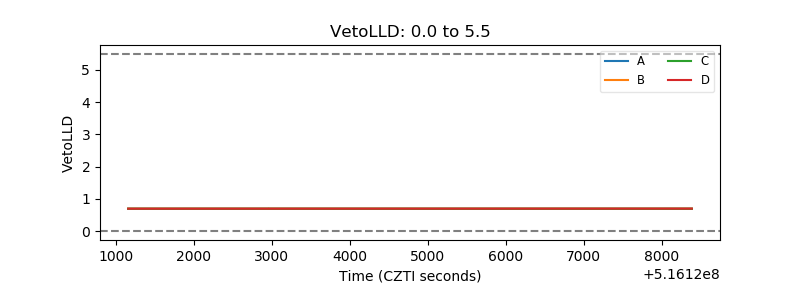 |
| Alpha Counter | 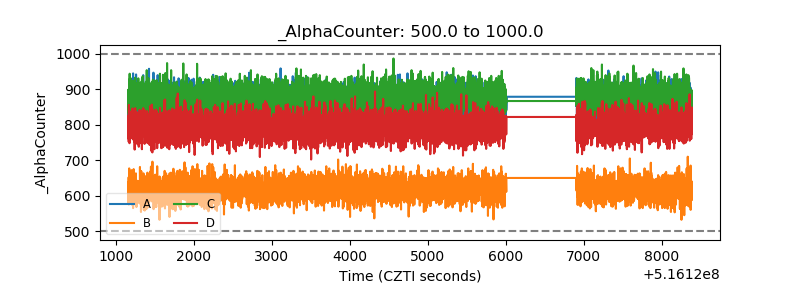 |
| _CPM_Rate | 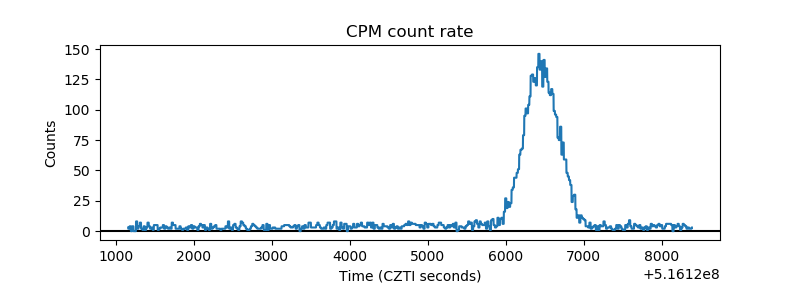 |
| CZT Counter | 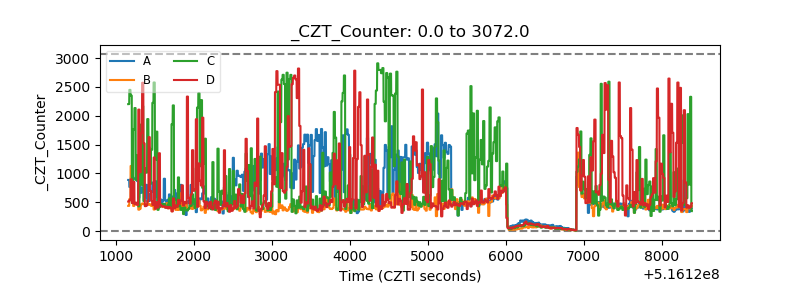 |
| +2.5 Volts monitor |  |
| +5 Volts monitor |  |
| _ROLL_ROT | 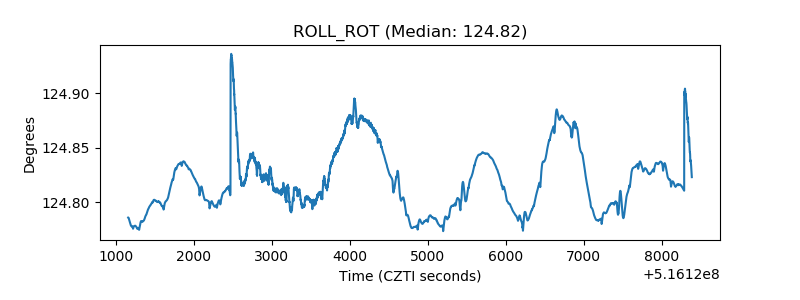 |
| _Roll_DEC | 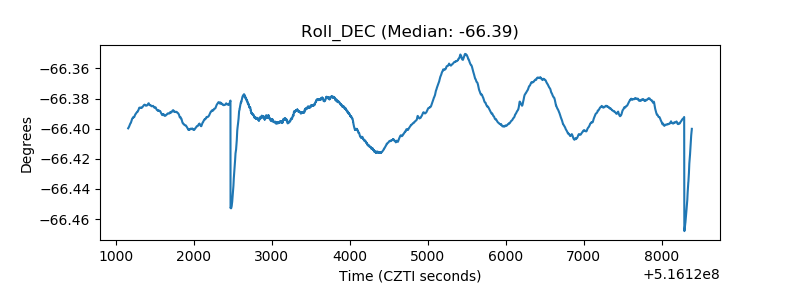 |
| _Roll_RA | 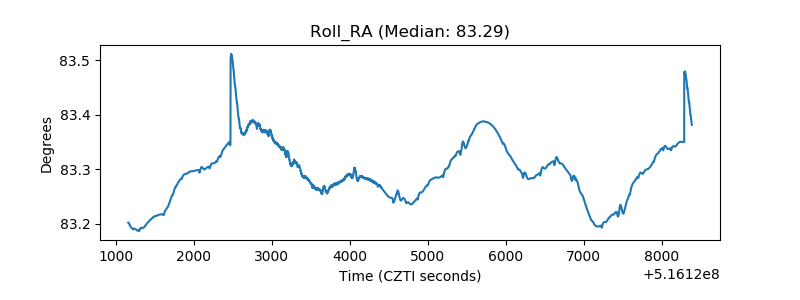 |
| Veto Counter | 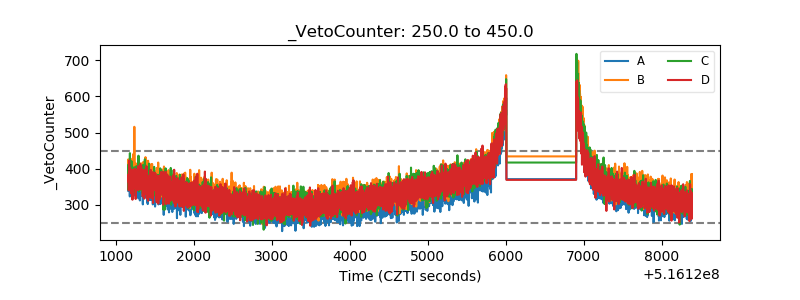 |