| Param | Original file | Final file |
|---|---|---|
| Filename | modeM0/AS1A14_102T01_9000006572_57440cztM0_level2.fits | modeM0/AS1A14_102T01_9000006572_57440cztM0_level2_quad_clean.evt |
| Size (bytes) | 485,565,120 | 97,050,240 |
| Size | 463.1 MB | 92.6 MB |
| Events in quadrant A | 3,428,218 | 643,174 |
| Events in quadrant B | 3,270,204 | 692,594 |
| Events in quadrant C | 5,130,873 | 586,637 |
| Events in quadrant D | 5,612,978 | 539,091 |
| Mode M0 | |||
|---|---|---|---|
| Quadrant | BADHDUFLAG | Total packets | Discarded packets |
| A | 0 | 15346 | 1 |
| B | 0 | 14794 | 1 |
| C | 0 | 20150 | 1 |
| D | 0 | 21494 | 3 |
| Mode M9 | |||
|---|---|---|---|
| Quadrant | BADHDUFLAG | Total packets | Discarded packets |
| A | 0 | 6 | 0 |
| B | 0 | 6 | 0 |
| C | 0 | 6 | 0 |
| D | 0 | 6 | 0 |
| Mode SS | |||
|---|---|---|---|
| Quadrant | BADHDUFLAG | Total packets | Discarded packets |
| A | 0 | 140 | 0 |
| B | 0 | 140 | 0 |
| C | 0 | 140 | 0 |
| D | 0 | 140 | 0 |
| Quadrant | Total seconds | Saturated seconds | Saturation percentage |
|---|---|---|---|
| A | 6843 | 167 | 2.440450% |
| B | 6843 | 102 | 1.490574% |
| C | 6843 | 466 | 6.809879% |
| D | 6842 | 621 | 9.076293% |
Noise dominated data is calculated using 1-second bins in cleaned event files. If a bin has >2000 counts, and if more than 50% of those come from <1% of pixels, then it is considered to be noise-dominated and hence unusable.
| Quadrant | # 1 sec bins | Bins with >0 counts | Bins with >2000 counts | High rate bins dominated by noise | Noise dominated (total time) | Noise dominated (detector-on time) | Marked lightcurve |
|---|---|---|---|---|---|---|---|
| A | 7468 | 6844 | 139 | 139 | 1.86% | 2.03% | 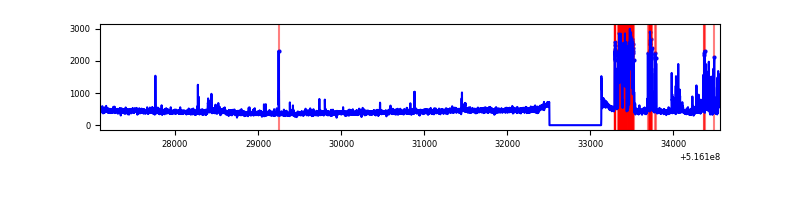 |
| B | 7468 | 6844 | 38 | 38 | 0.51% | 0.56% | 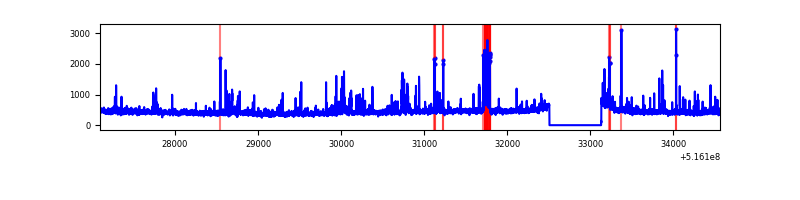 |
| C | 7468 | 6844 | 383 | 383 | 5.13% | 5.60% | 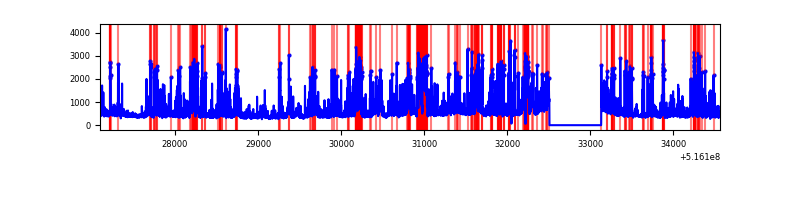 |
| D | 7467 | 6843 | 615 | 615 | 8.24% | 8.99% | 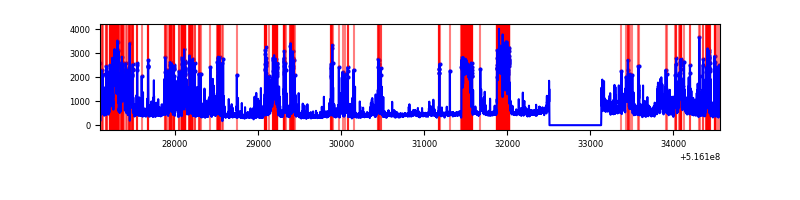 |
Top three noisy pixels from each quadrant. If the there are fewer than three noisy pixels in the level2.evt file, extra rows are filled as -1
| Pixel properties | Quadrant properties | ||||||
|---|---|---|---|---|---|---|---|
| Quadrant | DetID | PixID | Counts | Sigma | Mean | Median | Sigma |
| A | 10 | 251 | 564983 | 3175.27 | 721 | 701 | 177.7 |
| A | 3 | 14 | 48786 | 270.58 | 721 | 701 | 177.7 |
| A | 4 | 3 | 11941 | 63.25 | 721 | 701 | 177.7 |
| B | 4 | 201 | 134571 | 871.62 | 715 | 689 | 153.6 |
| B | 4 | 171 | 84955 | 548.6 | 715 | 689 | 153.6 |
| B | 0 | 245 | 47806 | 306.75 | 715 | 689 | 153.6 |
| C | 15 | 224 | 2177553 | 11808.6 | 677 | 670 | 184.3 |
| C | 14 | 254 | 86548 | 465.85 | 677 | 670 | 184.3 |
| C | 12 | 252 | 51660 | 276.59 | 677 | 670 | 184.3 |
| D | 2 | 249 | 999838 | 5308.06 | 663 | 633 | 188.2 |
| D | 15 | 94 | 631920 | 3353.57 | 663 | 633 | 188.2 |
| D | 8 | 240 | 492515 | 2613.01 | 663 | 633 | 188.2 |
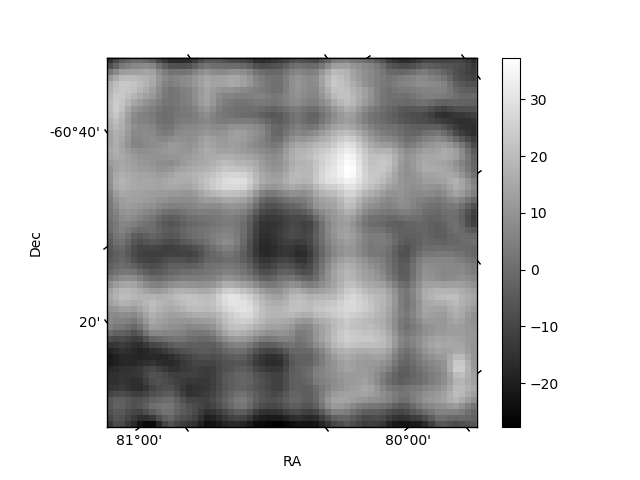
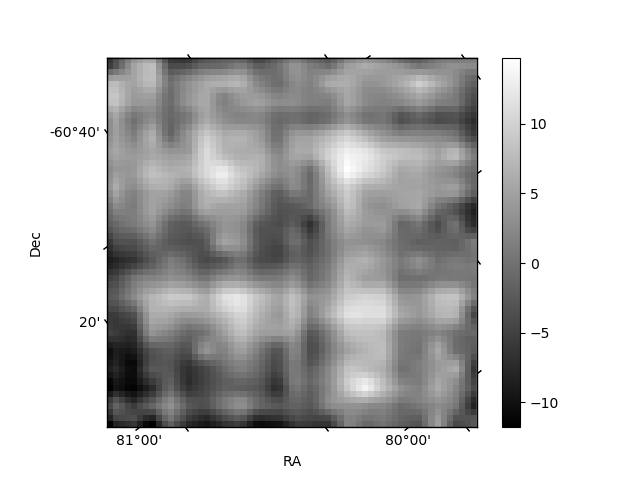
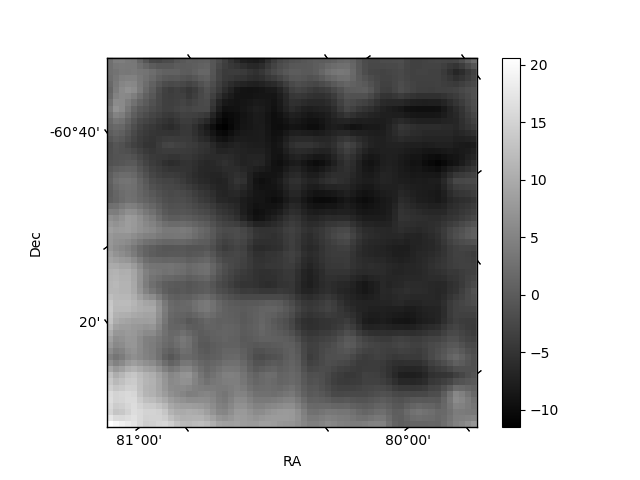
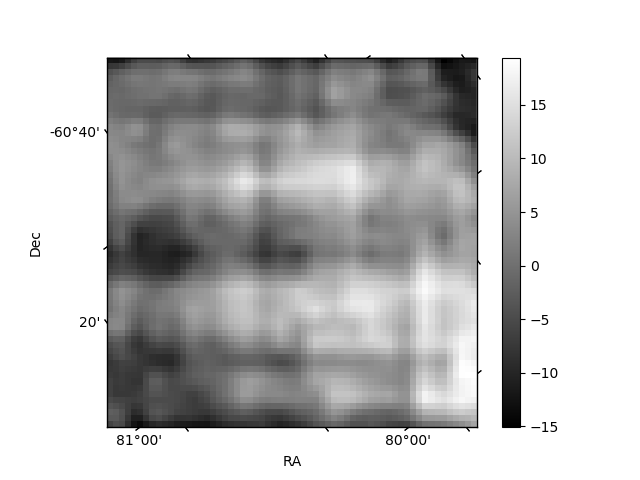
Histogram calculated using DETX and DETY for each event in the final _common_clean file
| Quadrant A | 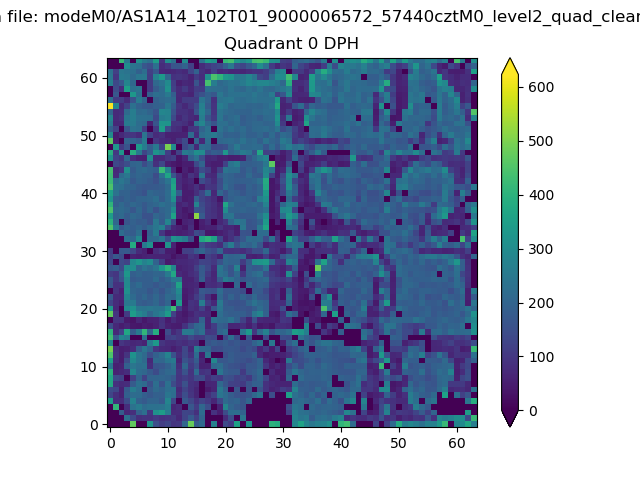 |
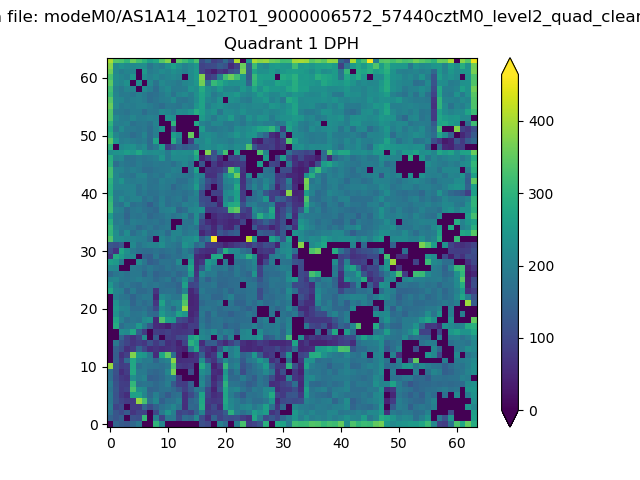 |
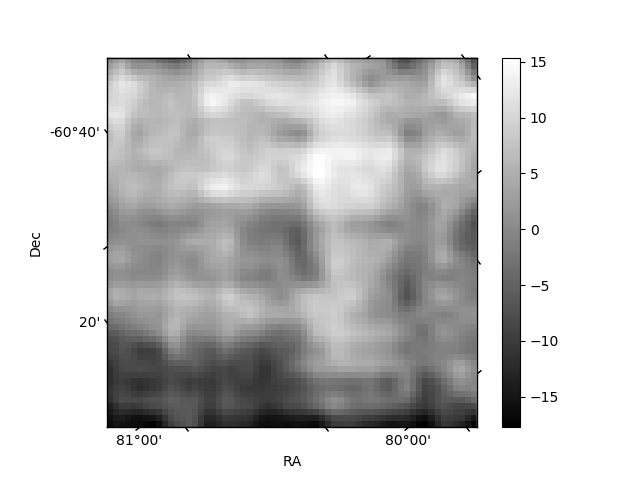
Quadrant B |
|---|---|---|---|
| Quadrant D | 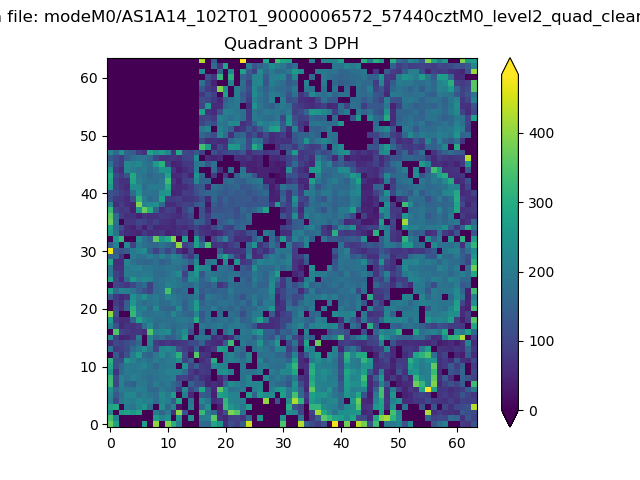 |
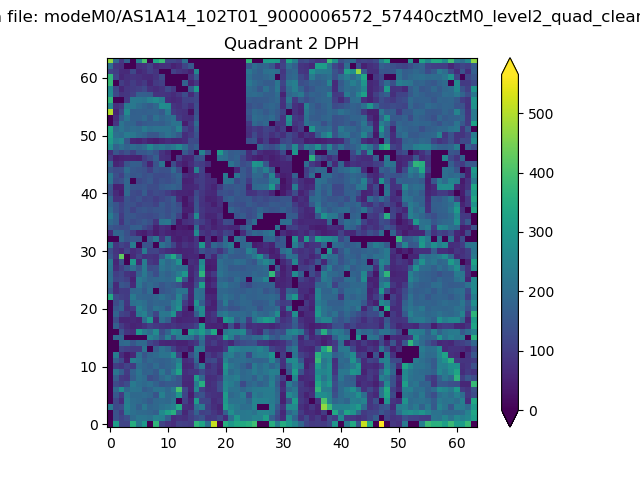 |
Quadrant C |
| Plot type | Count rate plots | Images |
|---|---|---|
| Comparison with Poisson distribution Blue bars denote a histogram of data divided into 1 sec bins. Red curve is a Poisson curve with rate = median count rate of data. |
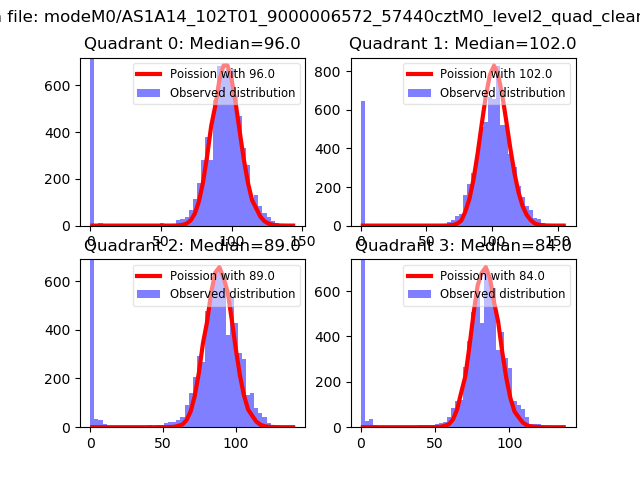 |
 |
| Quadrant-wise count rates Data is divided into 100 sec bins |
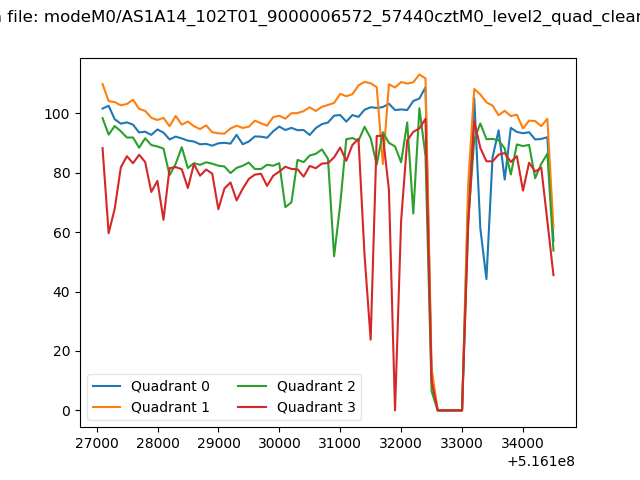 |
|
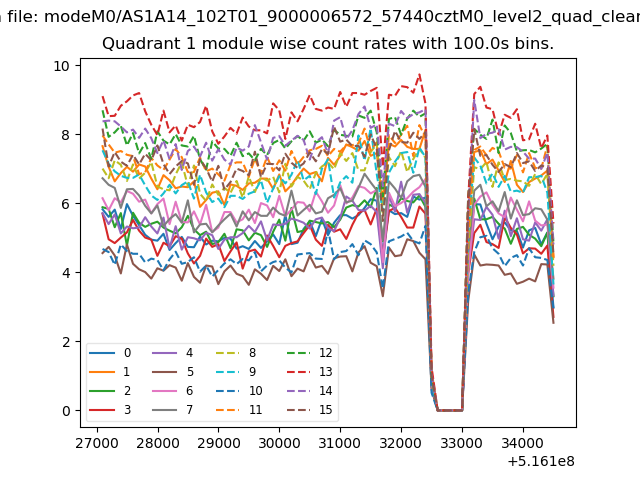
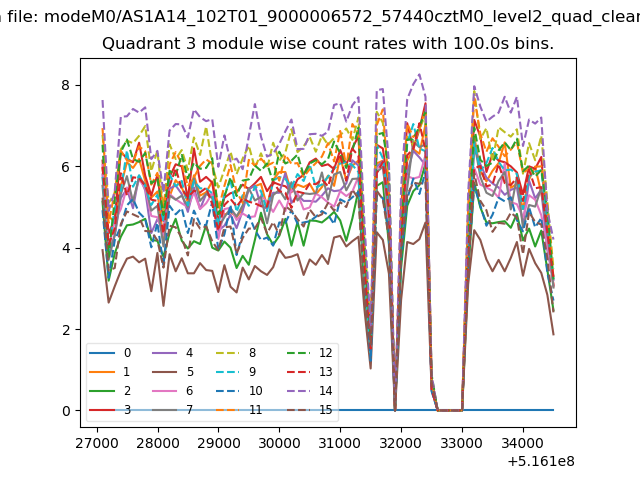
| Module-wise count rates for Quadrant A Data is divided into 100 sec bins |
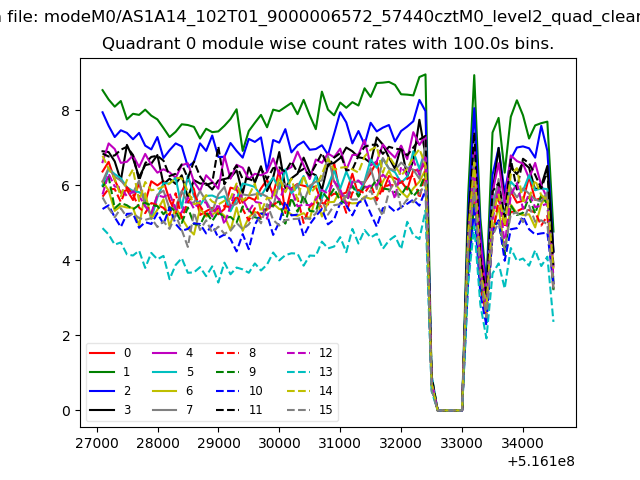 |
 |
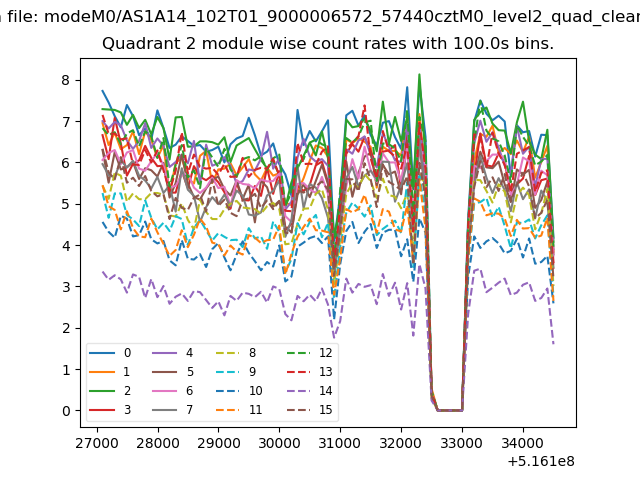
| Module-wise count rates for Quadrant B Data is divided into 100 sec bins |
 |
 |
| Module-wise count rates for Quadrant C Data is divided into 100 sec bins |
 |
 |
| Module-wise count rates for Quadrant D Data is divided into 100 sec bins |
 |
 |
| Parameter | Plot |
|---|---|
| CZT HV Monitor | 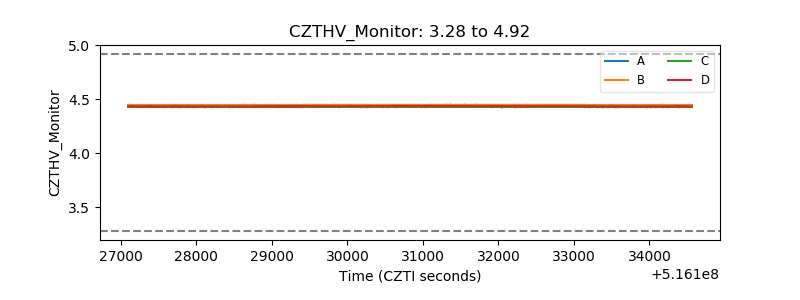 |
| D_VDD | 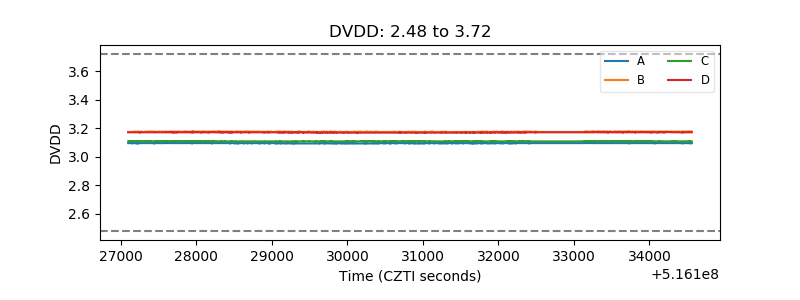 |
| Temperature 1 | 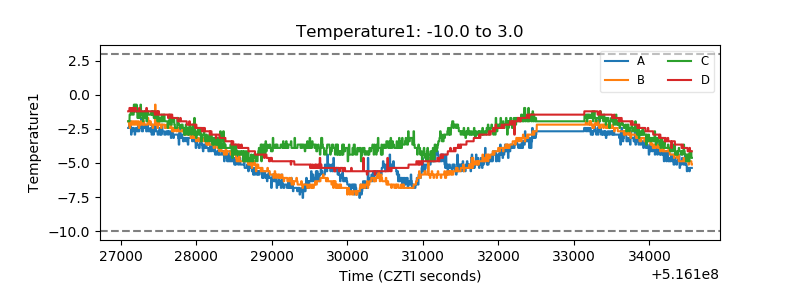 |
| Veto HV Monitor | 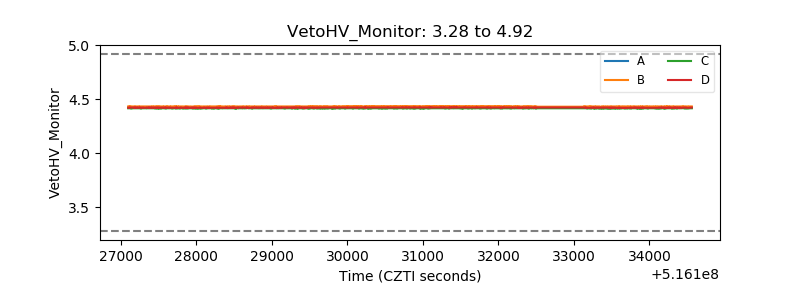 |
| Veto LLD | 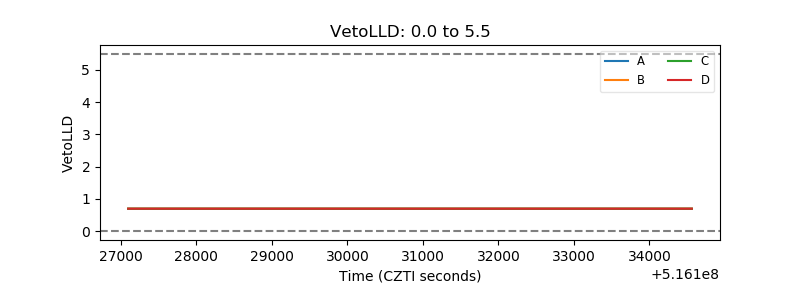 |
| Alpha Counter | 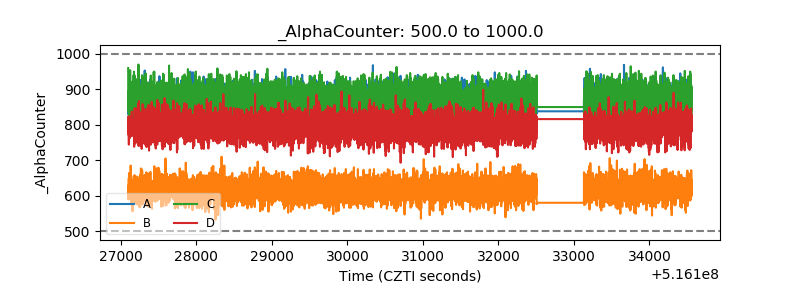 |
| _CPM_Rate | 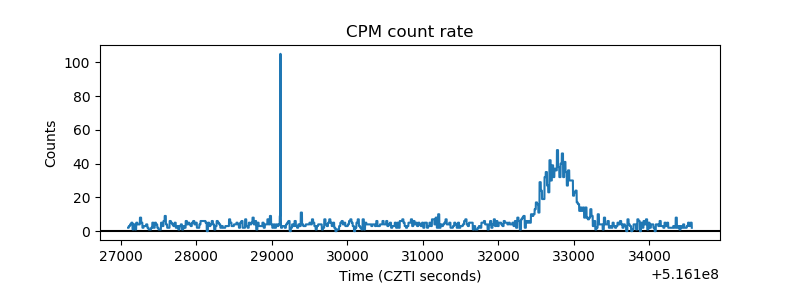 |
| CZT Counter | 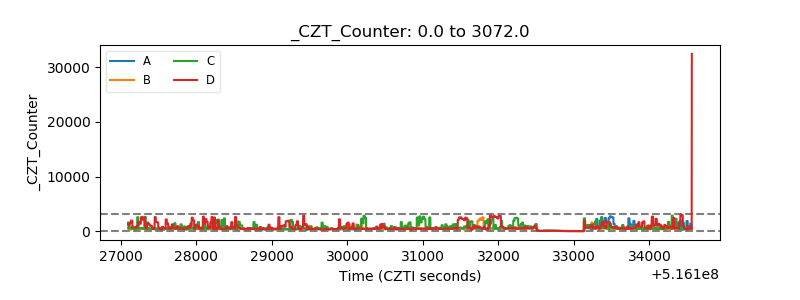 |
| +2.5 Volts monitor | 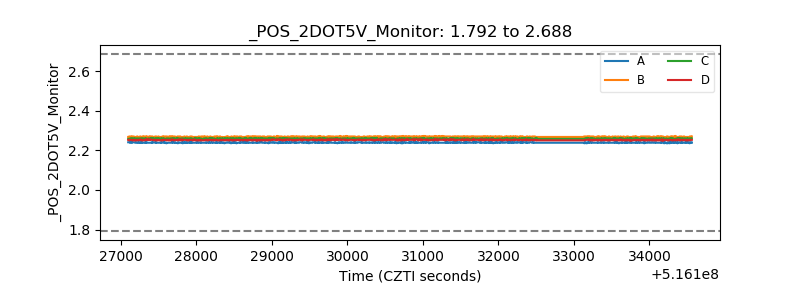 |
| +5 Volts monitor | 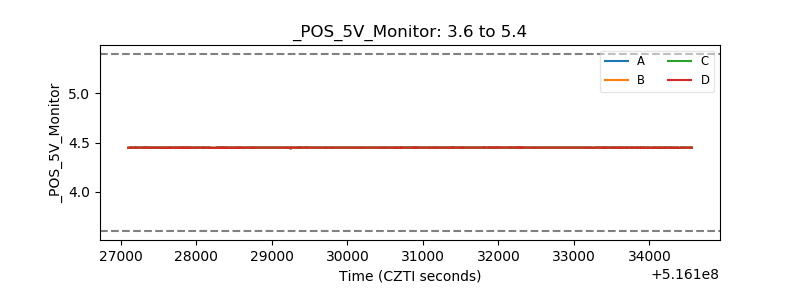 |
| _ROLL_ROT | 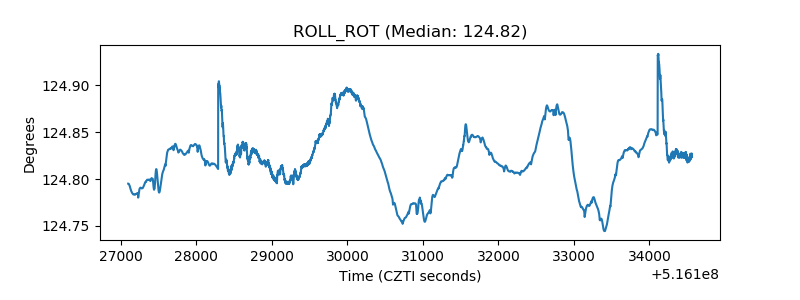 |
| _Roll_DEC | 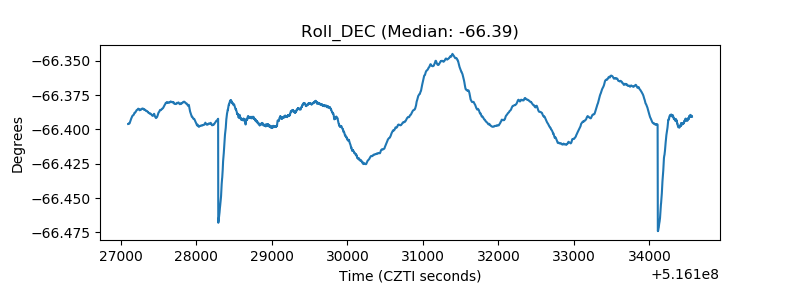 |
| _Roll_RA | 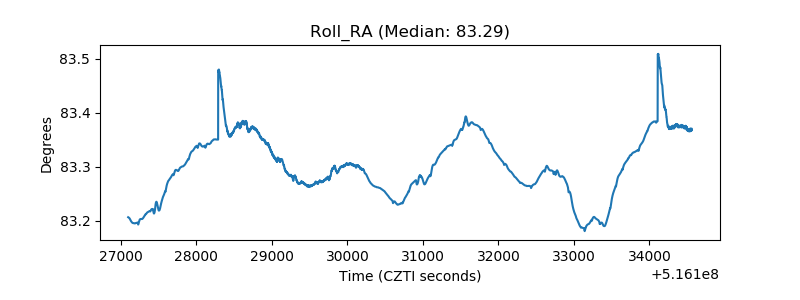 |
| Veto Counter | 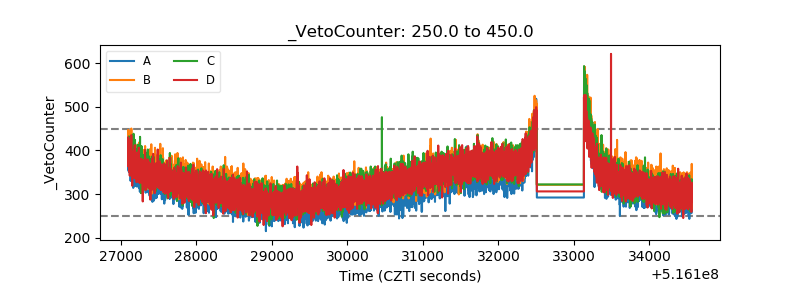 |