| Param | Original file | Final file |
|---|---|---|
| Filename | modeM0/AS1A14_102T01_9000006572_57441cztM0_level2.fits | modeM0/AS1A14_102T01_9000006572_57441cztM0_level2_quad_clean.evt |
| Size (bytes) | 567,679,680 | 106,715,520 |
| Size | 541.4 MB | 101.8 MB |
| Events in quadrant A | 4,206,207 | 702,505 |
| Events in quadrant B | 4,404,283 | 749,939 |
| Events in quadrant C | 6,277,773 | 633,740 |
| Events in quadrant D | 5,533,512 | 614,758 |
| Mode M0 | |||
|---|---|---|---|
| Quadrant | BADHDUFLAG | Total packets | Discarded packets |
| A | 0 | 18223 | 0 |
| B | 0 | 18561 | 0 |
| C | 0 | 24131 | 0 |
| D | 0 | 21792 | 0 |
| Mode SS | |||
|---|---|---|---|
| Quadrant | BADHDUFLAG | Total packets | Discarded packets |
| A | 0 | 152 | 0 |
| B | 0 | 152 | 0 |
| C | 0 | 152 | 0 |
| D | 0 | 152 | 0 |
| Quadrant | Total seconds | Saturated seconds | Saturation percentage |
|---|---|---|---|
| A | 7621 | 311 | 4.080829% |
| B | 7622 | 337 | 4.421412% |
| C | 7622 | 774 | 10.154815% |
| D | 7621 | 488 | 6.403359% |
Noise dominated data is calculated using 1-second bins in cleaned event files. If a bin has >2000 counts, and if more than 50% of those come from <1% of pixels, then it is considered to be noise-dominated and hence unusable.
| Quadrant | # 1 sec bins | Bins with >0 counts | Bins with >2000 counts | High rate bins dominated by noise | Noise dominated (total time) | Noise dominated (detector-on time) | Marked lightcurve |
|---|---|---|---|---|---|---|---|
| A | 7621 | 7621 | 193 | 193 | 2.53% | 2.53% | 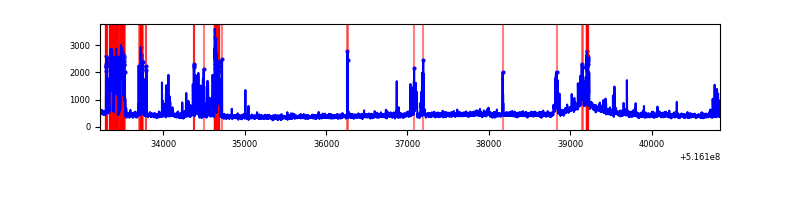 |
| B | 7622 | 7622 | 72 | 72 | 0.94% | 0.94% | 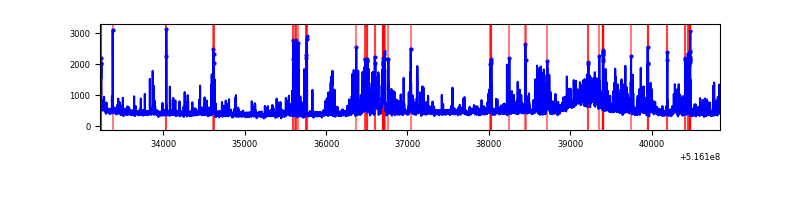 |
| C | 7622 | 7622 | 616 | 616 | 8.08% | 8.08% | 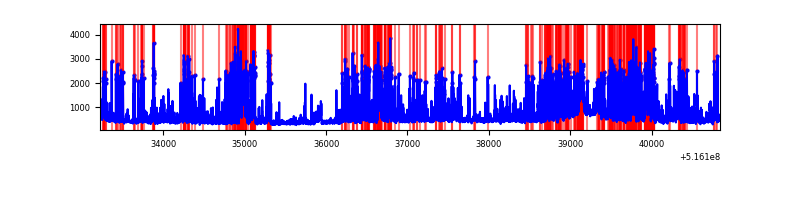 |
| D | 7621 | 7621 | 371 | 371 | 4.87% | 4.87% | 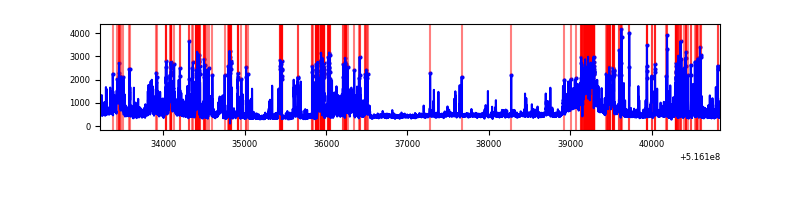 |
Top three noisy pixels from each quadrant. If the there are fewer than three noisy pixels in the level2.evt file, extra rows are filled as -1
| Pixel properties | Quadrant properties | ||||||
|---|---|---|---|---|---|---|---|
| Quadrant | DetID | PixID | Counts | Sigma | Mean | Median | Sigma |
| A | 10 | 251 | 938882 | 4654.27 | 820 | 798 | 201.6 |
| A | 3 | 14 | 55335 | 270.58 | 820 | 798 | 201.6 |
| A | 4 | 3 | 17937 | 85.03 | 820 | 798 | 201.6 |
| B | 4 | 171 | 632784 | 3633.32 | 811 | 779 | 173.9 |
| B | 10 | 247 | 132325 | 756.24 | 811 | 779 | 173.9 |
| B | 7 | 252 | 113628 | 648.75 | 811 | 779 | 173.9 |
| C | 15 | 224 | 3059358 | 14786.19 | 763 | 754 | 206.9 |
| C | 14 | 254 | 78395 | 375.34 | 763 | 754 | 206.9 |
| C | 14 | 67 | 36762 | 174.07 | 763 | 754 | 206.9 |
| D | 2 | 249 | 975921 | 4501.9 | 771 | 736 | 216.6 |
| D | 7 | 96 | 344138 | 1585.3 | 771 | 736 | 216.6 |
| D | 15 | 94 | 337468 | 1554.51 | 771 | 736 | 216.6 |
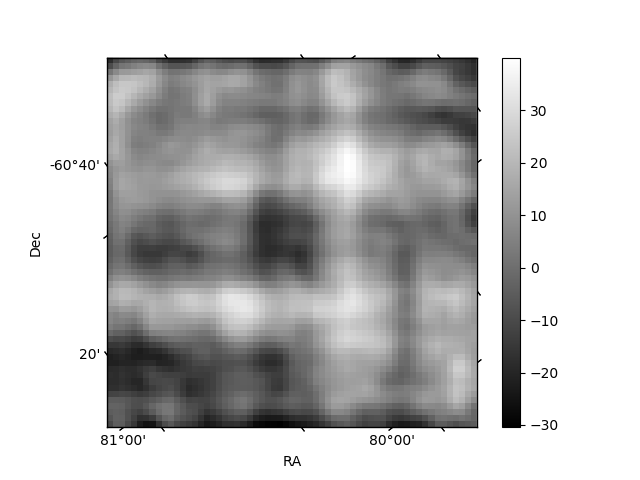
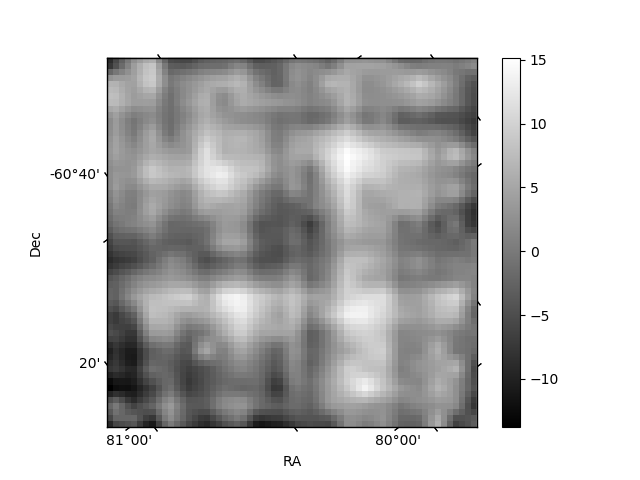
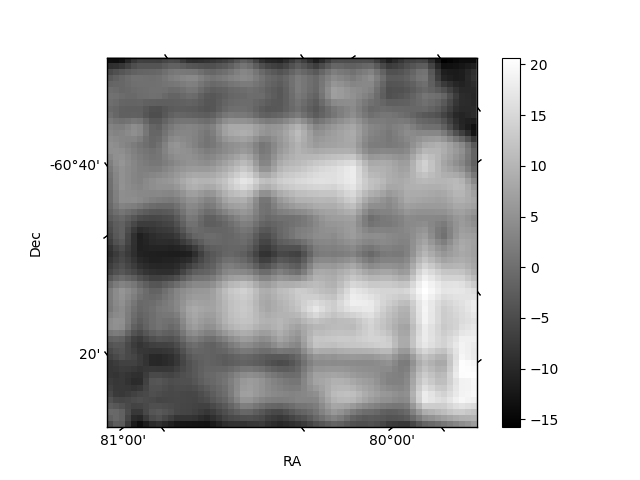
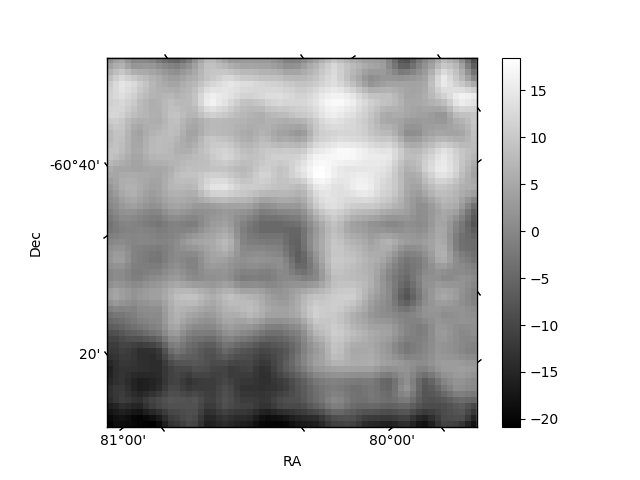
Histogram calculated using DETX and DETY for each event in the final _common_clean file
| Quadrant A | 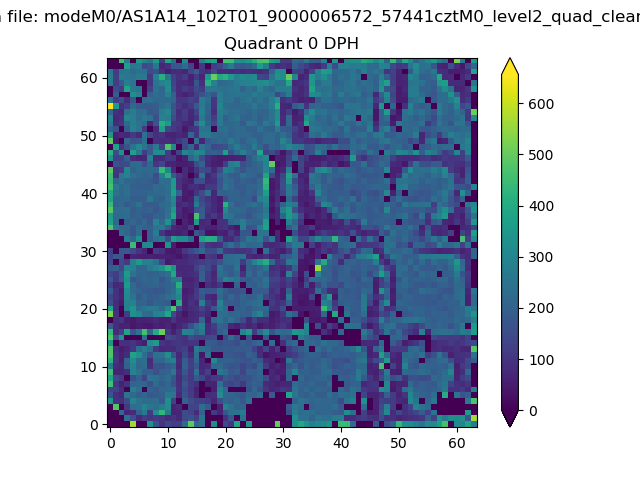 |
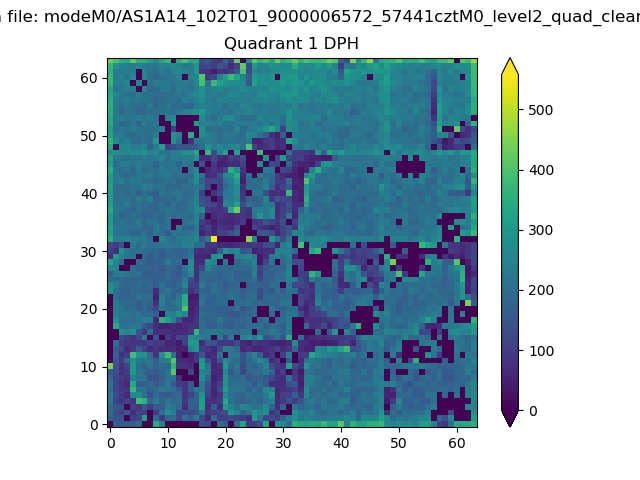 |
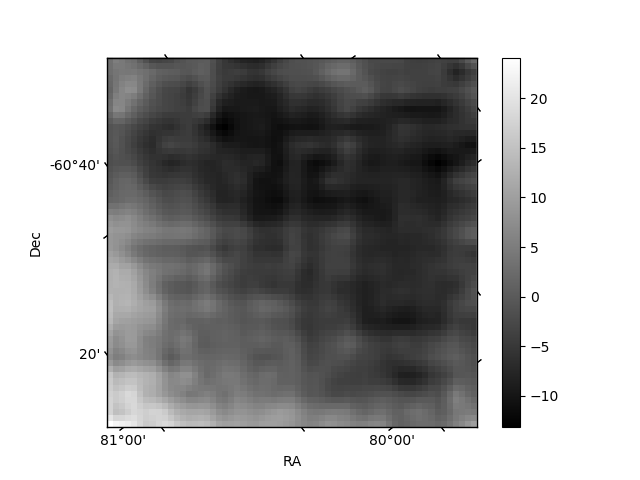
Quadrant B |
|---|---|---|---|
| Quadrant D | 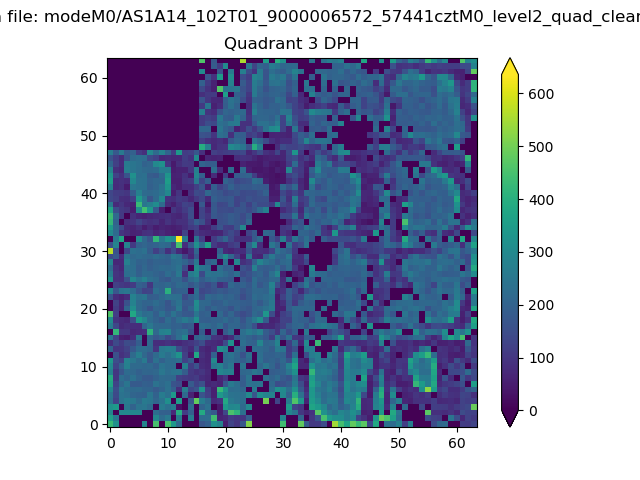 |
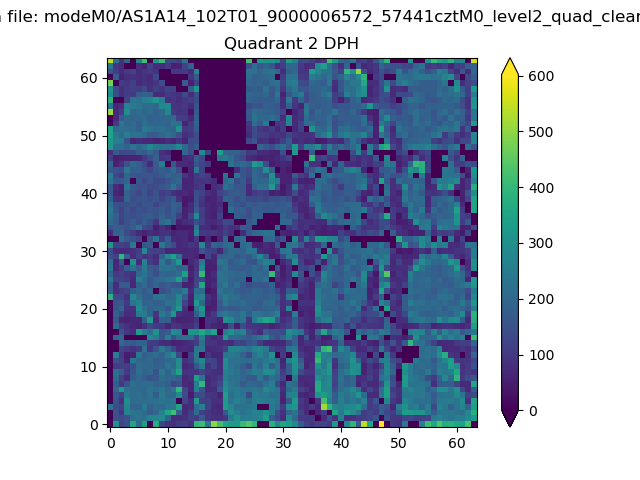 |
Quadrant C |
| Plot type | Count rate plots | Images |
|---|---|---|
| Comparison with Poisson distribution Blue bars denote a histogram of data divided into 1 sec bins. Red curve is a Poisson curve with rate = median count rate of data. |
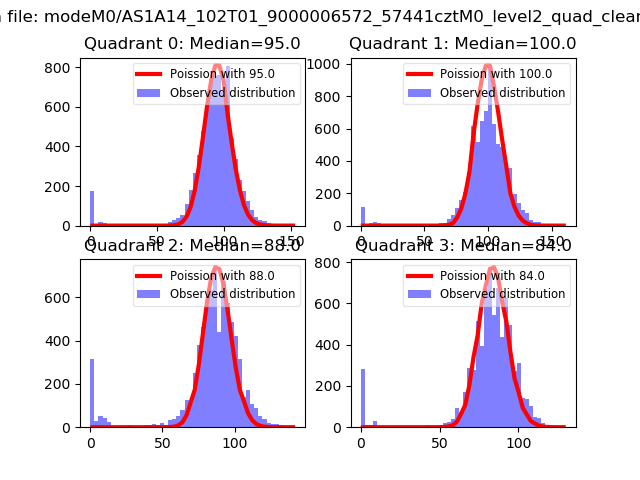 |
 |
| Quadrant-wise count rates Data is divided into 100 sec bins |
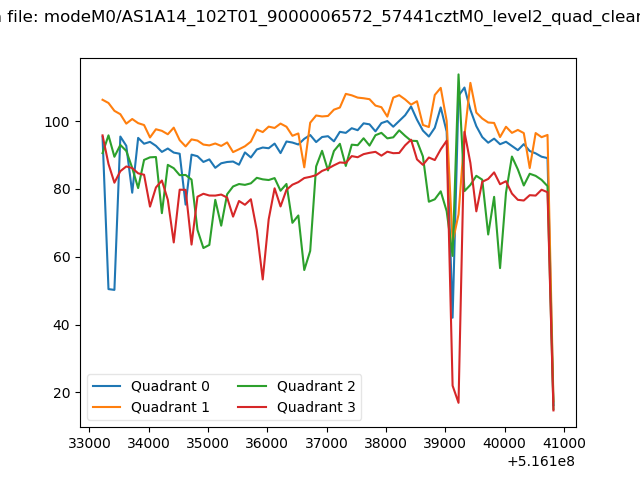 |
|
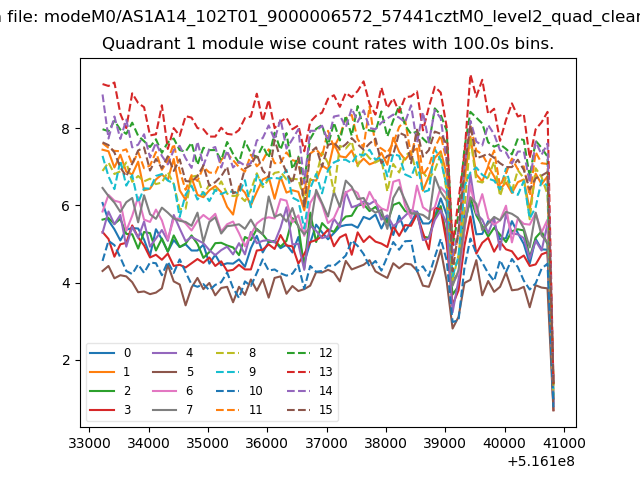
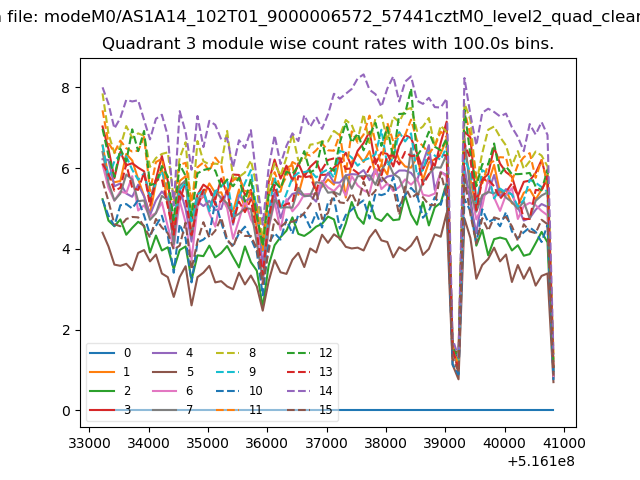
| Module-wise count rates for Quadrant A Data is divided into 100 sec bins |
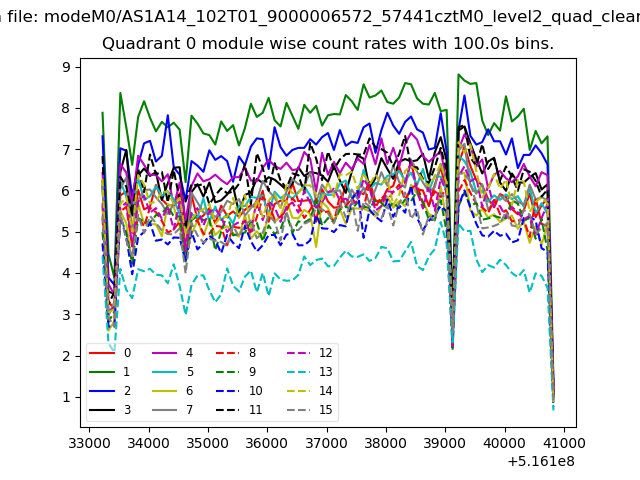 |
 |
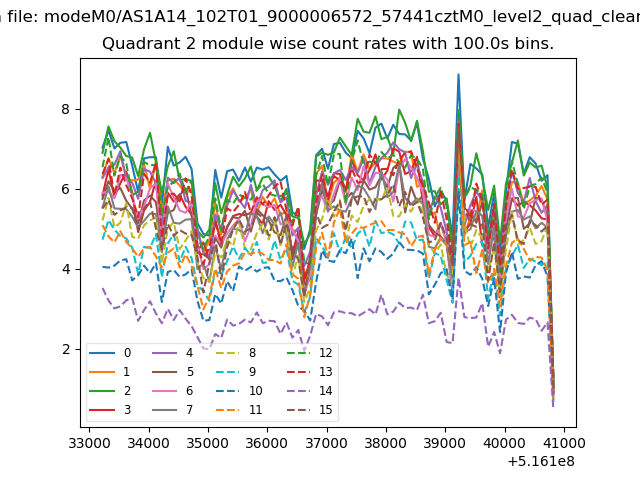
| Module-wise count rates for Quadrant B Data is divided into 100 sec bins |
 |
 |
| Module-wise count rates for Quadrant C Data is divided into 100 sec bins |
 |
 |
| Module-wise count rates for Quadrant D Data is divided into 100 sec bins |
 |
 |
| Parameter | Plot |
|---|---|
| CZT HV Monitor | 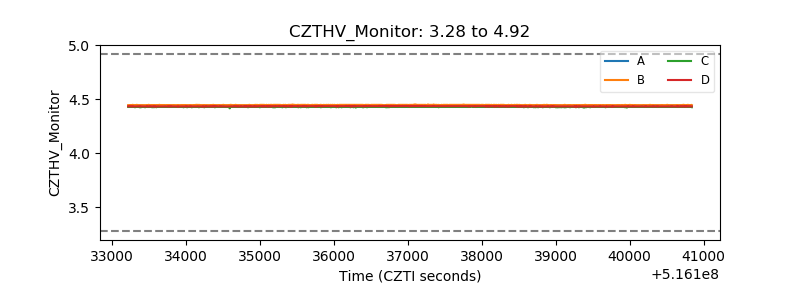 |
| D_VDD | 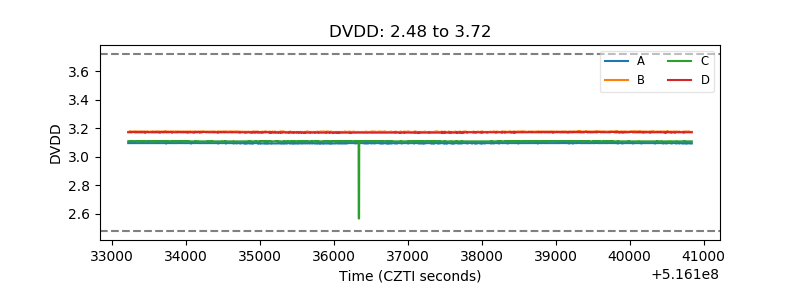 |
| Temperature 1 | 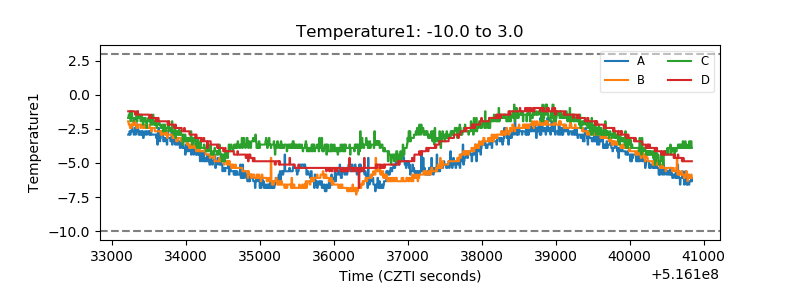 |
| Veto HV Monitor | 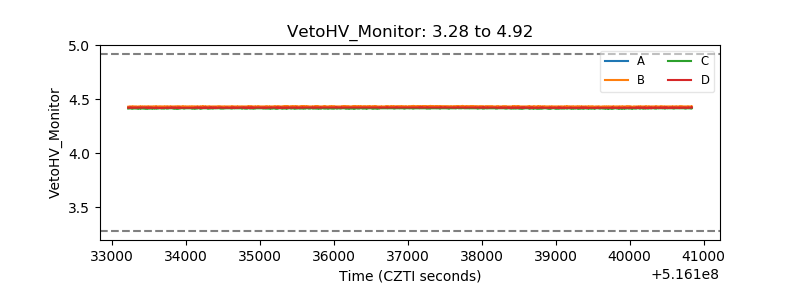 |
| Veto LLD | 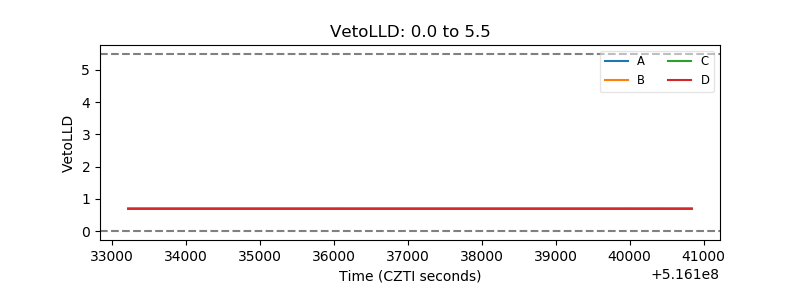 |
| Alpha Counter | 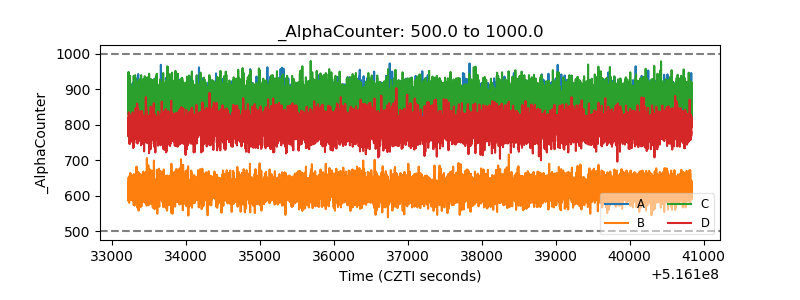 |
| _CPM_Rate | 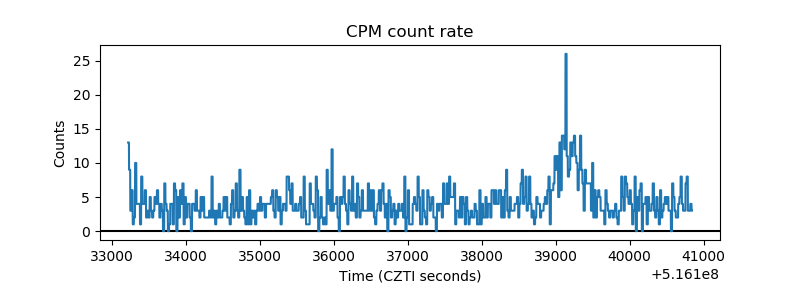 |
| CZT Counter | 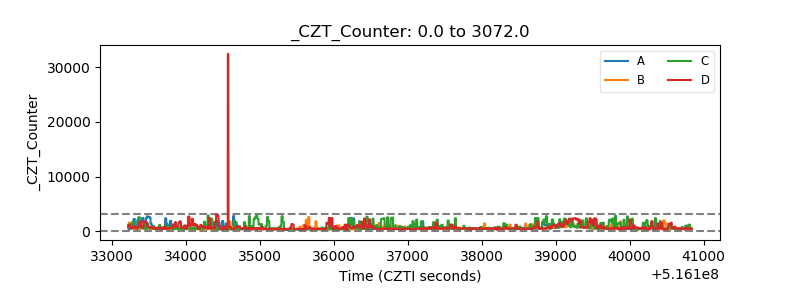 |
| +2.5 Volts monitor |  |
| +5 Volts monitor |  |
| _ROLL_ROT | 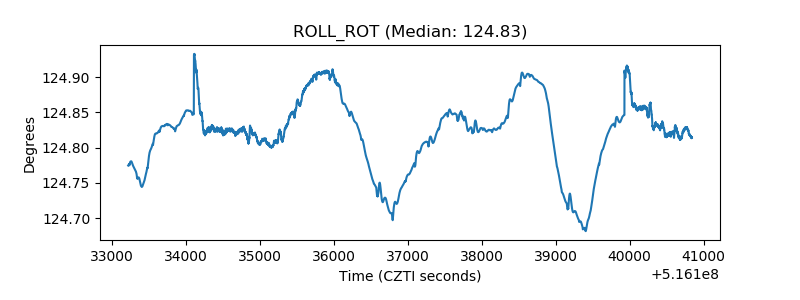 |
| _Roll_DEC | 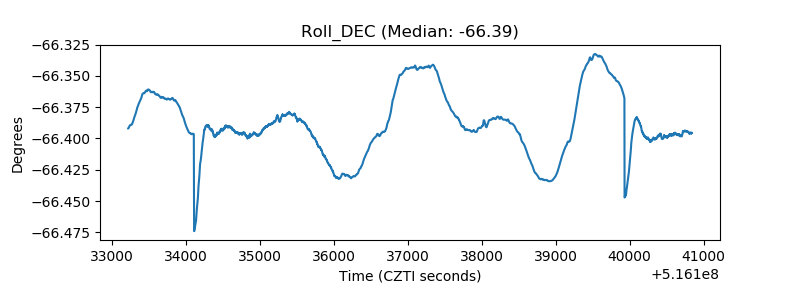 |
| _Roll_RA | 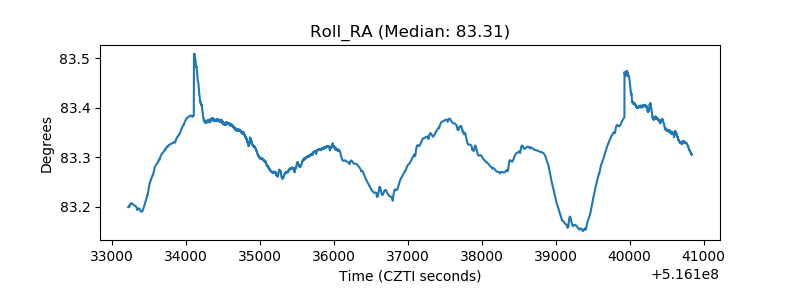 |
| Veto Counter | 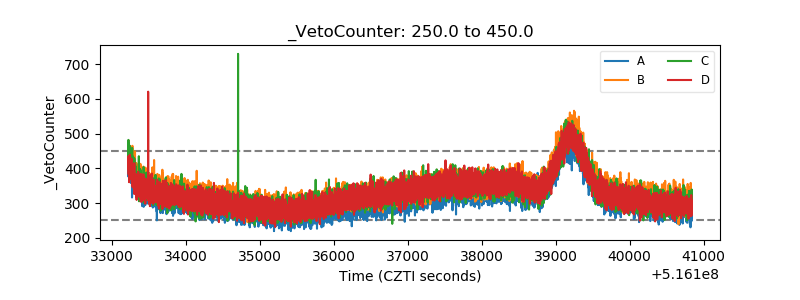 |