| Param | Original file | Final file |
|---|---|---|
| Filename | modeM0/AS1A14_102T01_9000006572_57442cztM0_level2.fits | modeM0/AS1A14_102T01_9000006572_57442cztM0_level2_quad_clean.evt |
| Size (bytes) | 587,528,640 | 102,170,880 |
| Size | 560.3 MB | 97.4 MB |
| Events in quadrant A | 3,679,011 | 677,038 |
| Events in quadrant B | 4,227,131 | 720,836 |
| Events in quadrant C | 6,371,237 | 601,983 |
| Events in quadrant D | 6,850,548 | 537,434 |
| Mode M0 | |||
|---|---|---|---|
| Quadrant | BADHDUFLAG | Total packets | Discarded packets |
| A | 0 | 17044 | 0 |
| B | 0 | 18341 | 0 |
| C | 0 | 24616 | 0 |
| D | 0 | 26043 | 0 |
| Mode SS | |||
|---|---|---|---|
| Quadrant | BADHDUFLAG | Total packets | Discarded packets |
| A | 0 | 160 | 0 |
| B | 0 | 160 | 0 |
| C | 0 | 160 | 0 |
| D | 0 | 160 | 0 |
| Quadrant | Total seconds | Saturated seconds | Saturation percentage |
|---|---|---|---|
| A | 7995 | 119 | 1.488430% |
| B | 7995 | 257 | 3.214509% |
| C | 7995 | 629 | 7.867417% |
| D | 7995 | 819 | 10.243902% |
Noise dominated data is calculated using 1-second bins in cleaned event files. If a bin has >2000 counts, and if more than 50% of those come from <1% of pixels, then it is considered to be noise-dominated and hence unusable.
| Quadrant | # 1 sec bins | Bins with >0 counts | Bins with >2000 counts | High rate bins dominated by noise | Noise dominated (total time) | Noise dominated (detector-on time) | Marked lightcurve |
|---|---|---|---|---|---|---|---|
| A | 8270 | 8270 | 22 | 22 | 0.27% | 0.27% | 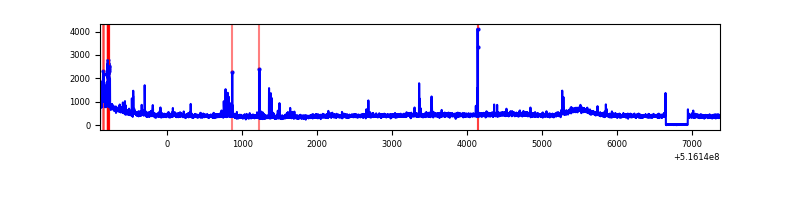 |
| B | 8270 | 8270 | 44 | 44 | 0.53% | 0.53% | 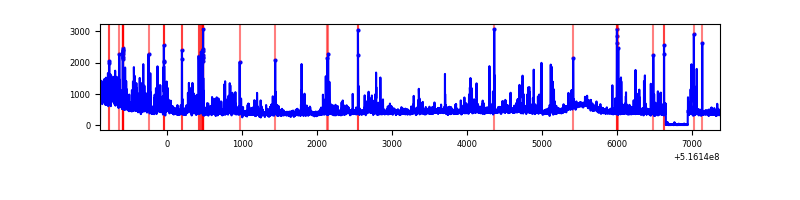 |
| C | 8270 | 8270 | 508 | 508 | 6.14% | 6.14% | 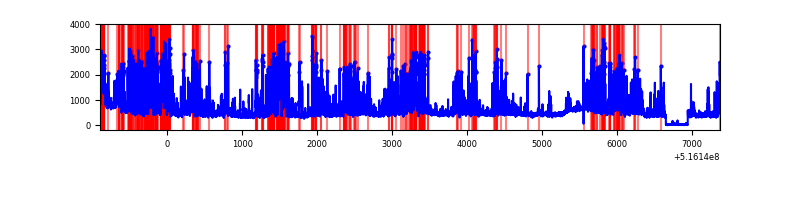 |
| D | 8270 | 8270 | 740 | 740 | 8.95% | 8.95% | 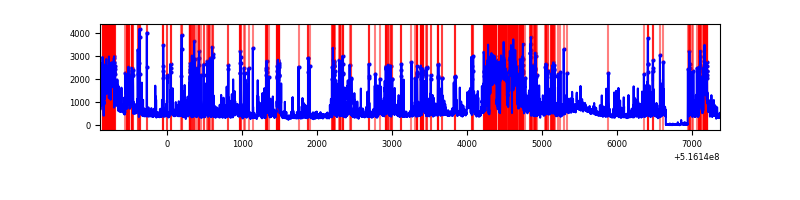 |
Top three noisy pixels from each quadrant. If the there are fewer than three noisy pixels in the level2.evt file, extra rows are filled as -1
| Pixel properties | Quadrant properties | ||||||
|---|---|---|---|---|---|---|---|
| Quadrant | DetID | PixID | Counts | Sigma | Mean | Median | Sigma |
| A | 10 | 251 | 211422 | 985.54 | 872 | 848 | 213.7 |
| A | 3 | 14 | 45289 | 207.99 | 872 | 848 | 213.7 |
| A | 7 | 64 | 23267 | 104.92 | 872 | 848 | 213.7 |
| B | 4 | 171 | 428311 | 2318.56 | 860 | 827 | 184.4 |
| B | 10 | 247 | 110199 | 593.2 | 860 | 827 | 184.4 |
| B | 7 | 252 | 88731 | 476.77 | 860 | 827 | 184.4 |
| C | 15 | 224 | 2985664 | 13450.12 | 818 | 809 | 221.9 |
| C | 1 | 16 | 45065 | 199.42 | 818 | 809 | 221.9 |
| C | 14 | 67 | 37079 | 163.44 | 818 | 809 | 221.9 |
| D | 15 | 142 | 1228577 | 5466.85 | 799 | 761 | 224.6 |
| D | 2 | 249 | 939212 | 4178.45 | 799 | 761 | 224.6 |
| D | 3 | 12 | 664066 | 2953.36 | 799 | 761 | 224.6 |
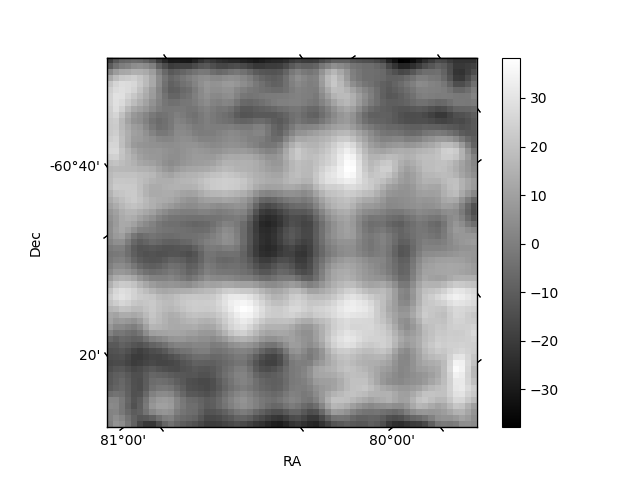
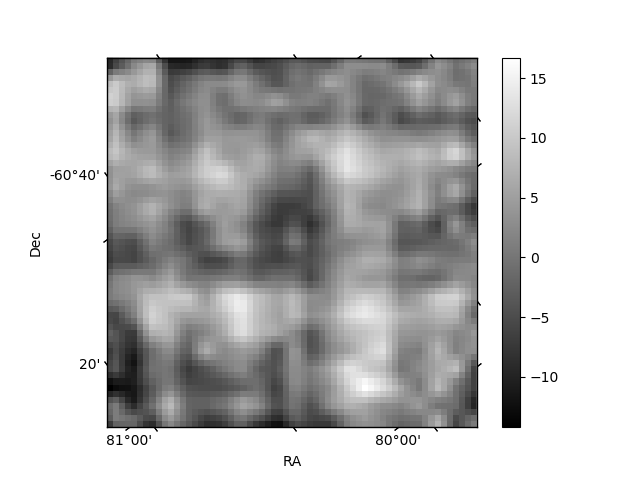
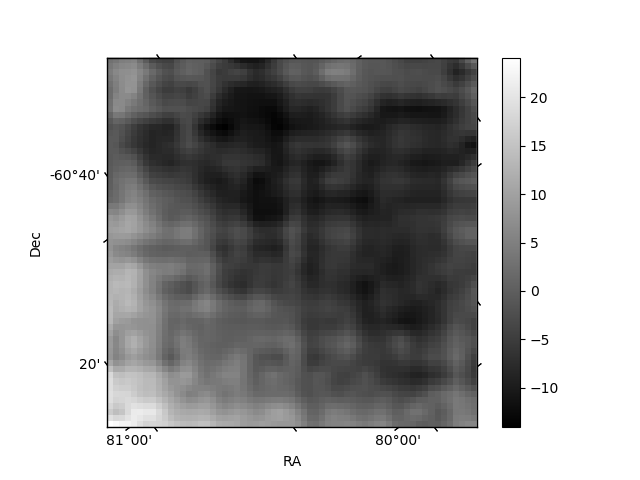
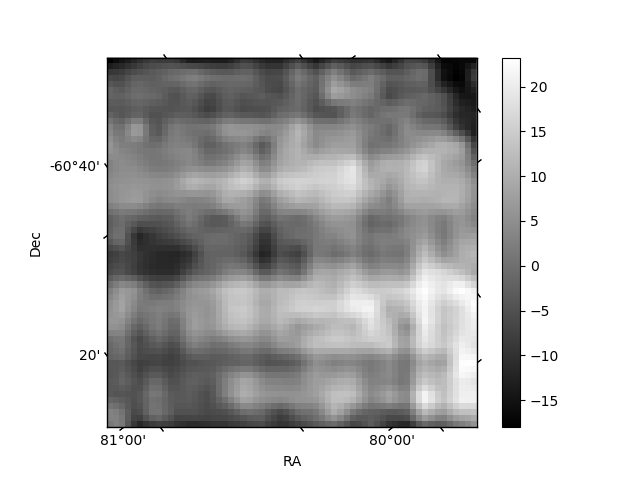
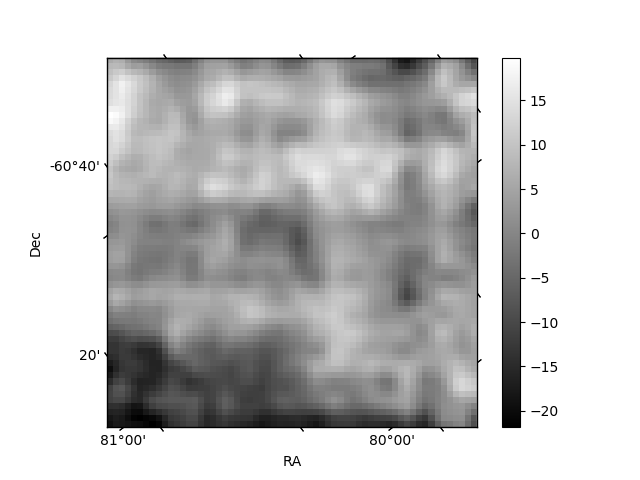
Histogram calculated using DETX and DETY for each event in the final _common_clean file
| Quadrant A | 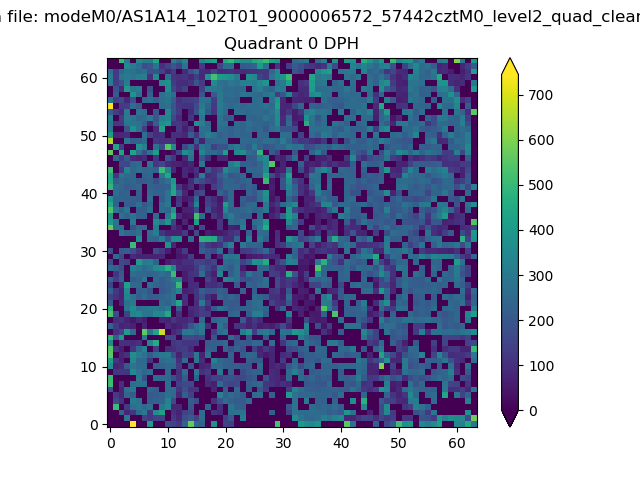 |
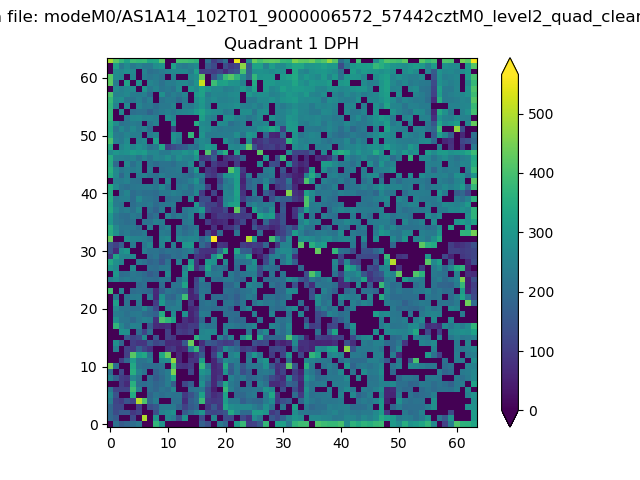 |
Quadrant B |
|---|---|---|---|
| Quadrant D | 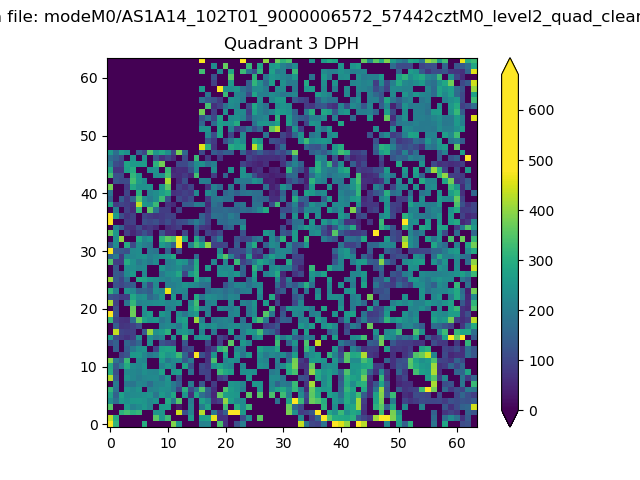 |
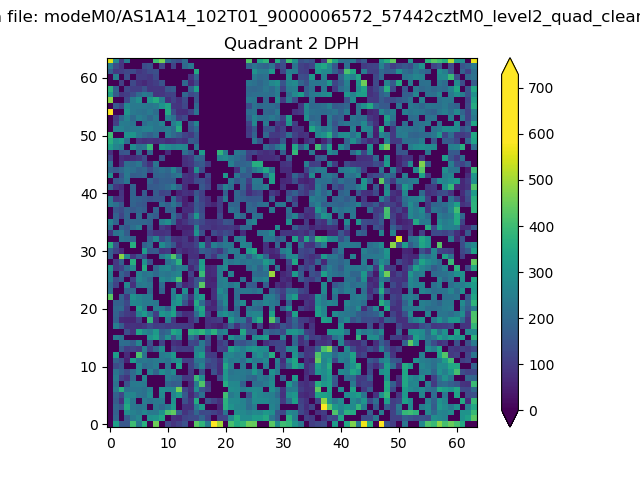 |
Quadrant C |
| Plot type | Count rate plots | Images |
|---|---|---|
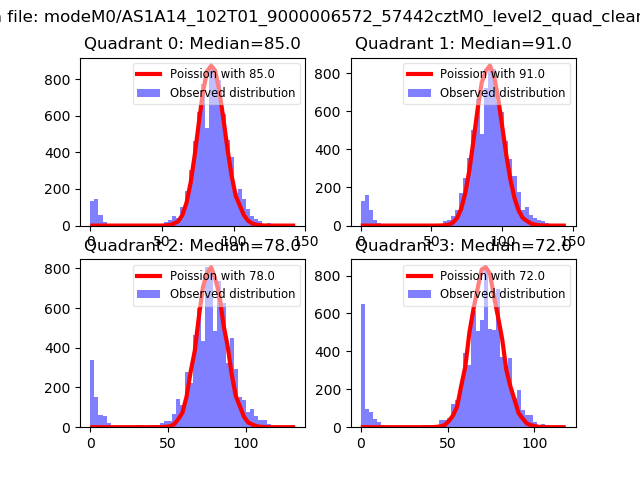
| Comparison with Poisson distribution Blue bars denote a histogram of data divided into 1 sec bins. Red curve is a Poisson curve with rate = median count rate of data. |
 |
 |
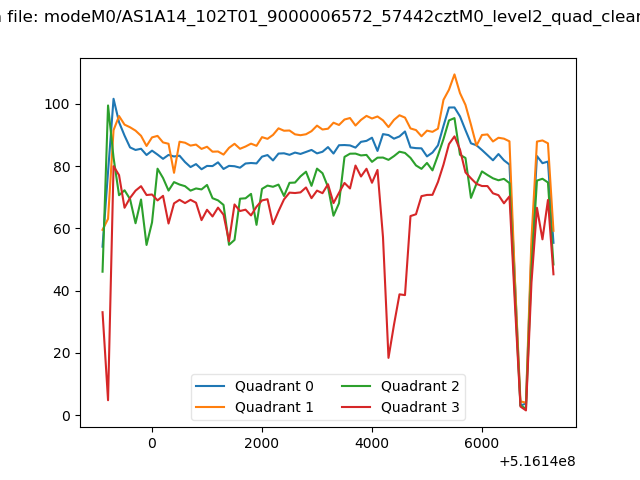
| Quadrant-wise count rates Data is divided into 100 sec bins |
 |
|
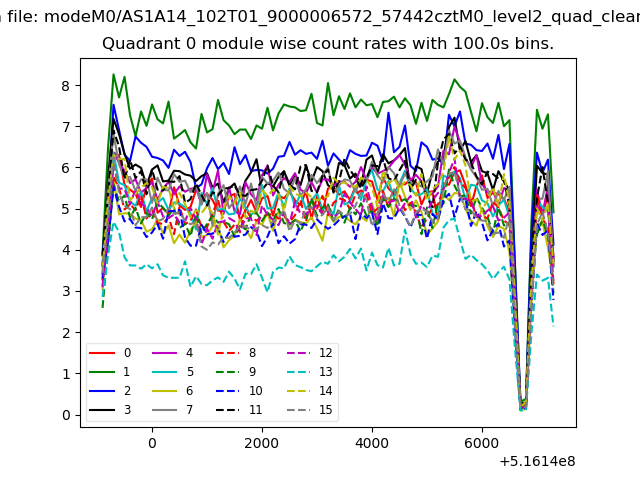
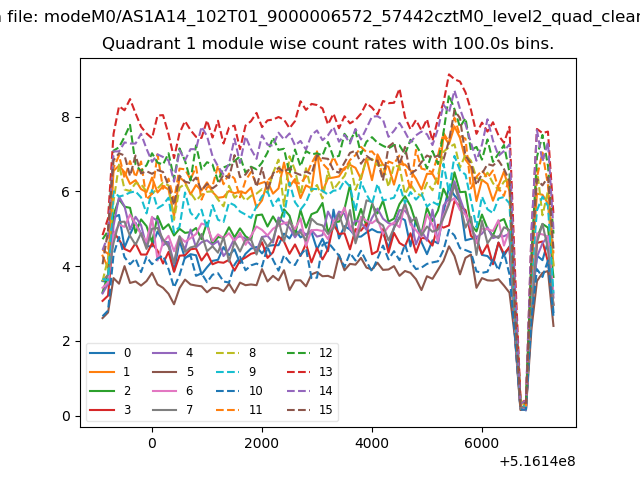
| Module-wise count rates for Quadrant A Data is divided into 100 sec bins |
 |
 |
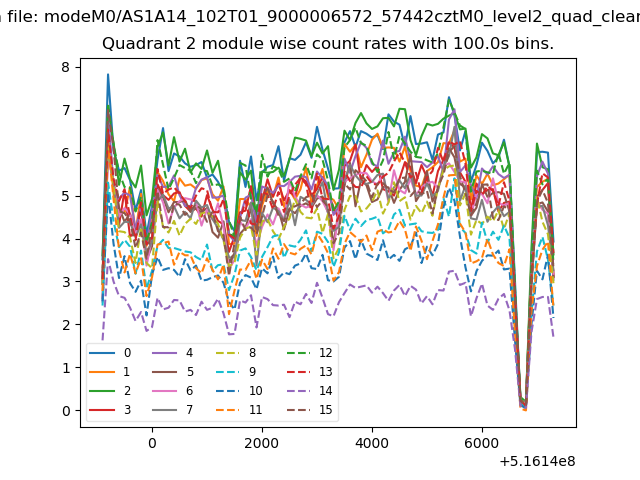
| Module-wise count rates for Quadrant B Data is divided into 100 sec bins |
 |
 |
| Module-wise count rates for Quadrant C Data is divided into 100 sec bins |
 |
 |
| Module-wise count rates for Quadrant D Data is divided into 100 sec bins |
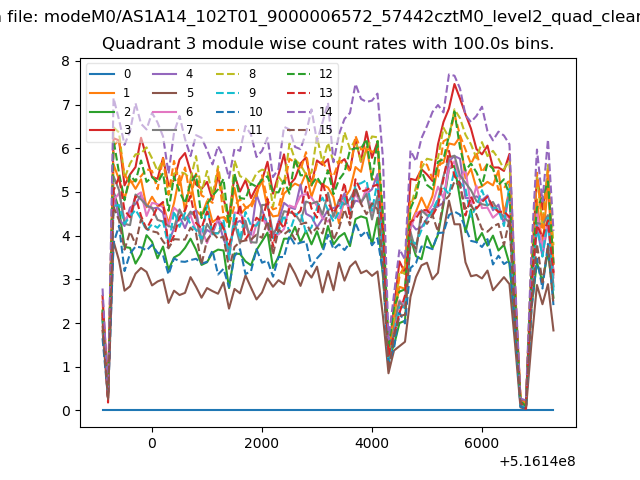 |
 |
| Parameter | Plot |
|---|---|
| CZT HV Monitor | 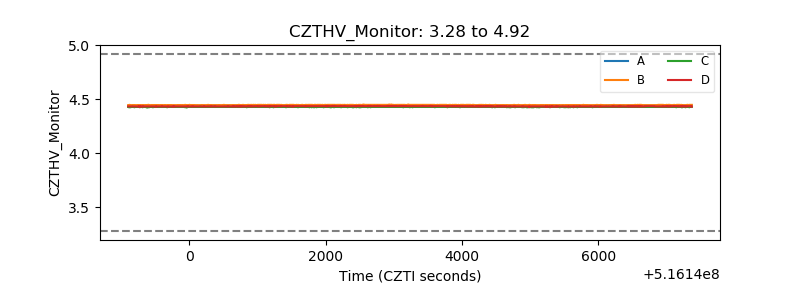 |
| D_VDD | 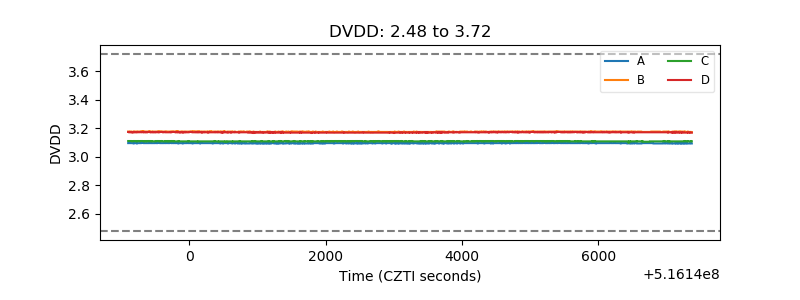 |
| Temperature 1 | 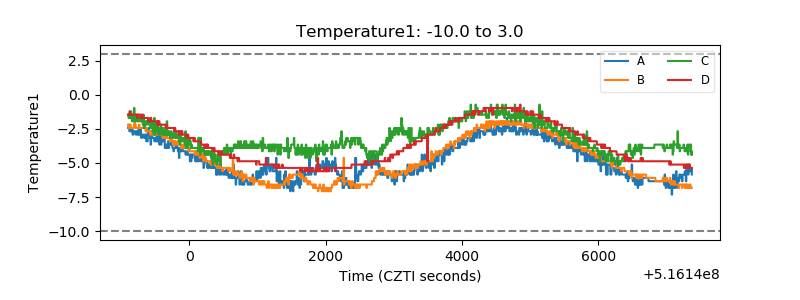 |
| Veto HV Monitor | 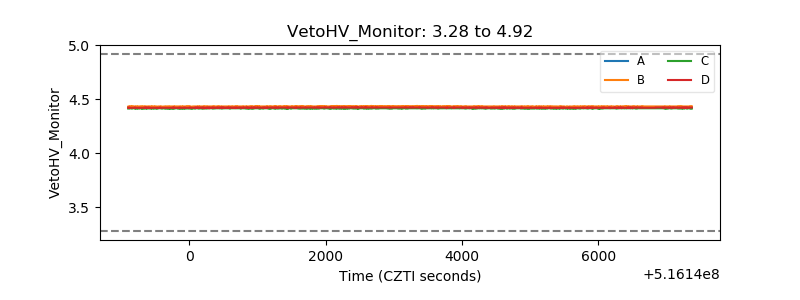 |
| Veto LLD | 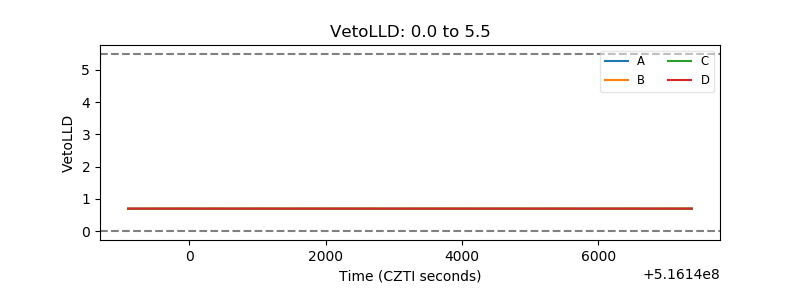 |
| Alpha Counter |  |
| _CPM_Rate | 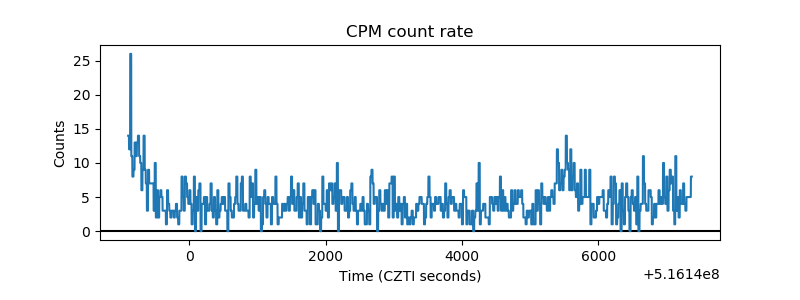 |
| CZT Counter | 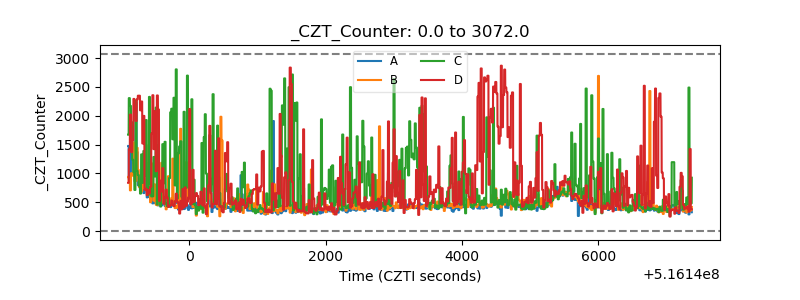 |
| +2.5 Volts monitor | 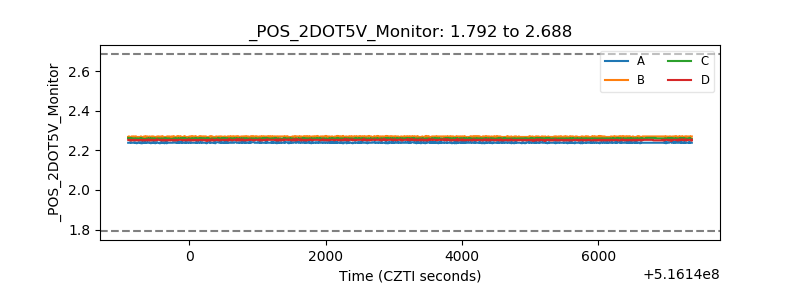 |
| +5 Volts monitor |  |
| _ROLL_ROT | 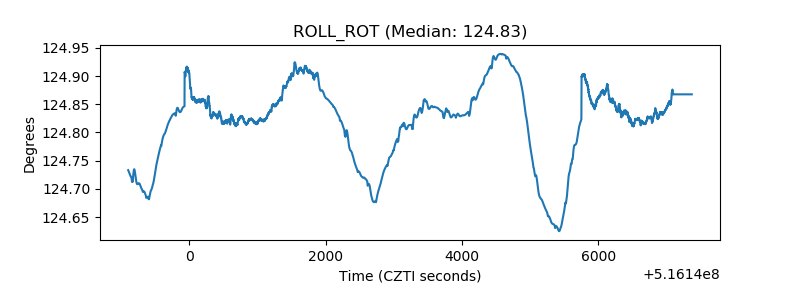 |
| _Roll_DEC | 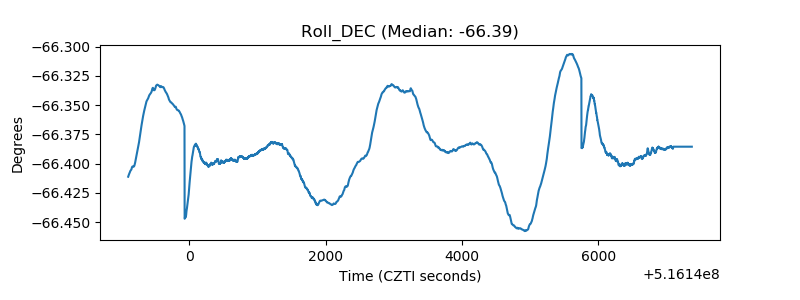 |
| _Roll_RA | 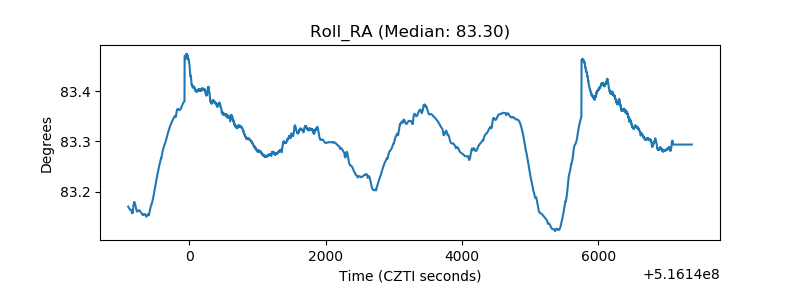 |
| Veto Counter | 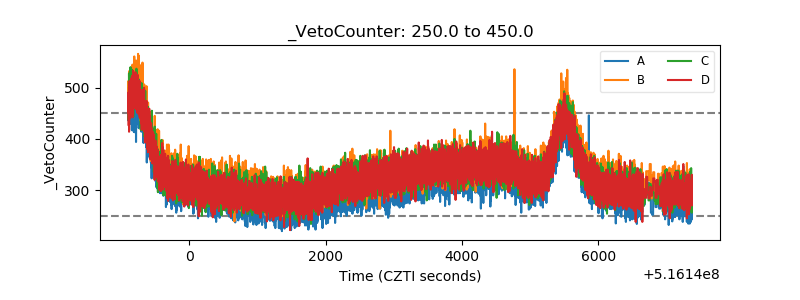 |