| Param | Original file | Final file |
|---|---|---|
| Filename | modeM0/AS1A14_102T01_9000006572_57446cztM0_level2.fits | modeM0/AS1A14_102T01_9000006572_57446cztM0_level2_quad_clean.evt |
| Size (bytes) | 1,584,184,320 | 303,384,960 |
| Size | 1.5 GB | 289.3 MB |
| Events in quadrant A | 9,627,764 | 2,039,696 |
| Events in quadrant B | 13,110,839 | 2,073,044 |
| Events in quadrant C | 18,217,793 | 1,793,177 |
| Events in quadrant D | 15,973,724 | 1,755,841 |
| Mode M0 | |||
|---|---|---|---|
| Quadrant | BADHDUFLAG | Total packets | Discarded packets |
| A | 0 | 45653 | 4 |
| B | 0 | 55218 | 4 |
| C | 0 | 69382 | 4 |
| D | 0 | 63172 | 4 |
| Mode M9 | |||
|---|---|---|---|
| Quadrant | BADHDUFLAG | Total packets | Discarded packets |
| A | 0 | 8 | 0 |
| B | 0 | 8 | 0 |
| C | 0 | 8 | 0 |
| D | 0 | 8 | 0 |
| Mode SS | |||
|---|---|---|---|
| Quadrant | BADHDUFLAG | Total packets | Discarded packets |
| A | 0 | 450 | 0 |
| B | 0 | 450 | 0 |
| C | 0 | 450 | 0 |
| D | 0 | 450 | 0 |
| Quadrant | Total seconds | Saturated seconds | Saturation percentage |
|---|---|---|---|
| A | 22117 | 179 | 0.809332% |
| B | 22117 | 1520 | 6.872541% |
| C | 22117 | 2177 | 9.843107% |
| D | 22117 | 1296 | 5.859746% |
Noise dominated data is calculated using 1-second bins in cleaned event files. If a bin has >2000 counts, and if more than 50% of those come from <1% of pixels, then it is considered to be noise-dominated and hence unusable.
| Quadrant | # 1 sec bins | Bins with >0 counts | Bins with >2000 counts | High rate bins dominated by noise | Noise dominated (total time) | Noise dominated (detector-on time) | Marked lightcurve |
|---|---|---|---|---|---|---|---|
| A | 23324 | 22404 | 5 | 5 | 0.02% | 0.02% | 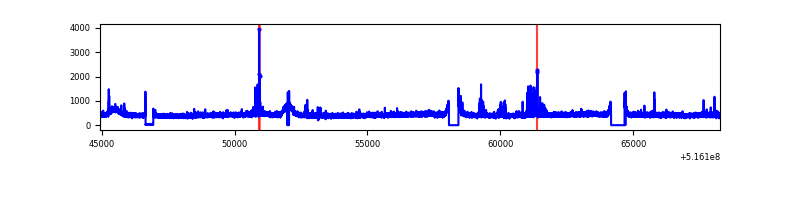 |
| B | 23324 | 22404 | 674 | 674 | 2.89% | 3.01% | 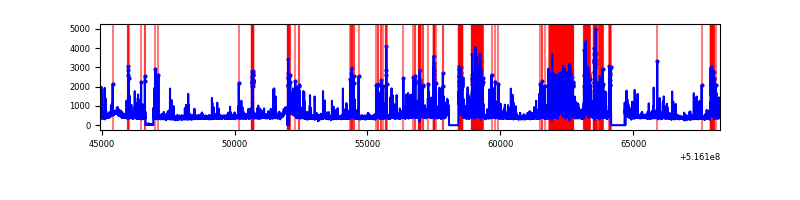 |
| C | 23324 | 22404 | 1645 | 1645 | 7.05% | 7.34% | 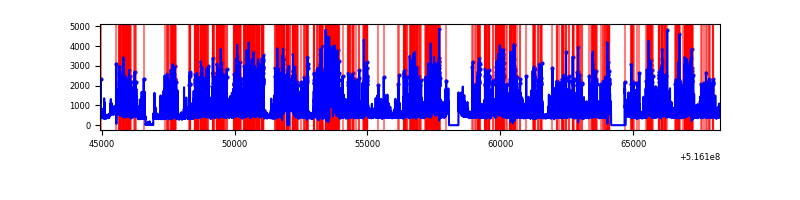 |
| D | 23324 | 22404 | 1085 | 1085 | 4.65% | 4.84% | 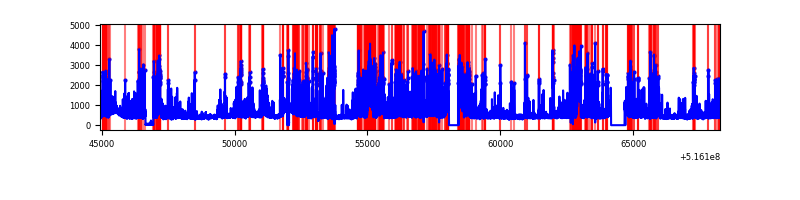 |
Top three noisy pixels from each quadrant. If the there are fewer than three noisy pixels in the level2.evt file, extra rows are filled as -1
| Pixel properties | Quadrant properties | ||||||
|---|---|---|---|---|---|---|---|
| Quadrant | DetID | PixID | Counts | Sigma | Mean | Median | Sigma |
| A | 2 | 79 | 153862 | 260.38 | 2391 | 2336 | 581.9 |
| A | 3 | 14 | 112948 | 190.07 | 2391 | 2336 | 581.9 |
| A | 7 | 64 | 48007 | 78.48 | 2391 | 2336 | 581.9 |
| B | 4 | 206 | 2185039 | 4460.04 | 2296 | 2204 | 489.4 |
| B | 5 | 185 | 841622 | 1715.13 | 2296 | 2204 | 489.4 |
| B | 10 | 247 | 283876 | 575.52 | 2296 | 2204 | 489.4 |
| C | 15 | 224 | 8514365 | 14217.12 | 2228 | 2204 | 598.7 |
| C | 1 | 16 | 456741 | 759.17 | 2228 | 2204 | 598.7 |
| C | 13 | 3 | 139346 | 229.06 | 2228 | 2204 | 598.7 |
| D | 15 | 142 | 2345188 | 3740.78 | 2259 | 2155 | 626.3 |
| D | 8 | 240 | 1556881 | 2482.2 | 2259 | 2155 | 626.3 |
| D | 2 | 249 | 856449 | 1363.93 | 2259 | 2155 | 626.3 |
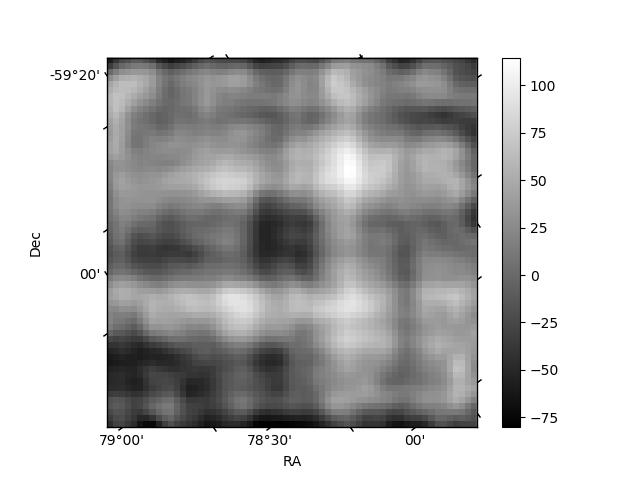
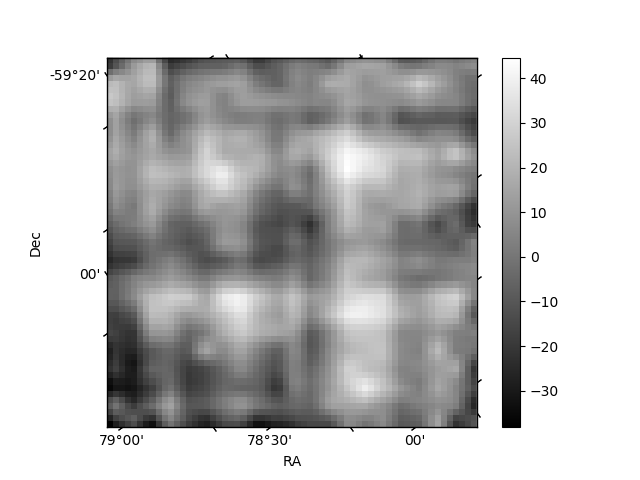
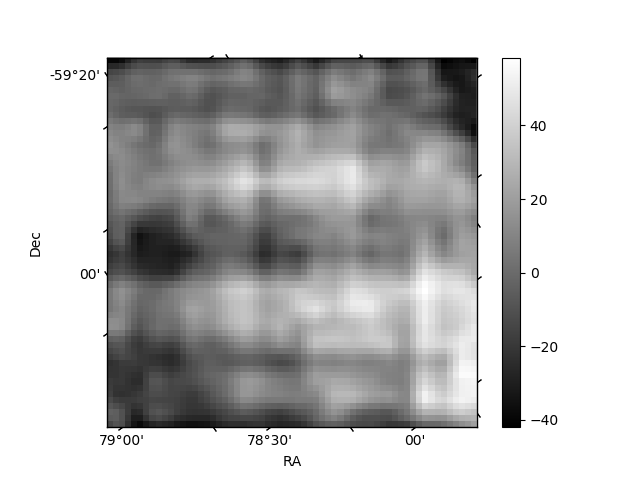
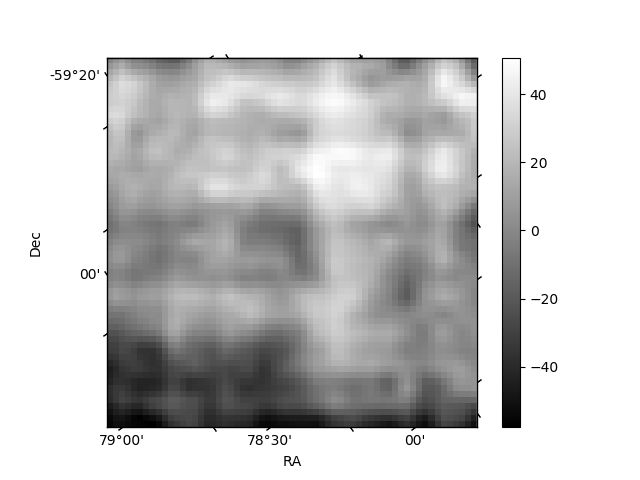
Histogram calculated using DETX and DETY for each event in the final _common_clean file
| Quadrant A | 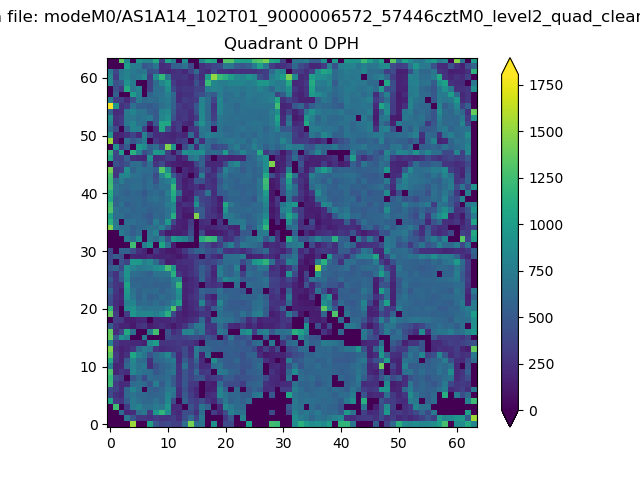 |
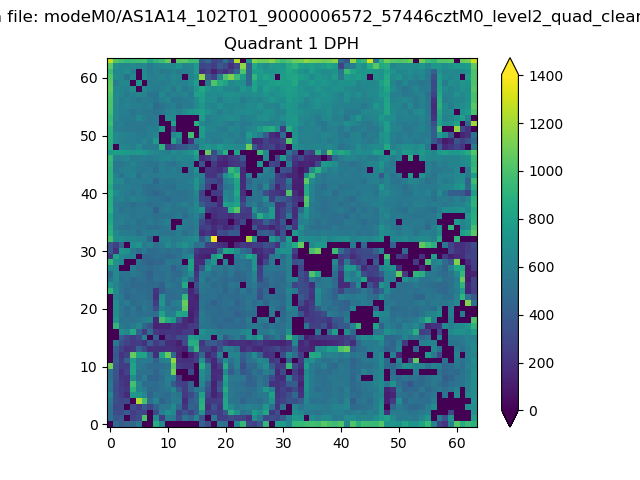 |
Quadrant B |
|---|---|---|---|
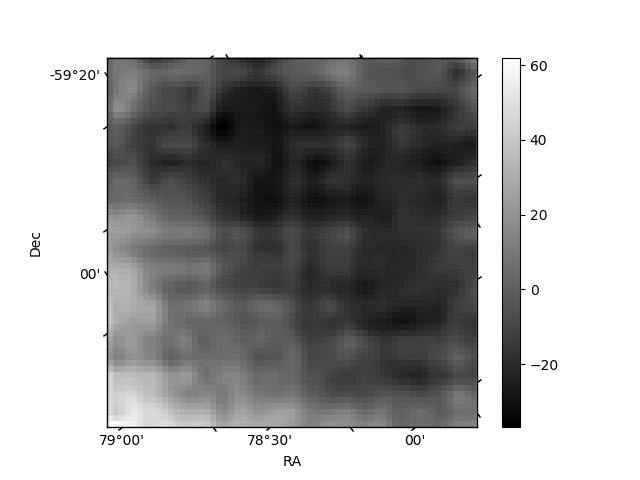
| Quadrant D | 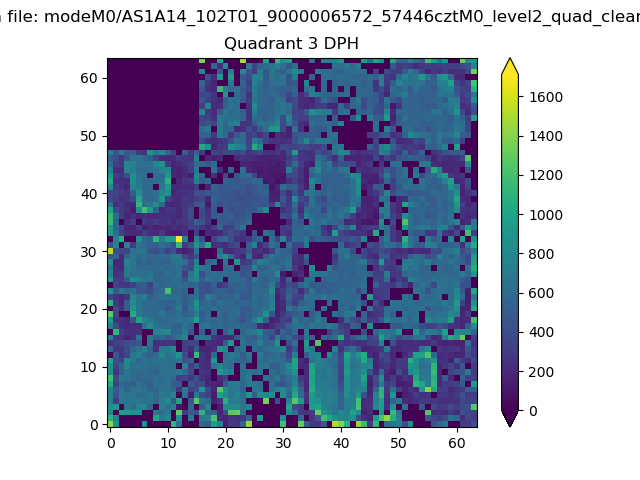 |
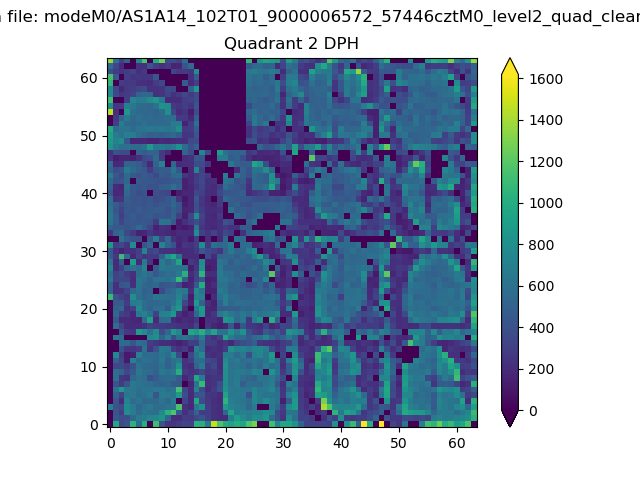 |
Quadrant C |
| Plot type | Count rate plots | Images |
|---|---|---|
| Comparison with Poisson distribution Blue bars denote a histogram of data divided into 1 sec bins. Red curve is a Poisson curve with rate = median count rate of data. |
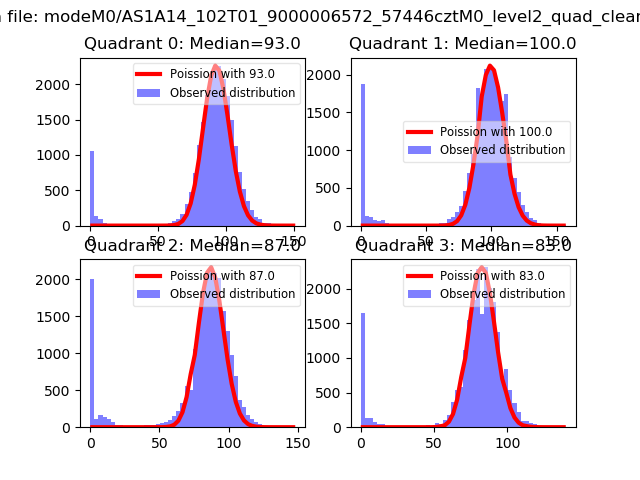 |
 |
| Quadrant-wise count rates Data is divided into 100 sec bins |
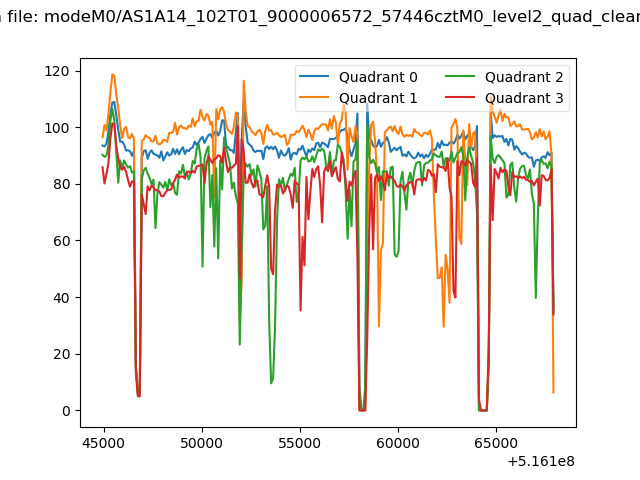 |
|
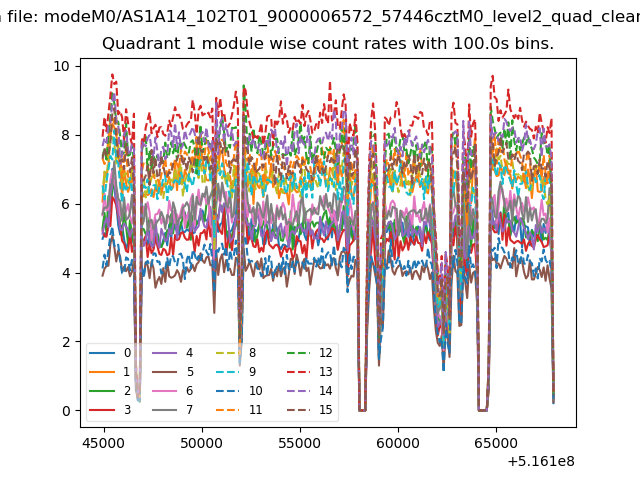
| Module-wise count rates for Quadrant A Data is divided into 100 sec bins |
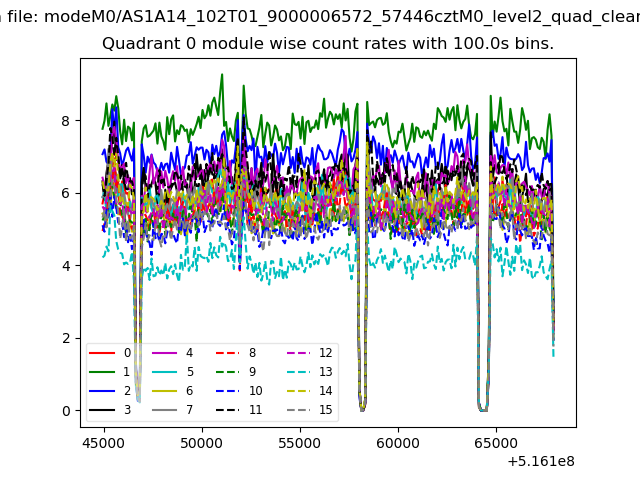 |
 |
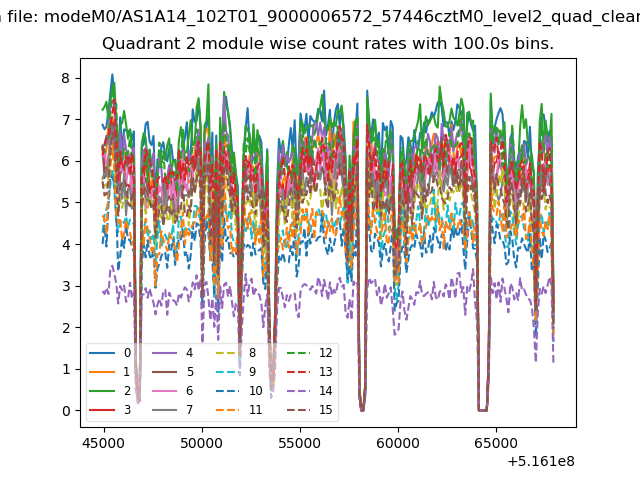
| Module-wise count rates for Quadrant B Data is divided into 100 sec bins |
 |
 |
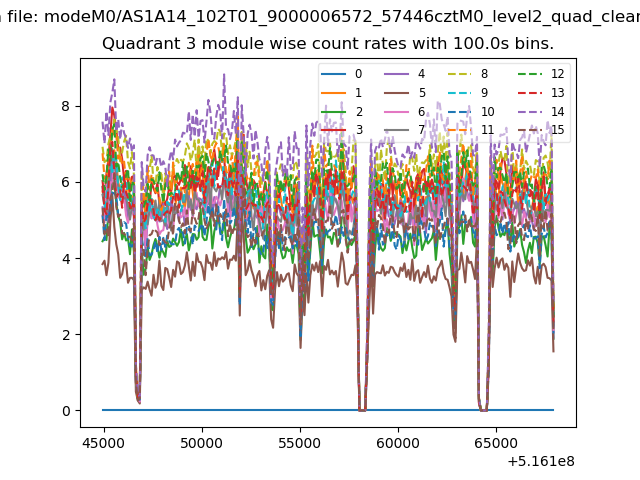
| Module-wise count rates for Quadrant C Data is divided into 100 sec bins |
 |
 |
| Module-wise count rates for Quadrant D Data is divided into 100 sec bins |
 |
 |
| Parameter | Plot |
|---|---|
| CZT HV Monitor | 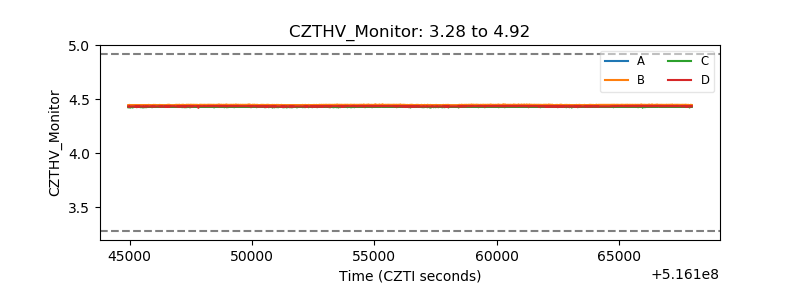 |
| D_VDD | 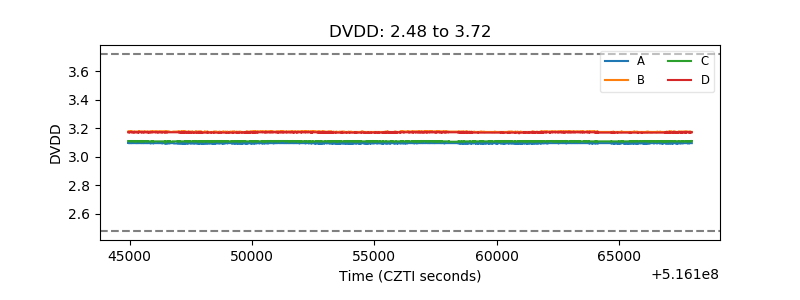 |
| Temperature 1 | 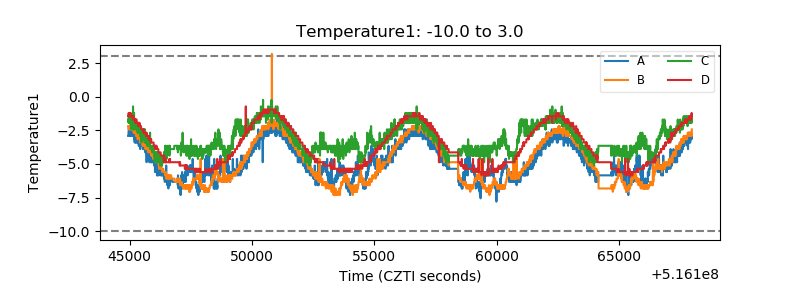 |
| Veto HV Monitor | 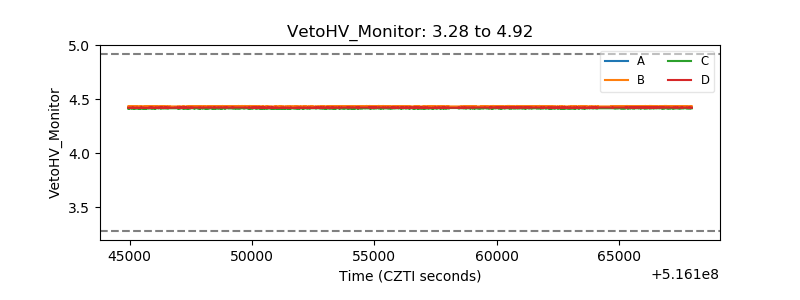 |
| Veto LLD | 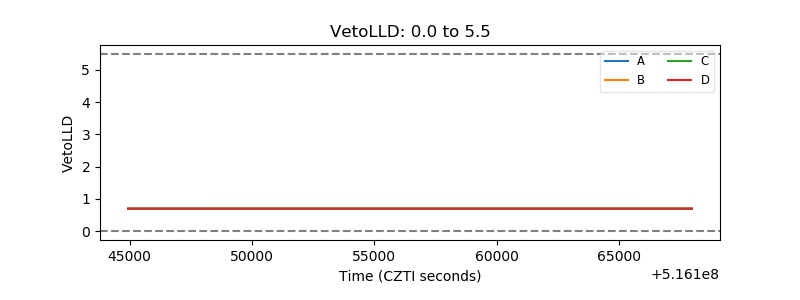 |
| Alpha Counter | 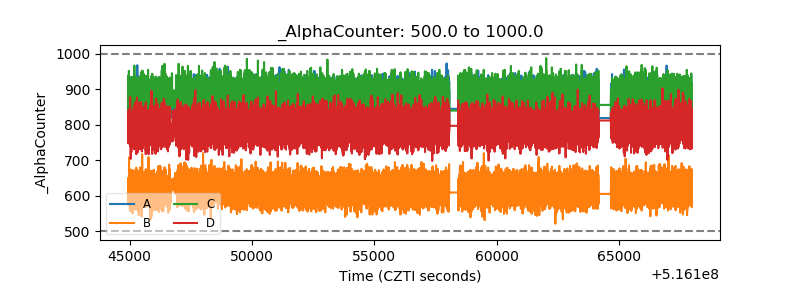 |
| _CPM_Rate | 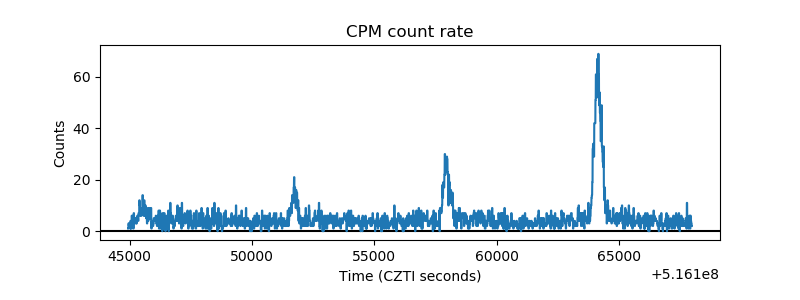 |
| CZT Counter | 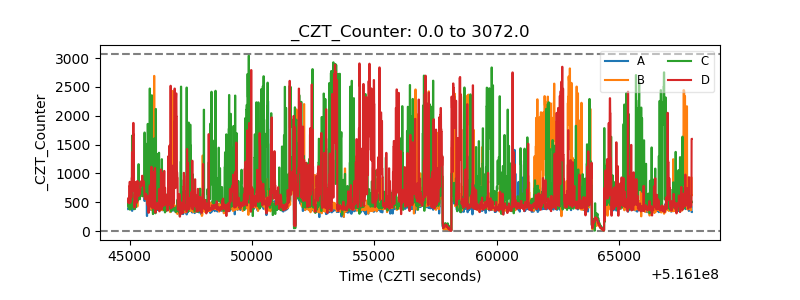 |
| +2.5 Volts monitor | 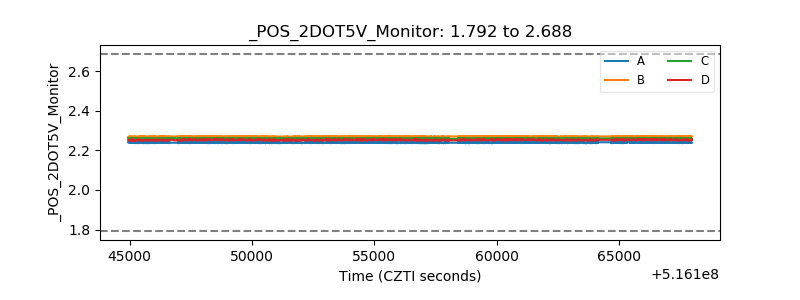 |
| +5 Volts monitor | 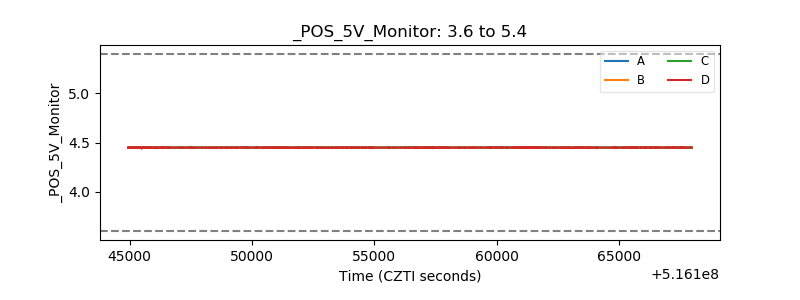 |
| _ROLL_ROT | 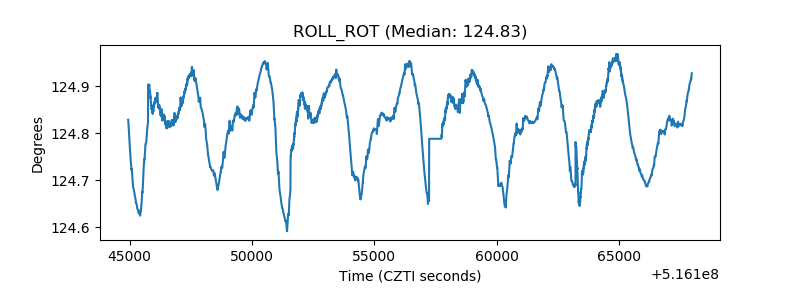 |
| _Roll_DEC | 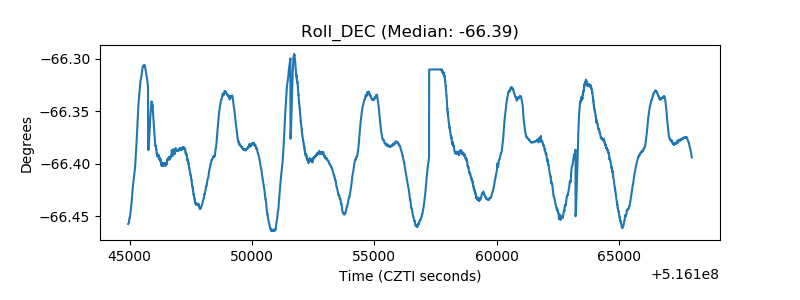 |
| _Roll_RA | 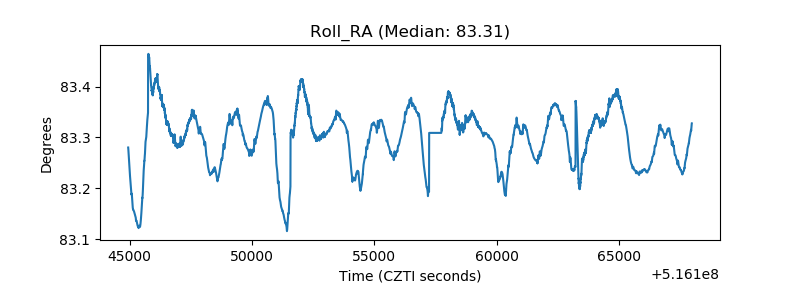 |
| Veto Counter | 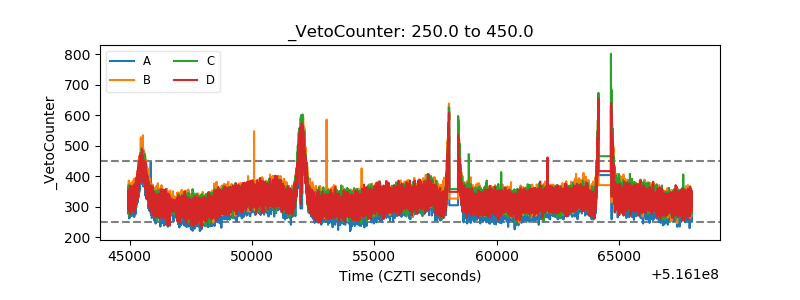 |