| Param | Original file | Final file |
|---|---|---|
| Filename | modeM0/AS1A14_102T01_9000006572_57447cztM0_level2.fits | modeM0/AS1A14_102T01_9000006572_57447cztM0_level2_quad_clean.evt |
| Size (bytes) | 491,400,000 | 95,302,080 |
| Size | 468.6 MB | 90.9 MB |
| Events in quadrant A | 3,058,087 | 636,321 |
| Events in quadrant B | 4,659,623 | 644,208 |
| Events in quadrant C | 5,383,519 | 568,394 |
| Events in quadrant D | 4,557,302 | 559,625 |
| Mode M0 | |||
|---|---|---|---|
| Quadrant | BADHDUFLAG | Total packets | Discarded packets |
| A | 0 | 14094 | 1 |
| B | 0 | 18699 | 1 |
| C | 0 | 20679 | 1 |
| D | 0 | 18380 | 1 |
| Mode M9 | |||
|---|---|---|---|
| Quadrant | BADHDUFLAG | Total packets | Discarded packets |
| A | 0 | 7 | 0 |
| B | 0 | 7 | 0 |
| C | 0 | 7 | 0 |
| D | 0 | 7 | 0 |
| Mode SS | |||
|---|---|---|---|
| Quadrant | BADHDUFLAG | Total packets | Discarded packets |
| A | 0 | 140 | 0 |
| B | 0 | 140 | 0 |
| C | 0 | 140 | 0 |
| D | 0 | 140 | 0 |
| Quadrant | Total seconds | Saturated seconds | Saturation percentage |
|---|---|---|---|
| A | 6838 | 42 | 0.614215% |
| B | 6839 | 554 | 8.100600% |
| C | 6839 | 580 | 8.480772% |
| D | 6839 | 337 | 4.927621% |
Noise dominated data is calculated using 1-second bins in cleaned event files. If a bin has >2000 counts, and if more than 50% of those come from <1% of pixels, then it is considered to be noise-dominated and hence unusable.
| Quadrant | # 1 sec bins | Bins with >0 counts | Bins with >2000 counts | High rate bins dominated by noise | Noise dominated (total time) | Noise dominated (detector-on time) | Marked lightcurve |
|---|---|---|---|---|---|---|---|
| A | 7583 | 6839 | 3 | 3 | 0.04% | 0.04% | 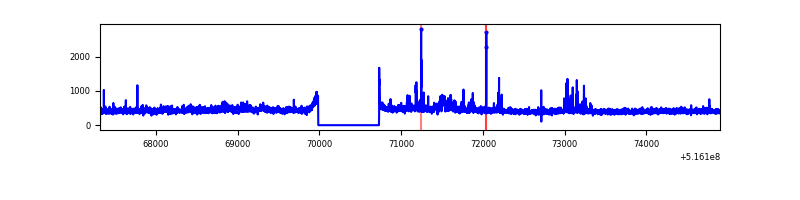 |
| B | 7584 | 6840 | 244 | 244 | 3.22% | 3.57% | 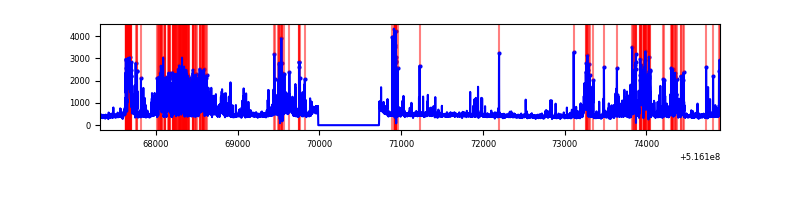 |
| C | 7584 | 6840 | 404 | 404 | 5.33% | 5.91% | 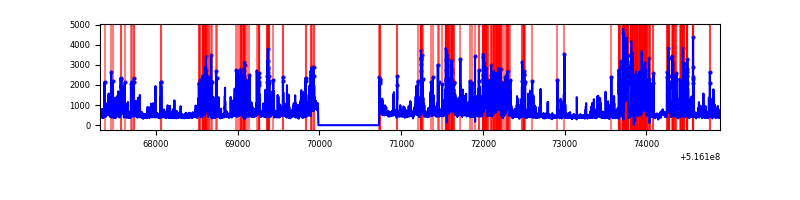 |
| D | 7584 | 6840 | 281 | 281 | 3.71% | 4.11% | 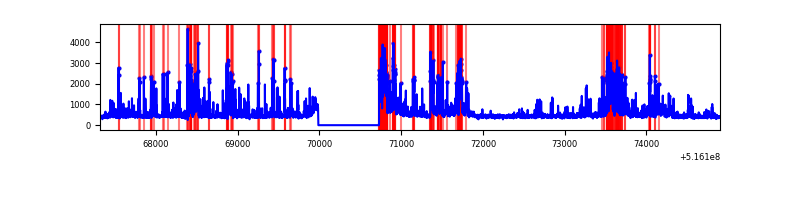 |
Top three noisy pixels from each quadrant. If the there are fewer than three noisy pixels in the level2.evt file, extra rows are filled as -1
| Pixel properties | Quadrant properties | ||||||
|---|---|---|---|---|---|---|---|
| Quadrant | DetID | PixID | Counts | Sigma | Mean | Median | Sigma |
| A | 3 | 14 | 216998 | 1201.08 | 727 | 711 | 180.1 |
| A | 0 | 12 | 9620 | 49.47 | 727 | 711 | 180.1 |
| A | 13 | 254 | 9244 | 47.39 | 727 | 711 | 180.1 |
| B | 4 | 206 | 1173217 | 7868.9 | 694 | 668 | 149.0 |
| B | 5 | 185 | 481086 | 3224.05 | 694 | 668 | 149.0 |
| B | 10 | 247 | 87833 | 584.96 | 694 | 668 | 149.0 |
| C | 15 | 224 | 2107561 | 11584.35 | 671 | 666 | 181.9 |
| C | 1 | 16 | 217348 | 1191.38 | 671 | 666 | 181.9 |
| C | 14 | 254 | 192471 | 1054.6 | 671 | 666 | 181.9 |
| D | 15 | 142 | 633343 | 3290.55 | 686 | 656 | 192.3 |
| D | 2 | 249 | 433934 | 2253.44 | 686 | 656 | 192.3 |
| D | 8 | 240 | 261883 | 1358.62 | 686 | 656 | 192.3 |
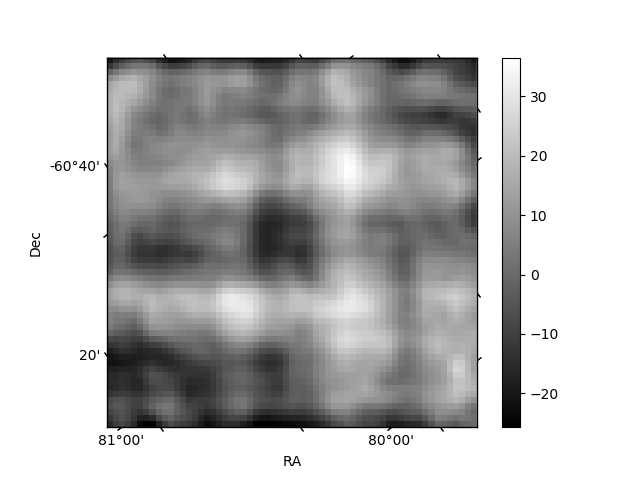
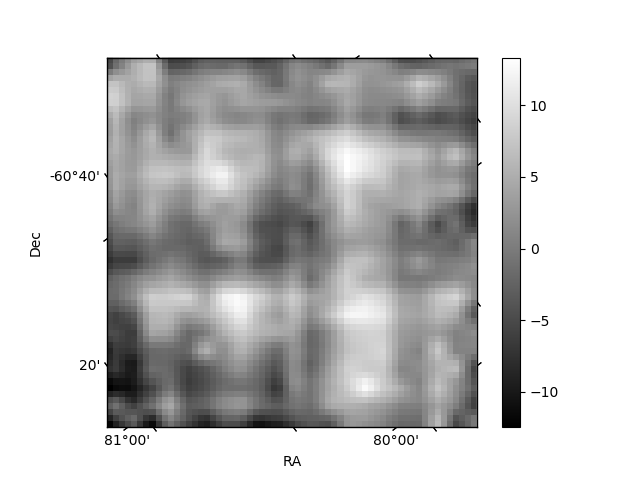
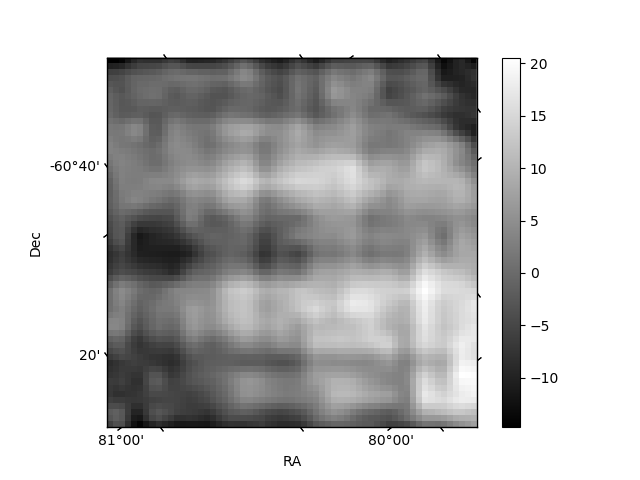
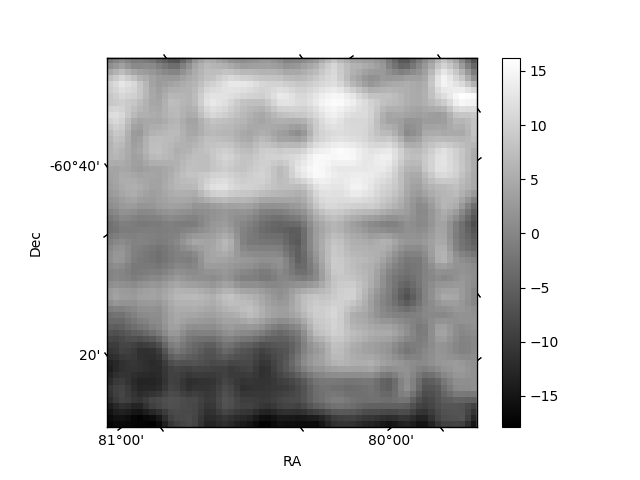
Histogram calculated using DETX and DETY for each event in the final _common_clean file
| Quadrant A | 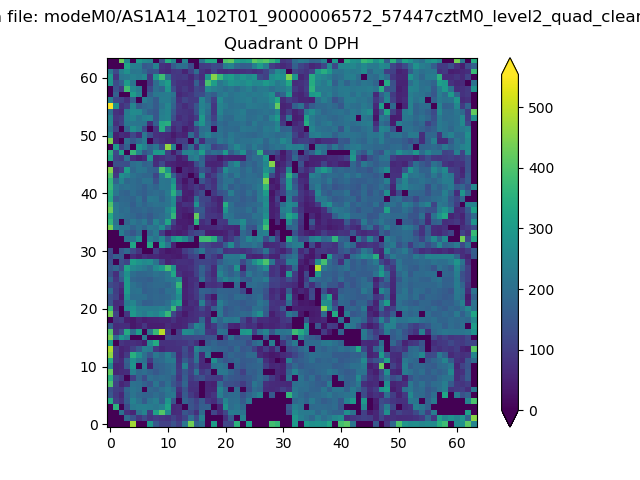 |
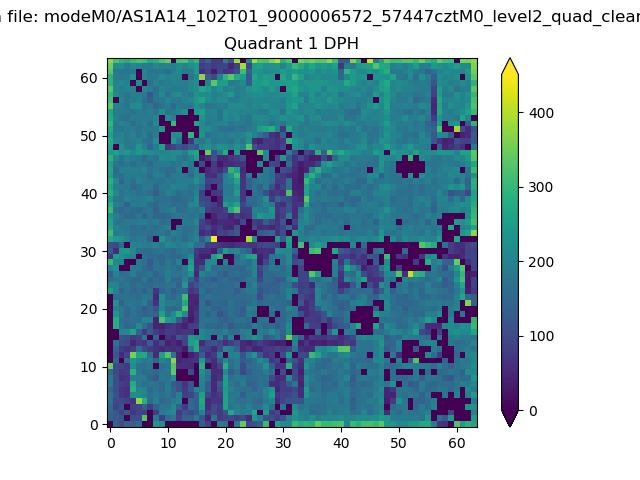 |
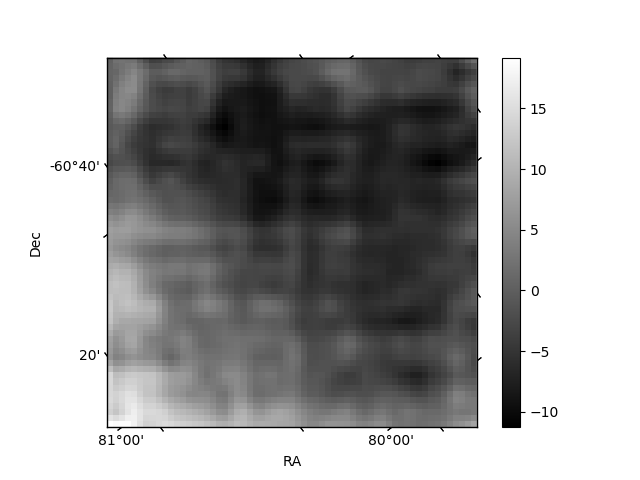
Quadrant B |
|---|---|---|---|
| Quadrant D | 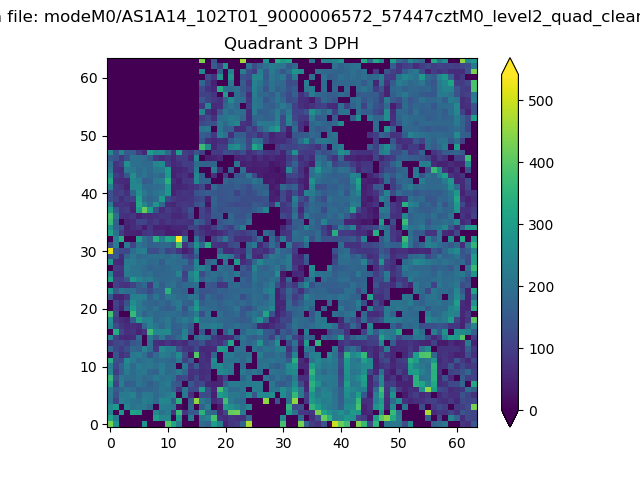 |
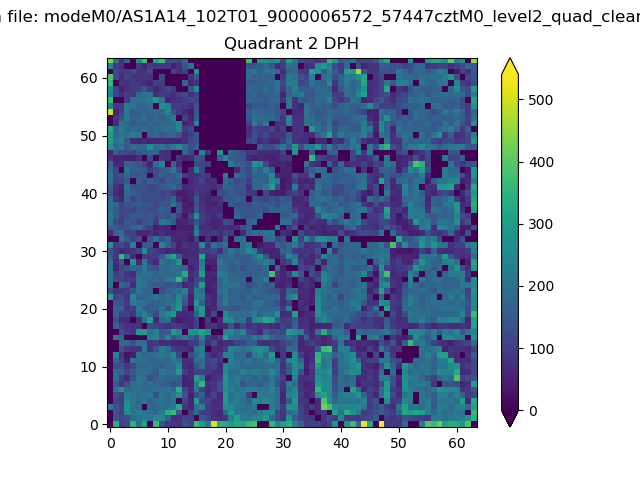 |
Quadrant C |
| Plot type | Count rate plots | Images |
|---|---|---|
| Comparison with Poisson distribution Blue bars denote a histogram of data divided into 1 sec bins. Red curve is a Poisson curve with rate = median count rate of data. |
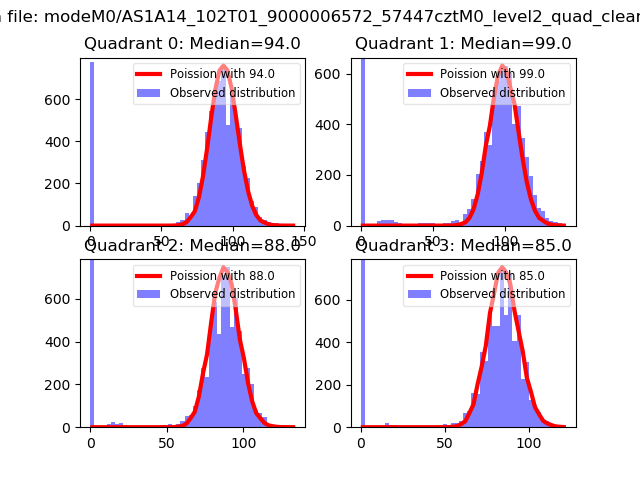 |
 |
| Quadrant-wise count rates Data is divided into 100 sec bins |
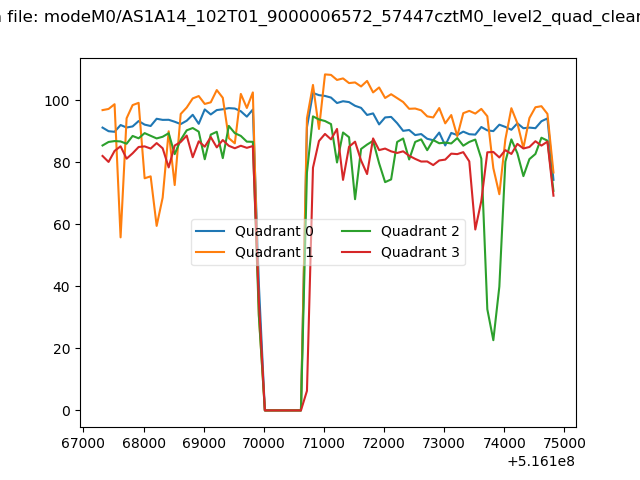 |
|
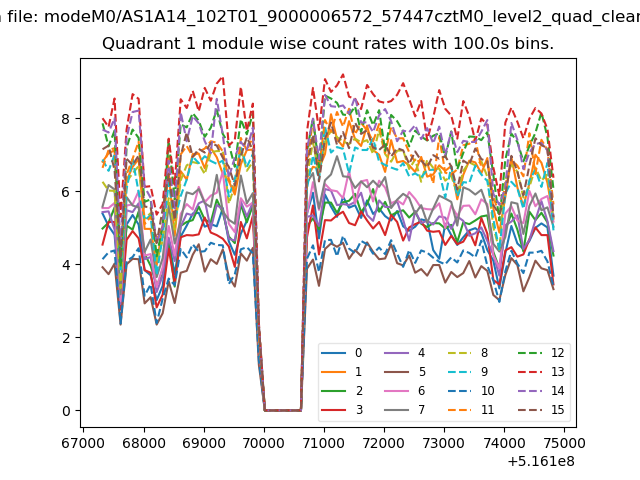
| Module-wise count rates for Quadrant A Data is divided into 100 sec bins |
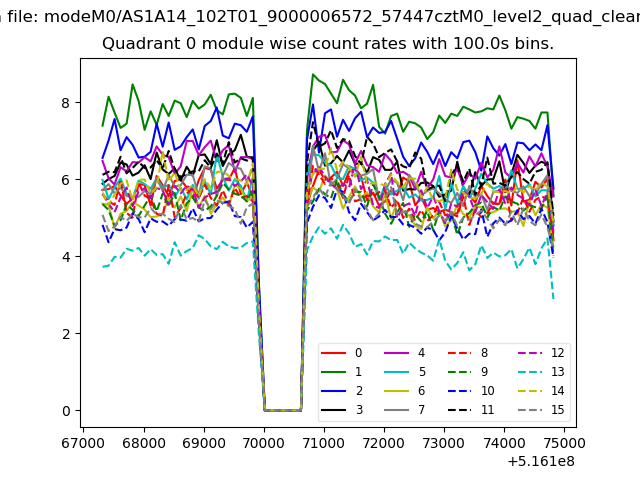 |
 |
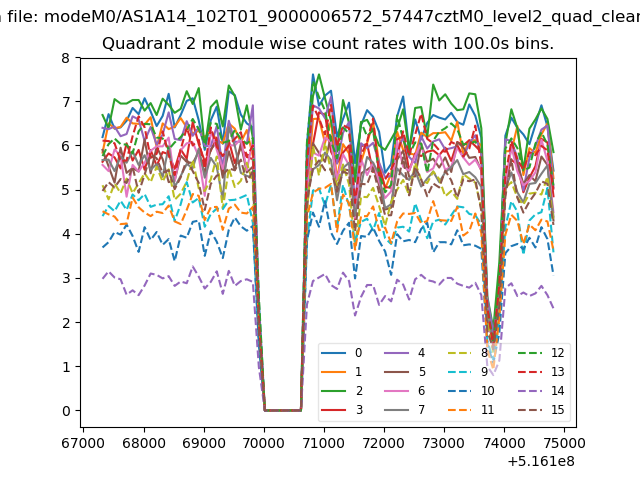
| Module-wise count rates for Quadrant B Data is divided into 100 sec bins |
 |
 |
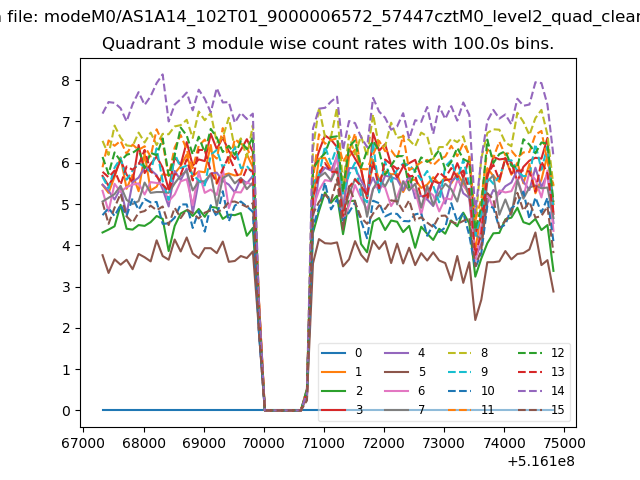
| Module-wise count rates for Quadrant C Data is divided into 100 sec bins |
 |
 |
| Module-wise count rates for Quadrant D Data is divided into 100 sec bins |
 |
 |
| Parameter | Plot |
|---|---|
| CZT HV Monitor | 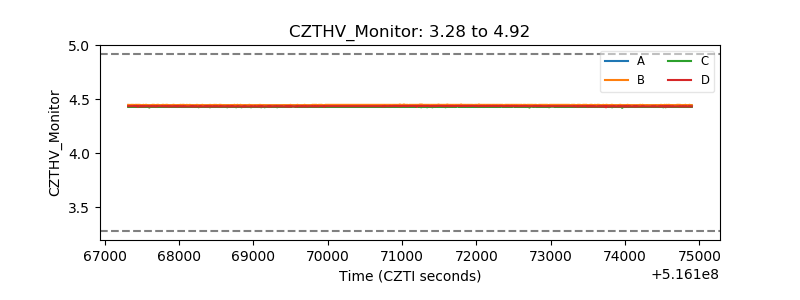 |
| D_VDD | 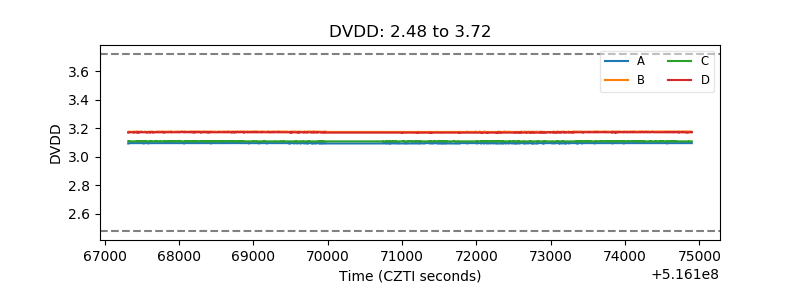 |
| Temperature 1 | 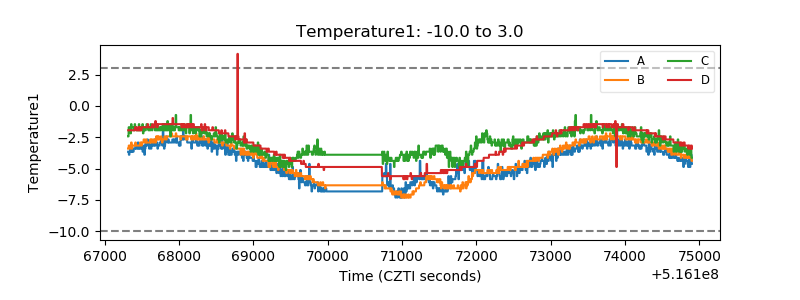 |
| Veto HV Monitor | 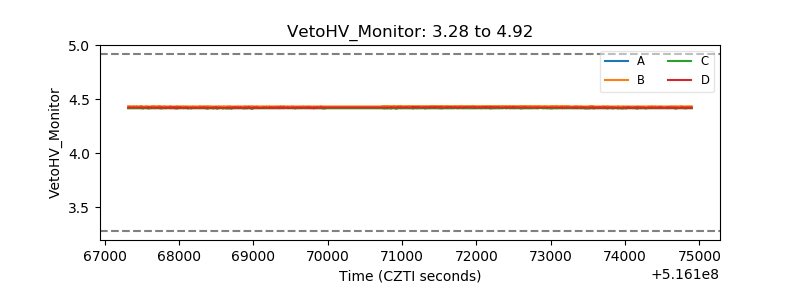 |
| Veto LLD | 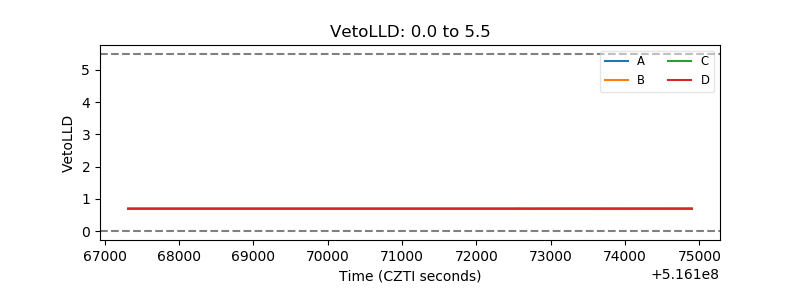 |
| Alpha Counter | 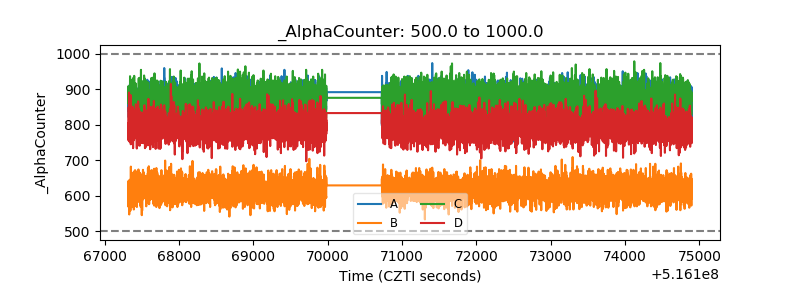 |
| _CPM_Rate | 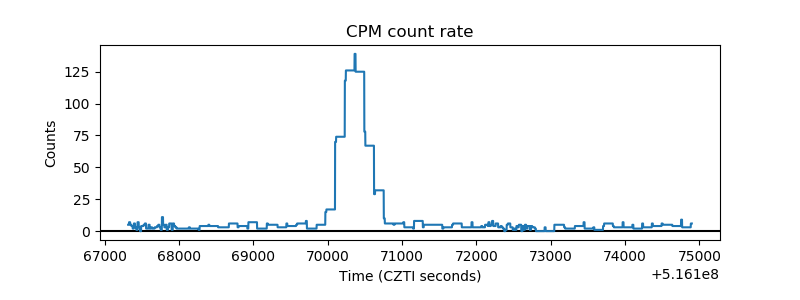 |
| CZT Counter | 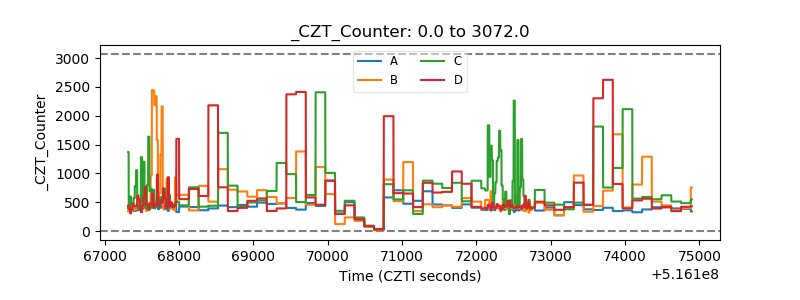 |
| +2.5 Volts monitor | 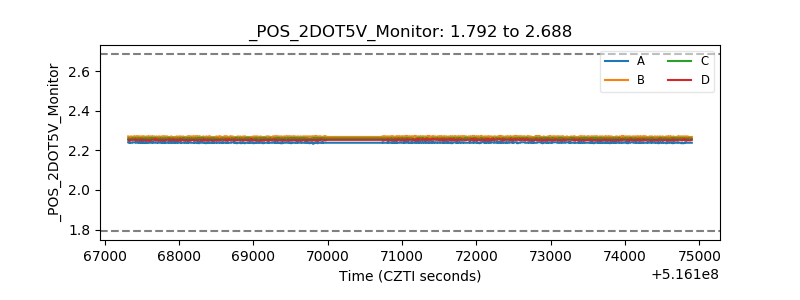 |
| +5 Volts monitor | 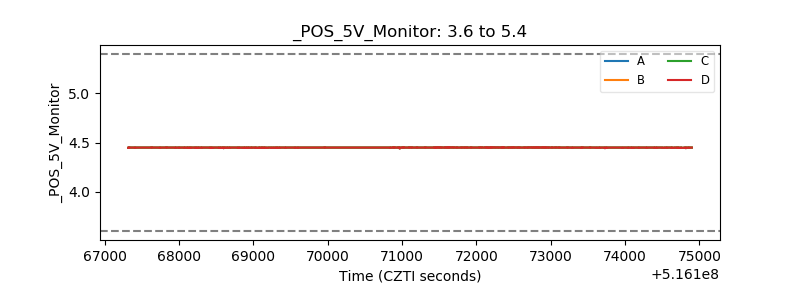 |
| _ROLL_ROT | 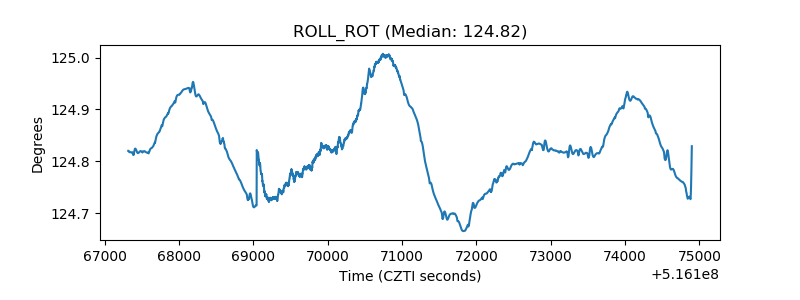 |
| _Roll_DEC | 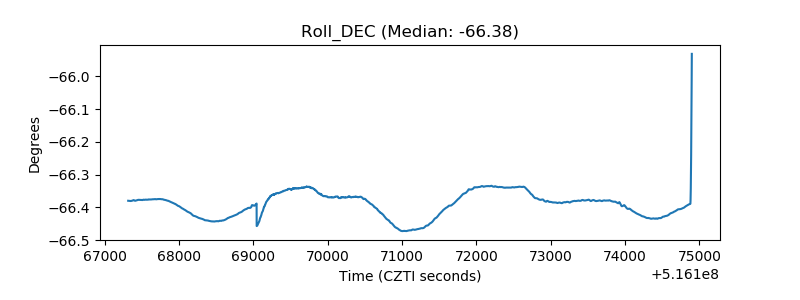 |
| _Roll_RA | 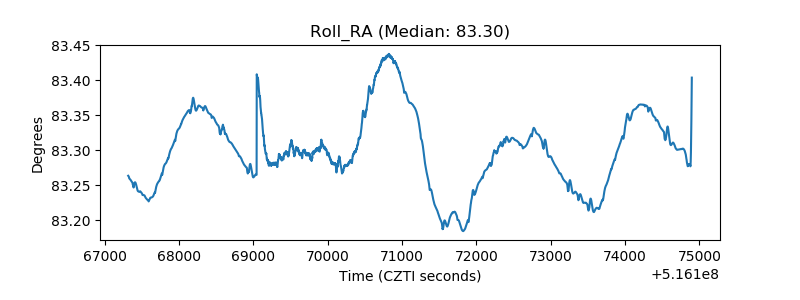 |
| Veto Counter | 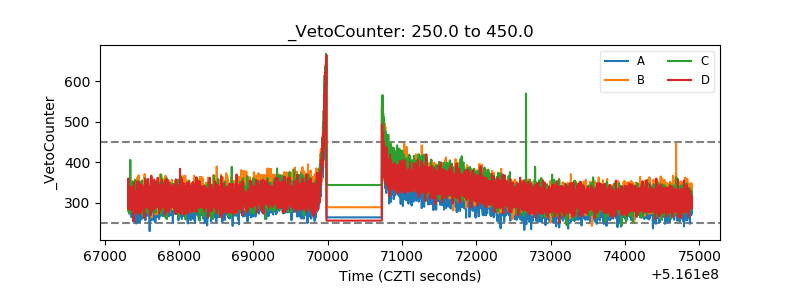 |