| Param | Original file | Final file |
|---|---|---|
| Filename | modeM0/AS1A14_113T09_9000006574cztM0_level2.fits | modeM0/AS1A14_113T09_9000006574cztM0_level2_quad_clean.evt |
| Size (bytes) | 5,047,980,480 | 2,112,514,560 |
| Size | 4.7 GB | 2.0 GB |
| Events in quadrant A | 30,529,220 | 6,057,528 |
| Events in quadrant B | 27,862,864 | 6,170,807 |
| Events in quadrant C | 28,301,488 | 5,287,097 |
| Events in quadrant D | 24,802,477 | 5,093,995 |
| Mode SS | |||
|---|---|---|---|
| Quadrant | BADHDUFLAG | Total packets | Discarded packets |
| A | 0 | 12250 | 0 |
| B | 0 | 12250 | 0 |
| C | 0 | 12250 | 0 |
| D | 0 | 12250 | 0 |
| Mode M9 | |||
|---|---|---|---|
| Quadrant | BADHDUFLAG | Total packets | Discarded packets |
| A | 0 | 734 | 0 |
| B | 0 | 734 | 0 |
| C | 0 | 734 | 0 |
| D | 0 | 734 | 0 |
| Mode M0 | |||
|---|---|---|---|
| Quadrant | BADHDUFLAG | Total packets | Discarded packets |
| A | 0 | 1329719 | 0 |
| B | 0 | 1474474 | 0 |
| C | 0 | 1814373 | 0 |
| D | 0 | 1694720 | 0 |
| Quadrant | Total seconds | Saturated seconds | Saturation percentage |
|---|---|---|---|
| A | 603549 | 10165 | 1.684205% |
| B | 603549 | 27741 | 4.596313% |
| C | 603540 | 46814 | 7.756570% |
| D | 603547 | 41534 | 6.881651% |
Noise dominated data is calculated using 1-second bins in cleaned event files. If a bin has >2000 counts, and if more than 50% of those come from <1% of pixels, then it is considered to be noise-dominated and hence unusable.
| Quadrant | # 1 sec bins | Bins with >0 counts | Bins with >2000 counts | High rate bins dominated by noise | Noise dominated (total time) | Noise dominated (detector-on time) | Marked lightcurve |
|---|---|---|---|---|---|---|---|
| A | 681715 | 592078 | 0 | 0 | 0.00% | 0.00% | 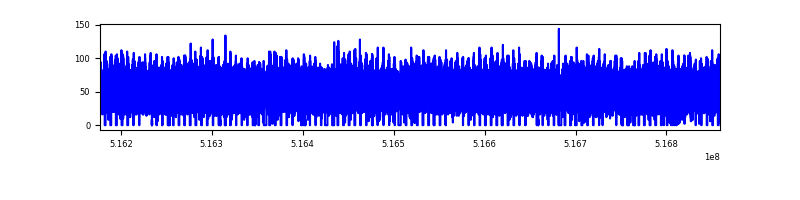 |
| B | 681716 | 591820 | 0 | 0 | 0.00% | 0.00% | 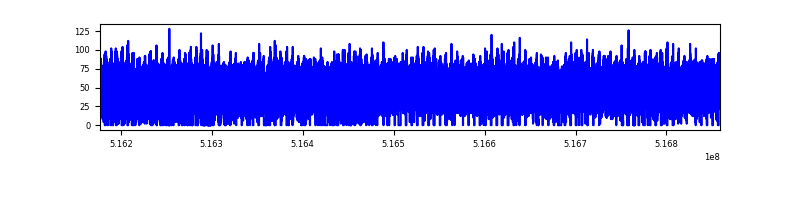 |
| C | 681716 | 591611 | 0 | 0 | 0.00% | 0.00% | 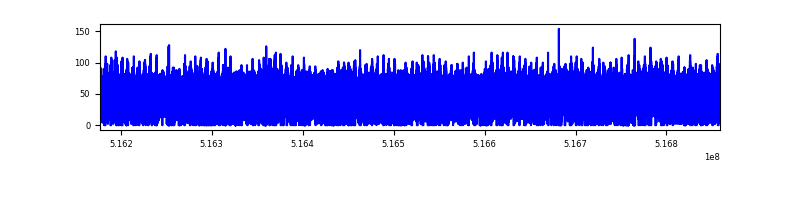 |
| D | 681716 | 590754 | 0 | 0 | 0.00% | 0.00% | 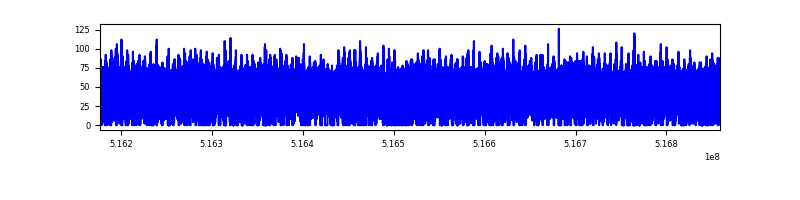 |
Top three noisy pixels from each quadrant. If the there are fewer than three noisy pixels in the level2.evt file, extra rows are filled as -1
| Pixel properties | Quadrant properties | ||||||
|---|---|---|---|---|---|---|---|
| Quadrant | DetID | PixID | Counts | Sigma | Mean | Median | Sigma |
| A | 14 | 188 | 34126 | 9.99 | 7989 | 7343 | 2680.9 |
| A | 9 | 255 | 30565 | 8.66 | 7989 | 7343 | 2680.9 |
| A | 14 | 204 | 28120 | 7.75 | 7989 | 7343 | 2680.9 |
| B | 2 | 9 | 32622 | 14.96 | 7359 | 6955 | 1715.2 |
| B | 2 | 8 | 28629 | 12.64 | 7359 | 6955 | 1715.2 |
| B | 3 | 25 | 23045 | 9.38 | 7359 | 6955 | 1715.2 |
| C | 2 | 31 | 22813 | 6.13 | 7541 | 6853 | 2605.4 |
| C | 7 | 221 | 22396 | 5.97 | 7541 | 6853 | 2605.4 |
| C | 15 | 127 | 21960 | 5.8 | 7541 | 6853 | 2605.4 |
| D | 6 | 218 | 30964 | 10.37 | 7081 | 6286 | 2380.8 |
| D | 15 | 11 | 24305 | 7.57 | 7081 | 6286 | 2380.8 |
| D | 8 | 12 | 23072 | 7.05 | 7081 | 6286 | 2380.8 |
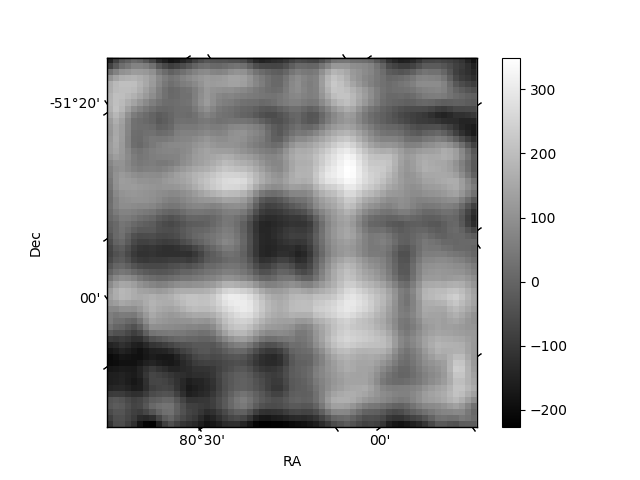
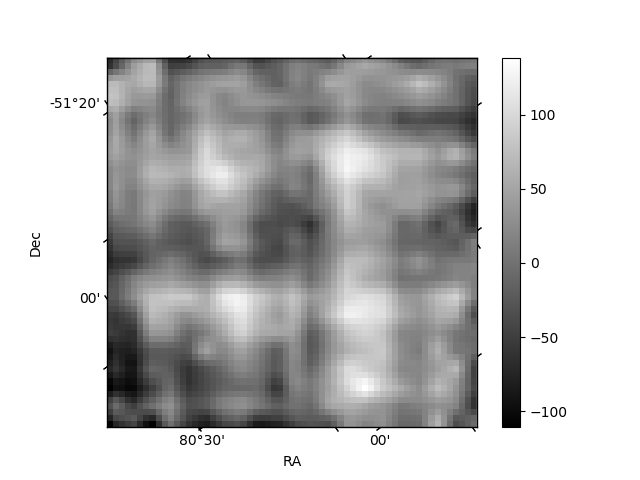
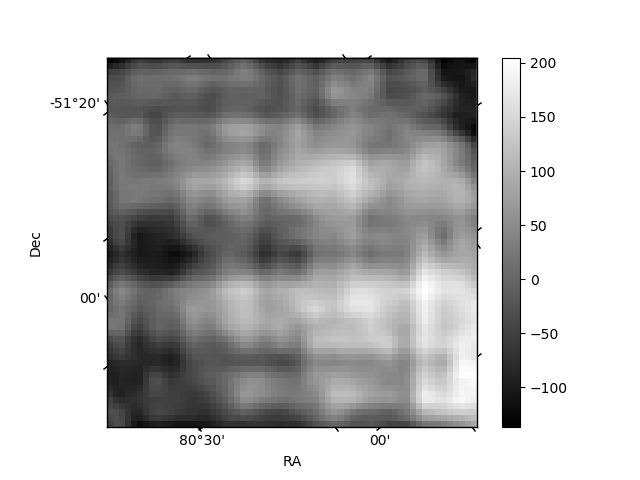
Histogram calculated using DETX and DETY for each event in the final _common_clean file
| Quadrant A | 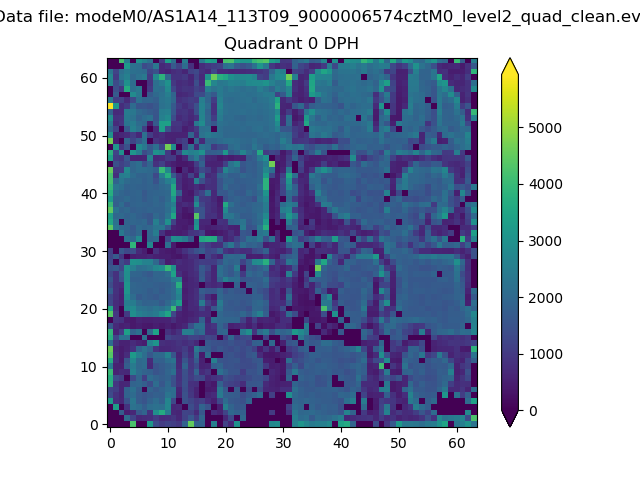 |
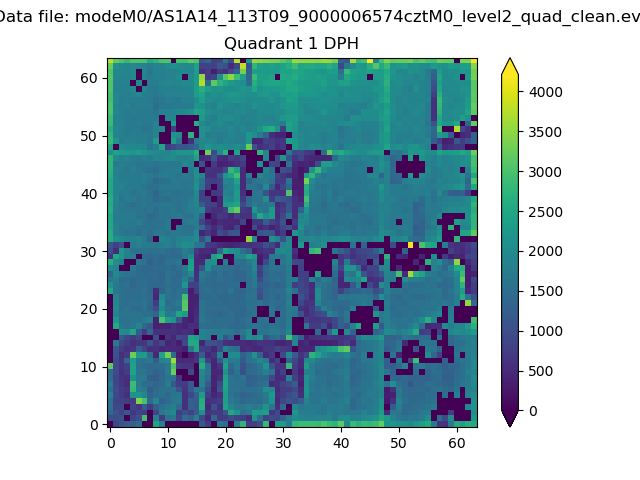 |
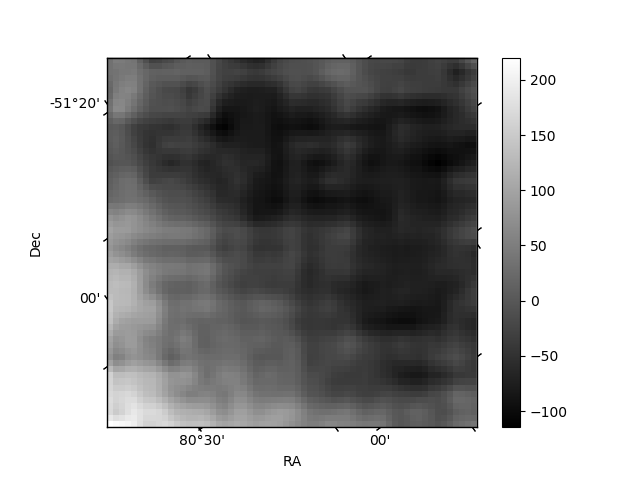
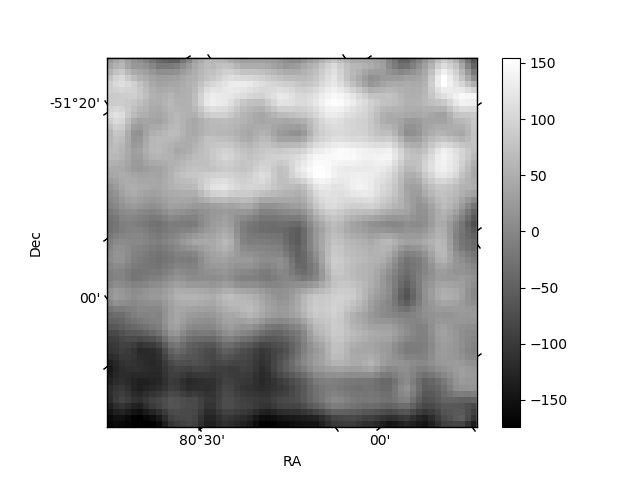
Quadrant B |
|---|---|---|---|
| Quadrant D | 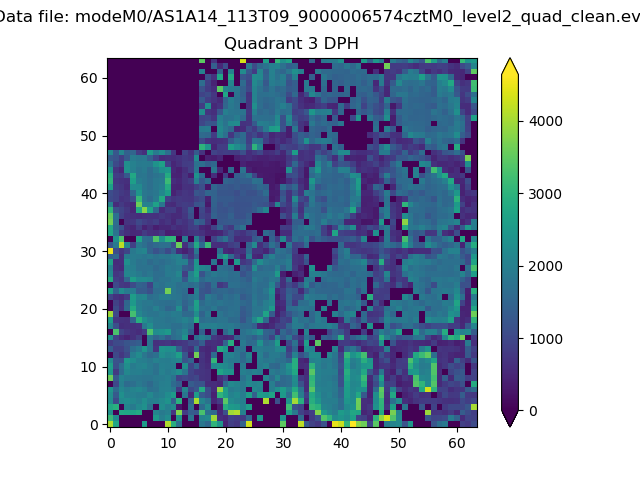 |
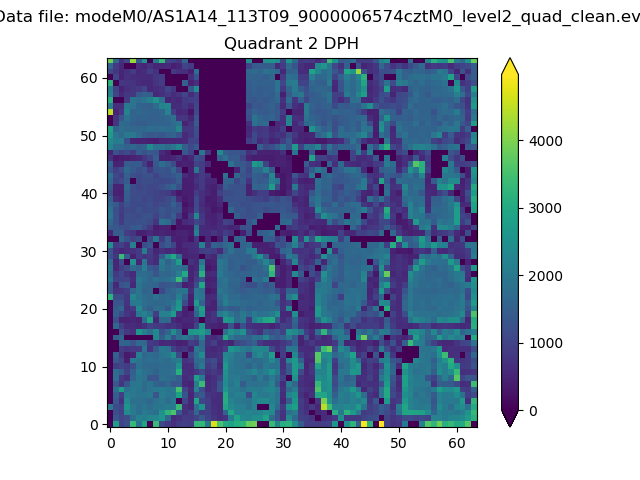 |
Quadrant C |
| Plot type | Count rate plots | Images |
|---|---|---|
| Comparison with Poisson distribution Blue bars denote a histogram of data divided into 1 sec bins. Red curve is a Poisson curve with rate = median count rate of data. |
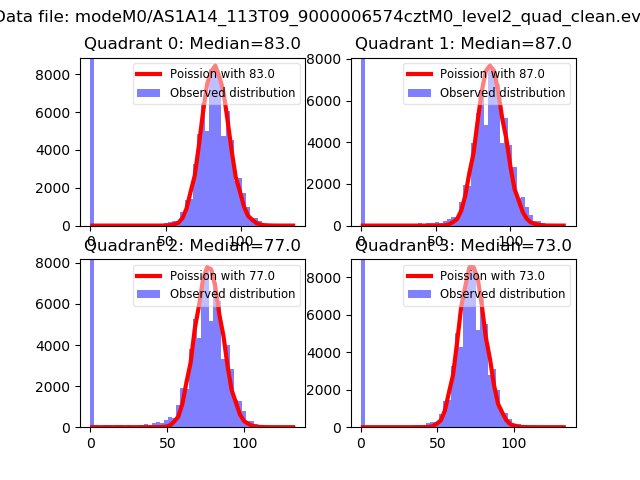 |
 |
| Quadrant-wise count rates Data is divided into 100 sec bins |
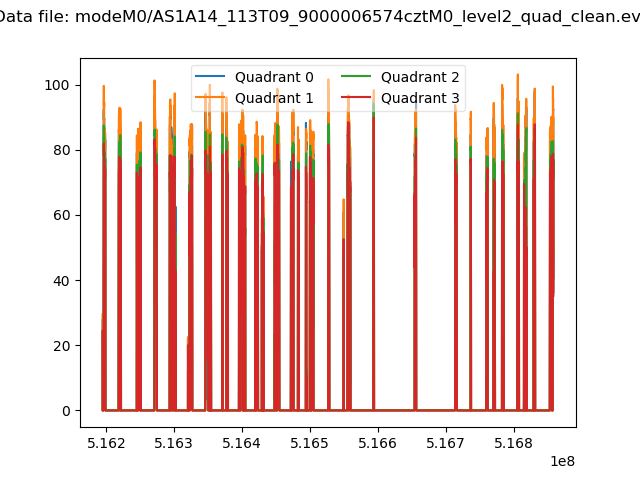 |
|
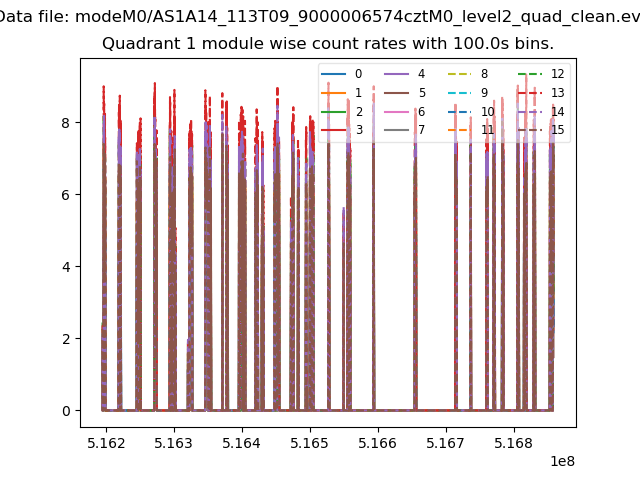
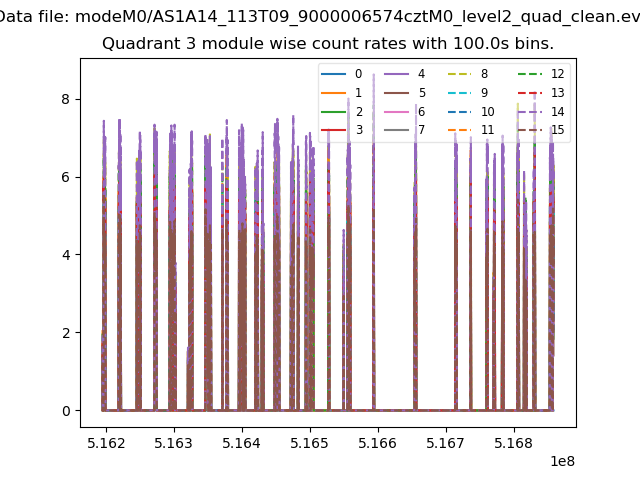
| Module-wise count rates for Quadrant A Data is divided into 100 sec bins |
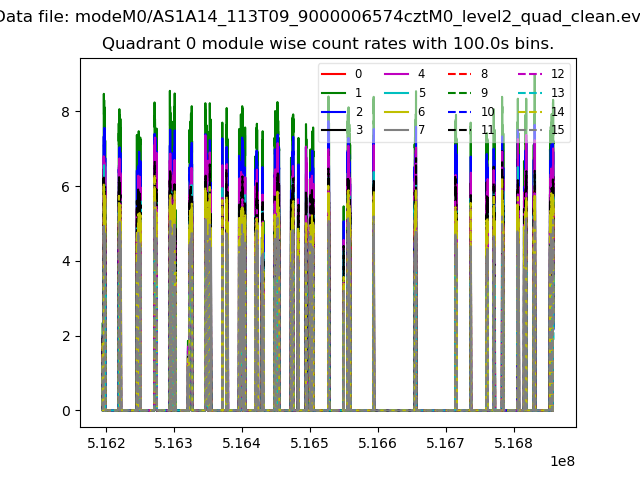 |
 |
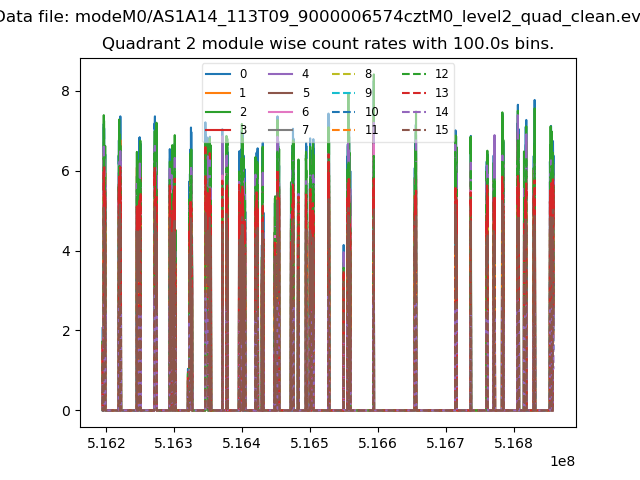
| Module-wise count rates for Quadrant B Data is divided into 100 sec bins |
 |
 |
| Module-wise count rates for Quadrant C Data is divided into 100 sec bins |
 |
 |
| Module-wise count rates for Quadrant D Data is divided into 100 sec bins |
 |
 |
| Parameter | Plot |
|---|---|
| CZT HV Monitor | 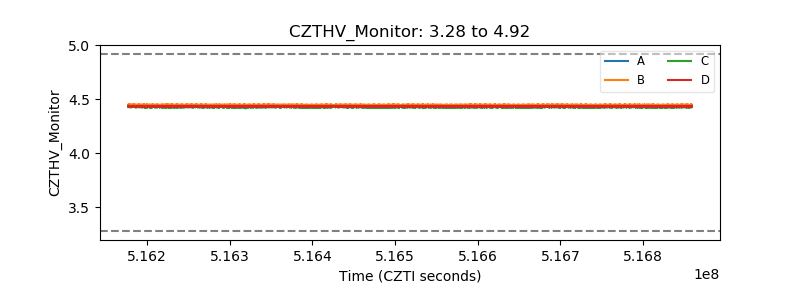 |
| D_VDD | 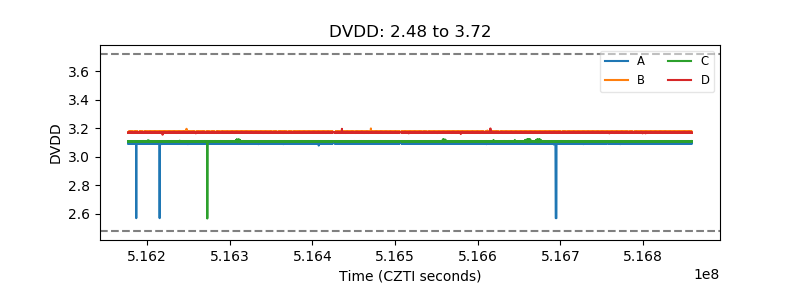 |
| Temperature 1 | 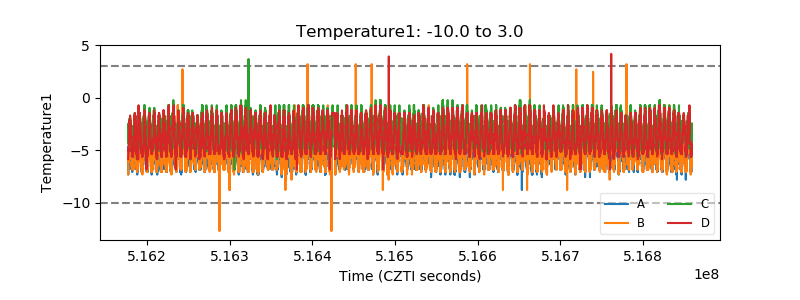 |
| Veto HV Monitor | 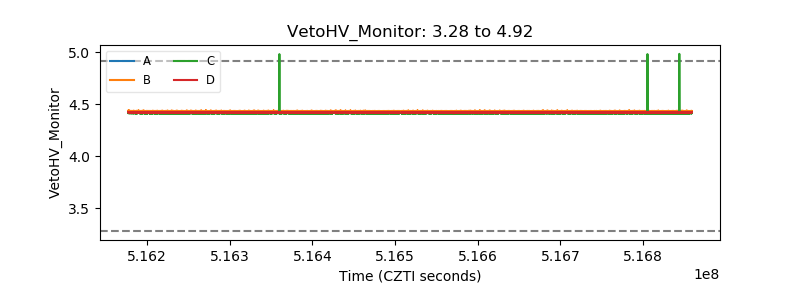 |
| Veto LLD | 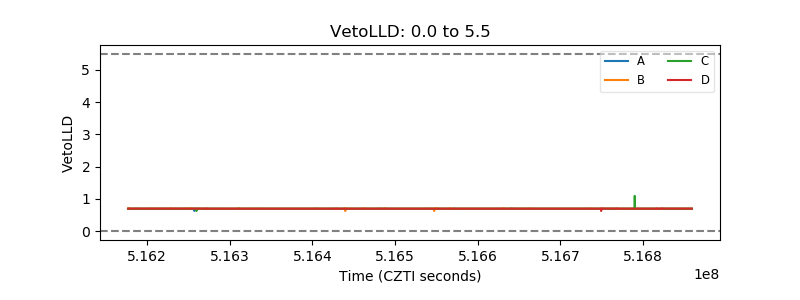 |
| Alpha Counter | 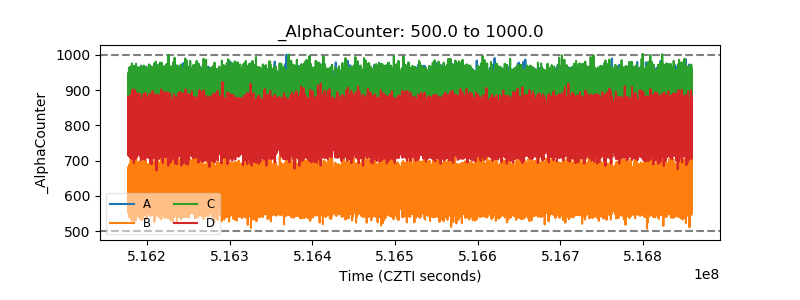 |
| _CPM_Rate | 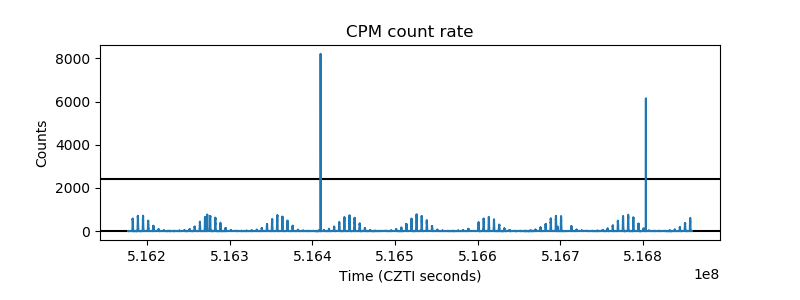 |
| CZT Counter | 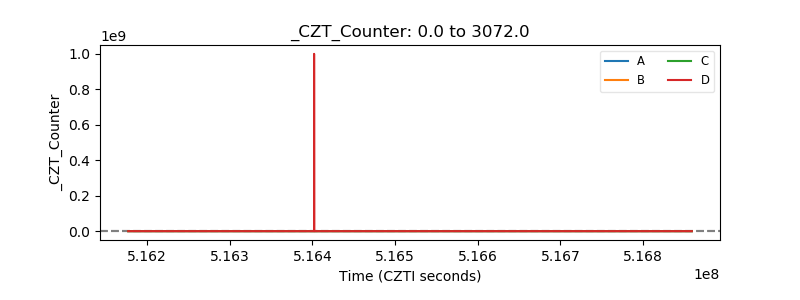 |
| +2.5 Volts monitor | 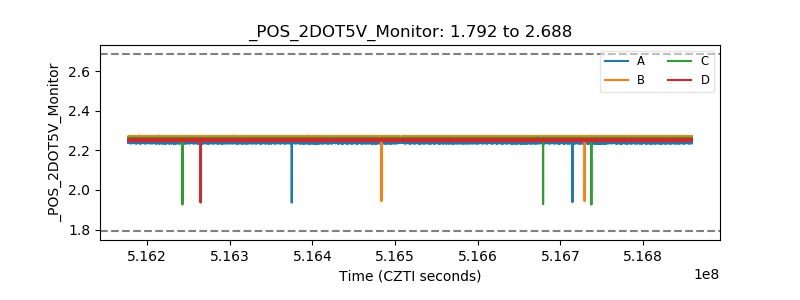 |
| +5 Volts monitor | 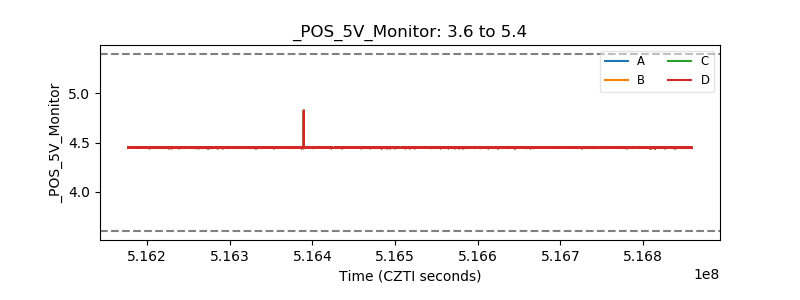 |
| _ROLL_ROT | 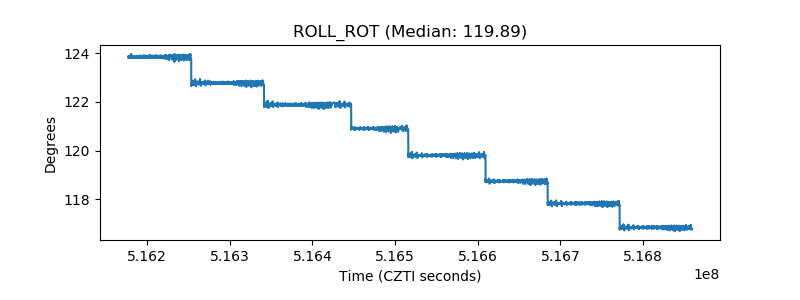 |
| _Roll_DEC | 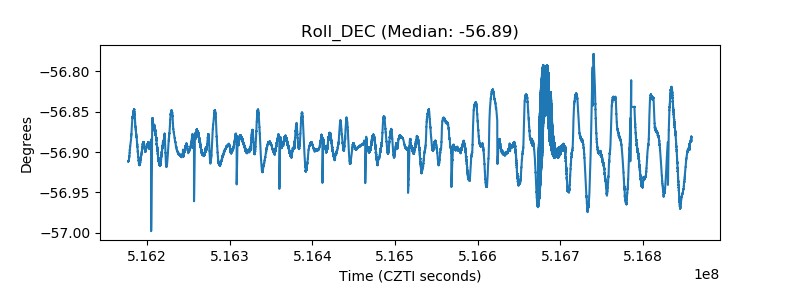 |
| _Roll_RA | 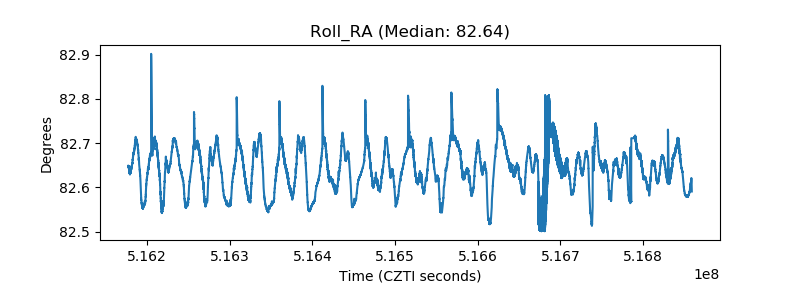 |
| Veto Counter | 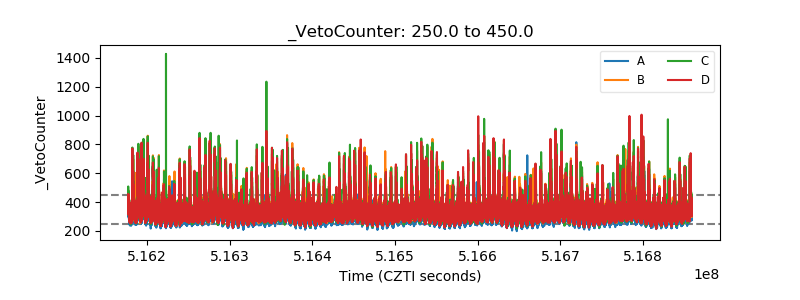 |