| Param | Original file | Final file |
|---|---|---|
| Filename | modeM0/AS1A14_113T09_9000006574_57449cztM0_level2.fits | modeM0/AS1A14_113T09_9000006574_57449cztM0_level2_quad_clean.evt |
| Size (bytes) | 459,354,240 | 98,383,680 |
| Size | 438.1 MB | 93.8 MB |
| Events in quadrant A | 2,941,024 | 655,477 |
| Events in quadrant B | 3,834,574 | 684,586 |
| Events in quadrant C | 4,797,869 | 610,715 |
| Events in quadrant D | 4,905,640 | 557,744 |
| Mode SS | |||
|---|---|---|---|
| Quadrant | BADHDUFLAG | Total packets | Discarded packets |
| A | 0 | 138 | 0 |
| B | 0 | 138 | 0 |
| C | 0 | 138 | 0 |
| D | 0 | 138 | 0 |
| Mode M9 | |||
|---|---|---|---|
| Quadrant | BADHDUFLAG | Total packets | Discarded packets |
| A | 0 | 10 | 0 |
| B | 0 | 10 | 0 |
| C | 0 | 10 | 0 |
| D | 0 | 10 | 0 |
| Mode M0 | |||
|---|---|---|---|
| Quadrant | BADHDUFLAG | Total packets | Discarded packets |
| A | 0 | 13691 | 1 |
| B | 0 | 16123 | 1 |
| C | 0 | 18816 | 1 |
| D | 0 | 19221 | 1 |
| Quadrant | Total seconds | Saturated seconds | Saturation percentage |
|---|---|---|---|
| A | 6746 | 54 | 0.800474% |
| B | 6747 | 284 | 4.209278% |
| C | 6747 | 359 | 5.320883% |
| D | 6747 | 504 | 7.469987% |
Noise dominated data is calculated using 1-second bins in cleaned event files. If a bin has >2000 counts, and if more than 50% of those come from <1% of pixels, then it is considered to be noise-dominated and hence unusable.
| Quadrant | # 1 sec bins | Bins with >0 counts | Bins with >2000 counts | High rate bins dominated by noise | Noise dominated (total time) | Noise dominated (detector-on time) | Marked lightcurve |
|---|---|---|---|---|---|---|---|
| A | 7756 | 6746 | 2 | 2 | 0.03% | 0.03% | 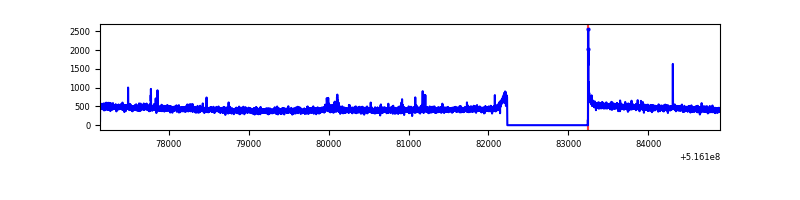 |
| B | 7757 | 6747 | 124 | 124 | 1.60% | 1.84% | 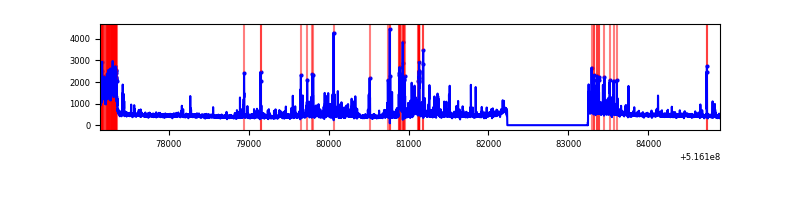 |
| C | 7757 | 6747 | 210 | 210 | 2.71% | 3.11% | 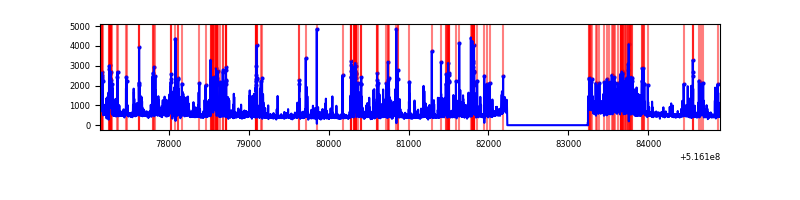 |
| D | 7757 | 6748 | 383 | 383 | 4.94% | 5.68% | 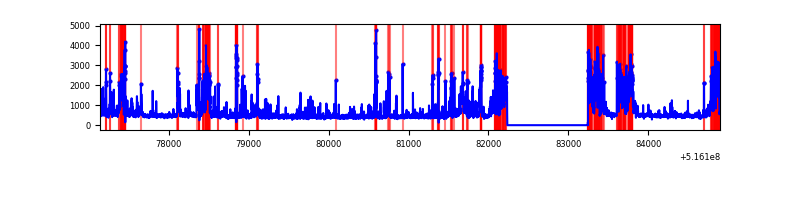 |
Top three noisy pixels from each quadrant. If the there are fewer than three noisy pixels in the level2.evt file, extra rows are filled as -1
| Pixel properties | Quadrant properties | ||||||
|---|---|---|---|---|---|---|---|
| Quadrant | DetID | PixID | Counts | Sigma | Mean | Median | Sigma |
| A | 3 | 14 | 38143 | 204.6 | 744 | 728 | 182.9 |
| A | 13 | 254 | 9316 | 46.96 | 744 | 728 | 182.9 |
| A | 3 | 137 | 9026 | 45.38 | 744 | 728 | 182.9 |
| B | 5 | 185 | 376610 | 2427.44 | 722 | 694 | 154.9 |
| B | 4 | 206 | 228766 | 1472.75 | 722 | 694 | 154.9 |
| B | 7 | 252 | 175863 | 1131.14 | 722 | 694 | 154.9 |
| C | 15 | 224 | 1410270 | 7202.19 | 715 | 707 | 195.7 |
| C | 1 | 16 | 224186 | 1141.87 | 715 | 707 | 195.7 |
| C | 14 | 254 | 152290 | 774.52 | 715 | 707 | 195.7 |
| D | 15 | 142 | 1401676 | 6997.15 | 704 | 671 | 200.2 |
| D | 2 | 249 | 191692 | 954.03 | 704 | 671 | 200.2 |
| D | 8 | 240 | 187569 | 933.44 | 704 | 671 | 200.2 |
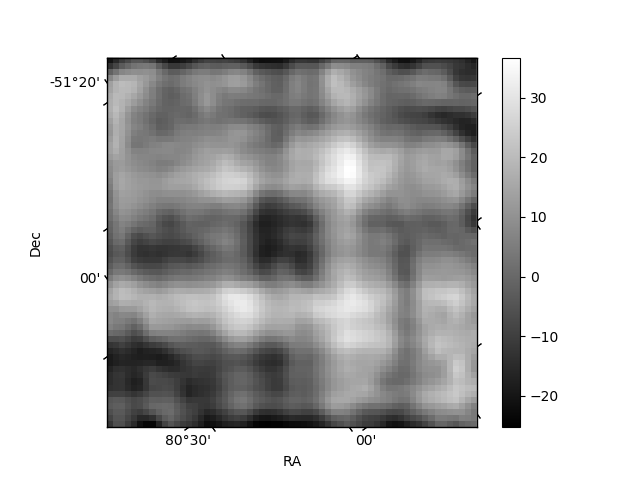
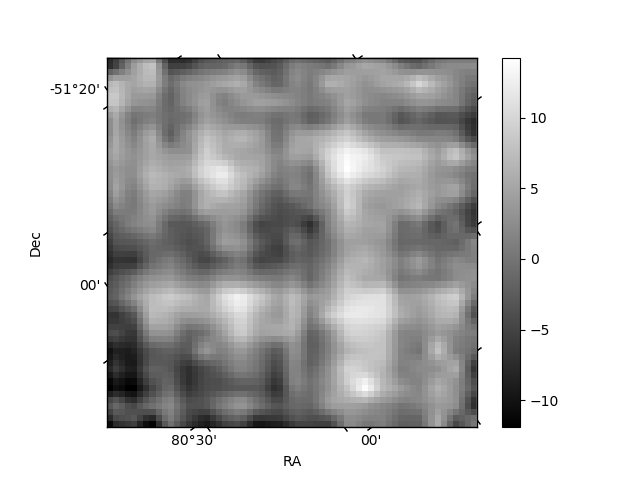
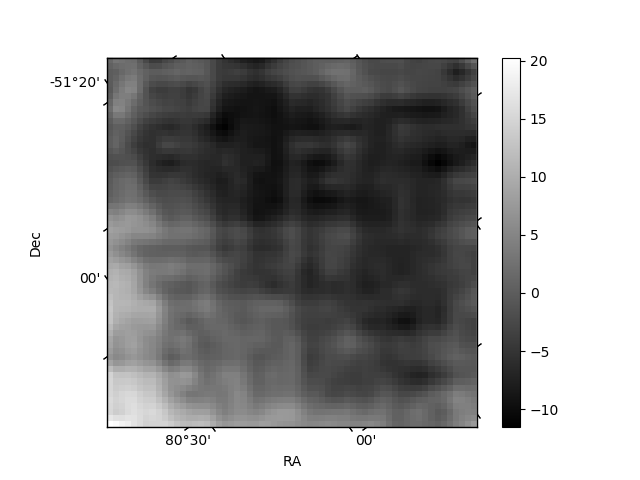
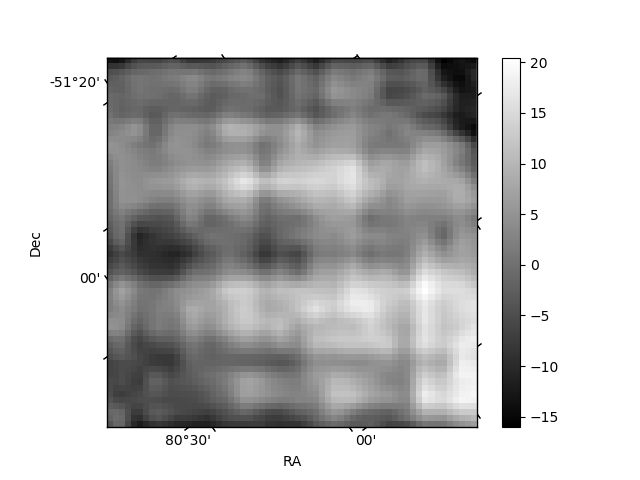
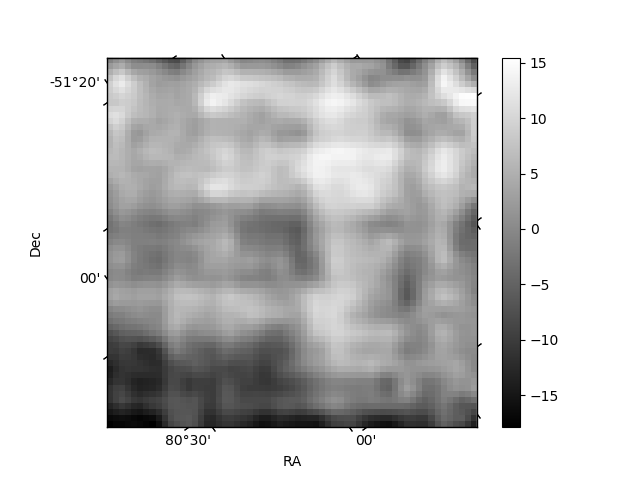
Histogram calculated using DETX and DETY for each event in the final _common_clean file
| Quadrant A | 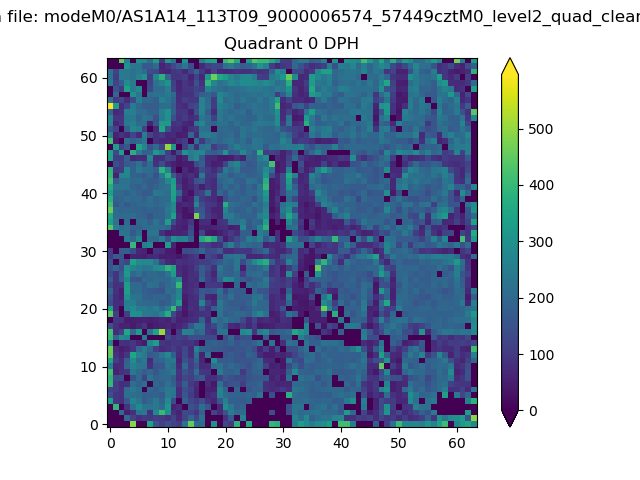 |
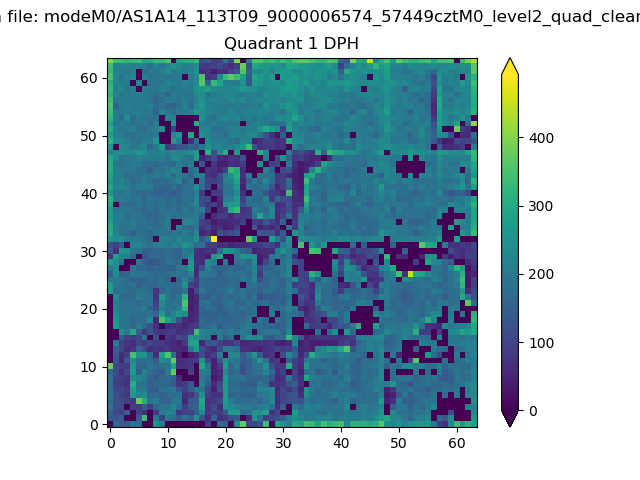 |
Quadrant B |
|---|---|---|---|
| Quadrant D | 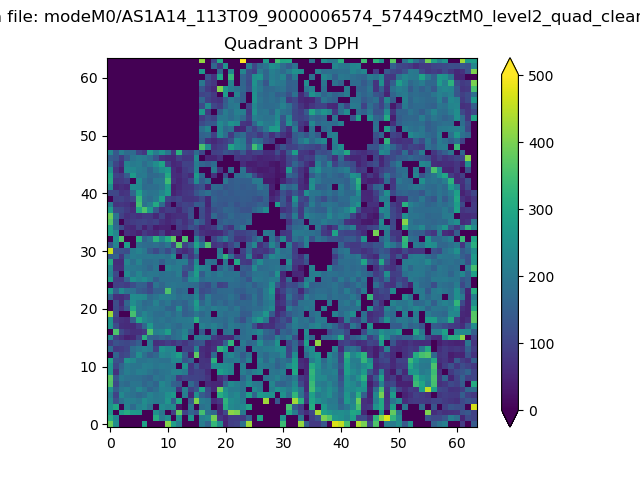 |
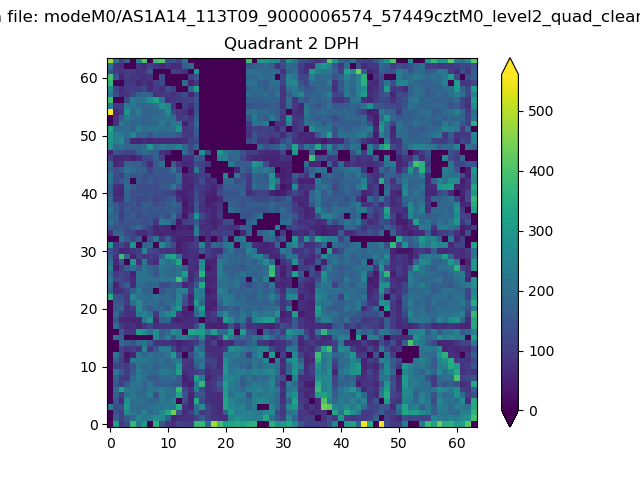 |
Quadrant C |
| Plot type | Count rate plots | Images |
|---|---|---|
| Comparison with Poisson distribution Blue bars denote a histogram of data divided into 1 sec bins. Red curve is a Poisson curve with rate = median count rate of data. |
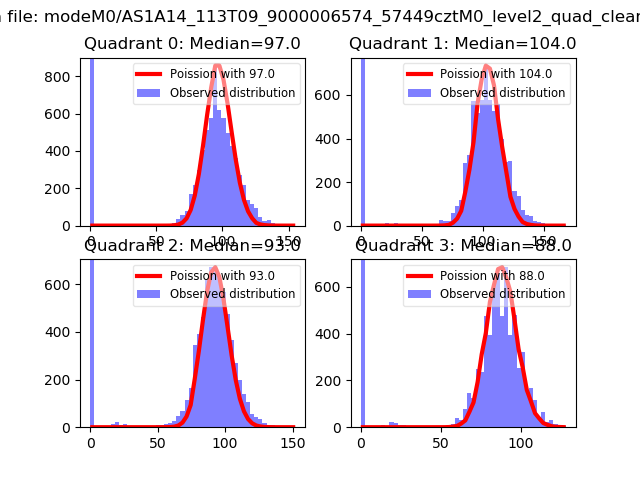 |
 |
| Quadrant-wise count rates Data is divided into 100 sec bins |
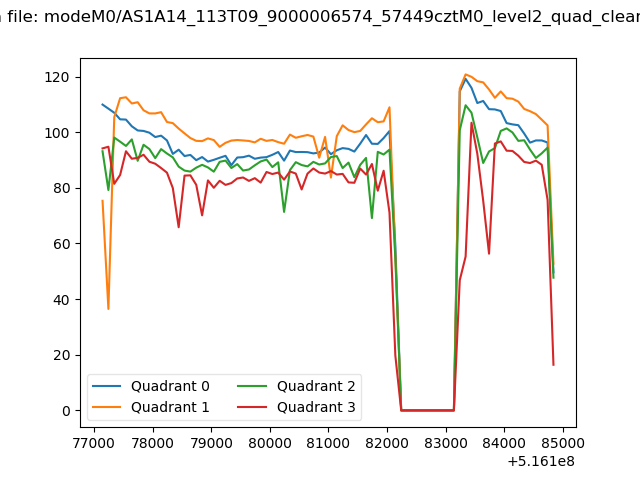 |
|
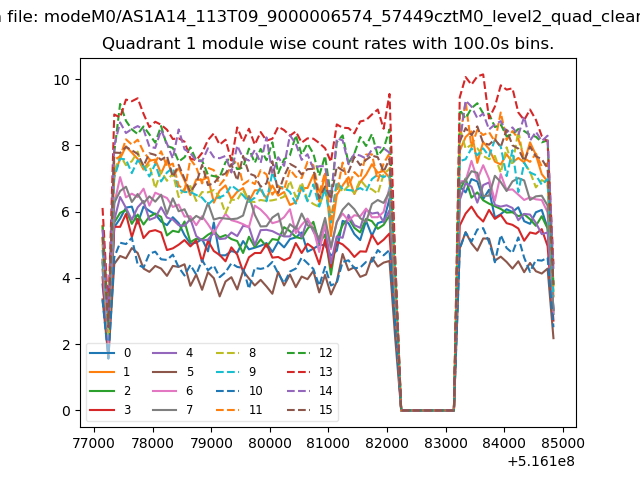
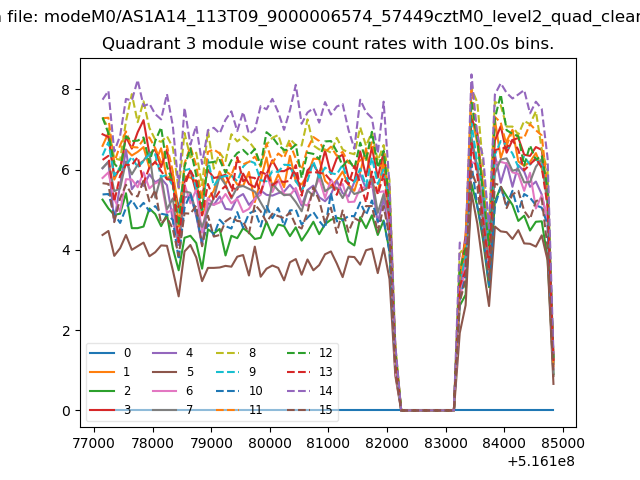
| Module-wise count rates for Quadrant A Data is divided into 100 sec bins |
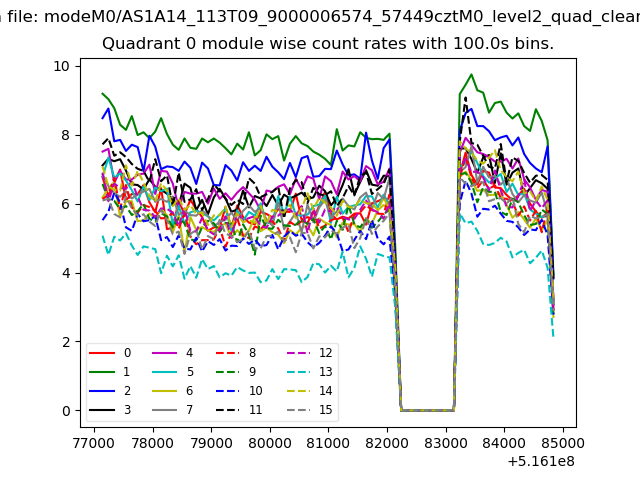 |
 |
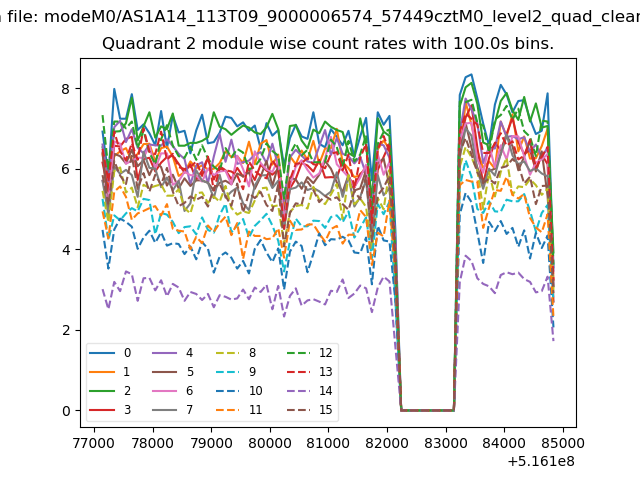
| Module-wise count rates for Quadrant B Data is divided into 100 sec bins |
 |
 |
| Module-wise count rates for Quadrant C Data is divided into 100 sec bins |
 |
 |
| Module-wise count rates for Quadrant D Data is divided into 100 sec bins |
 |
 |
| Parameter | Plot |
|---|---|
| CZT HV Monitor | 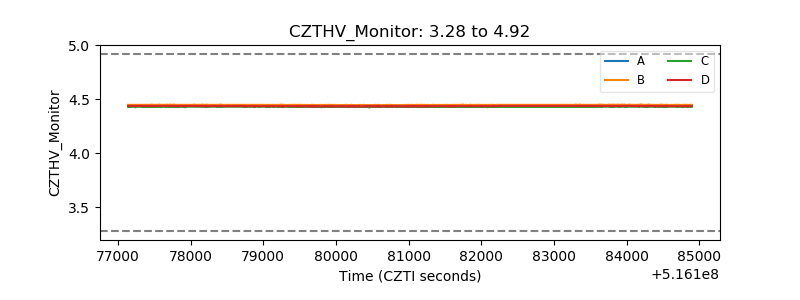 |
| D_VDD | 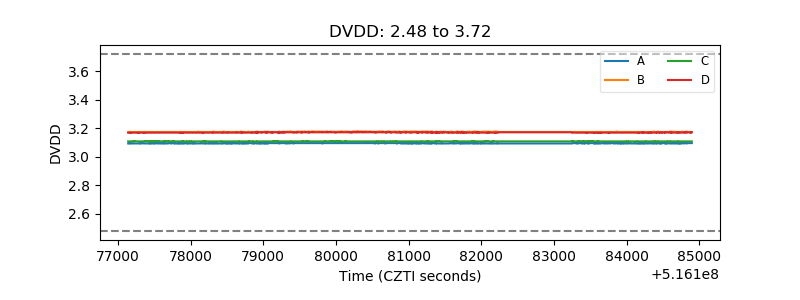 |
| Temperature 1 | 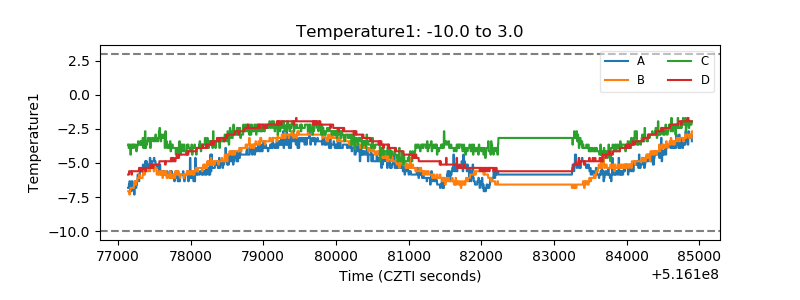 |
| Veto HV Monitor | 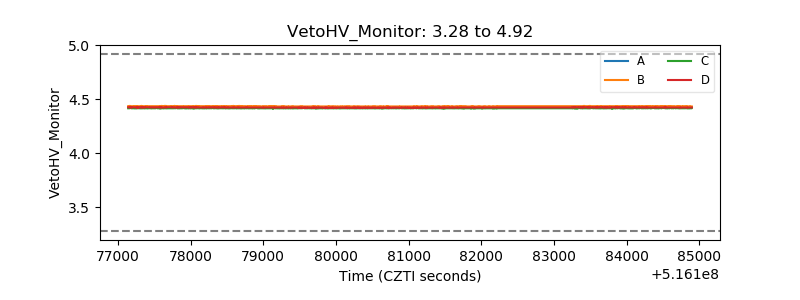 |
| Veto LLD | 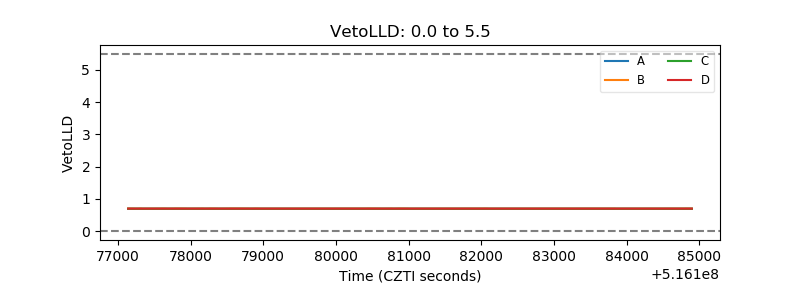 |
| Alpha Counter | 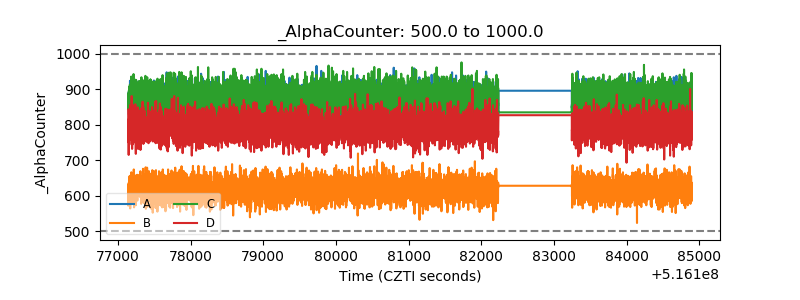 |
| _CPM_Rate | 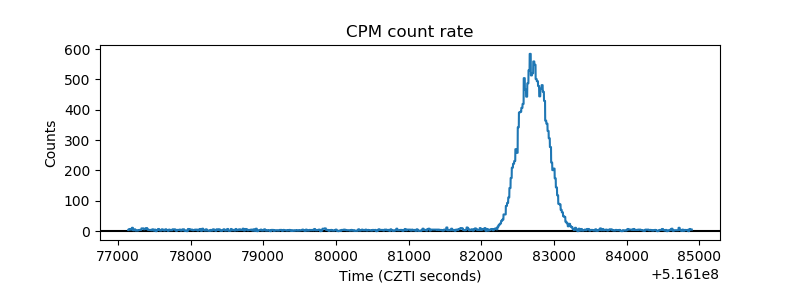 |
| CZT Counter | 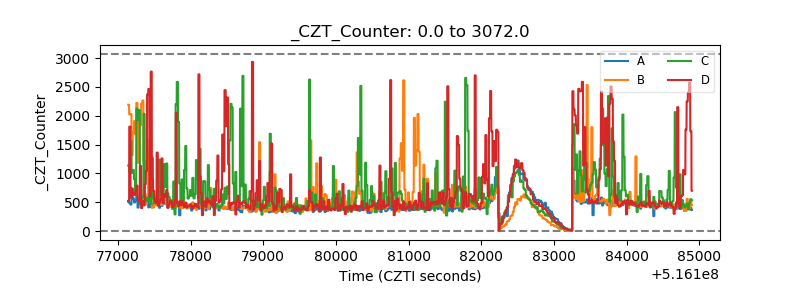 |
| +2.5 Volts monitor |  |
| +5 Volts monitor |  |
| _ROLL_ROT | 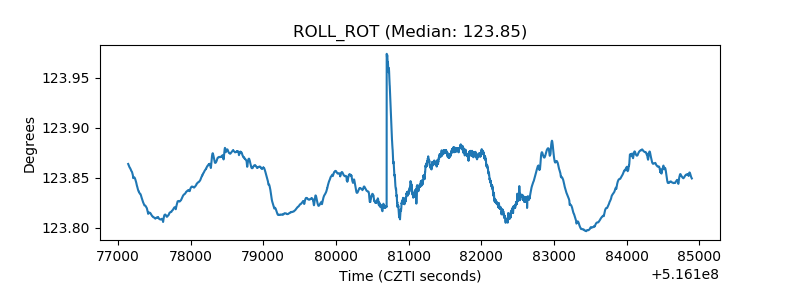 |
| _Roll_DEC | 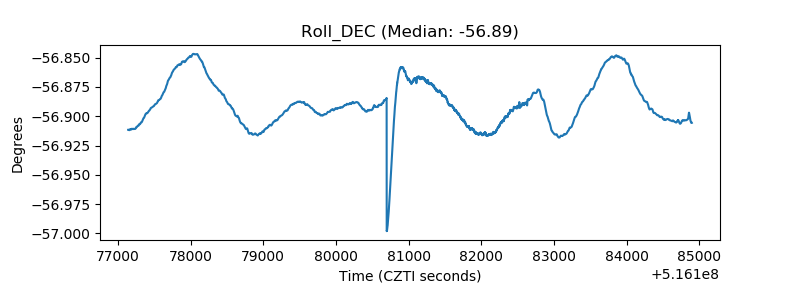 |
| _Roll_RA | 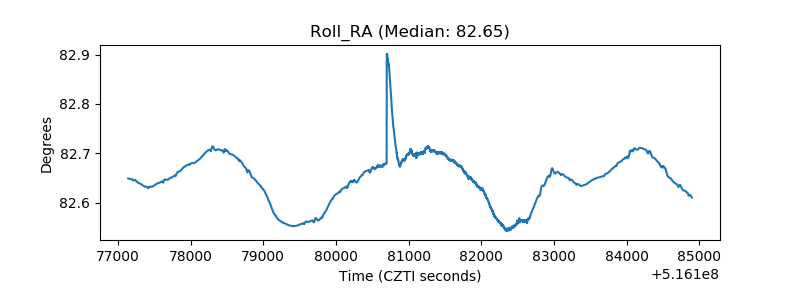 |
| Veto Counter | 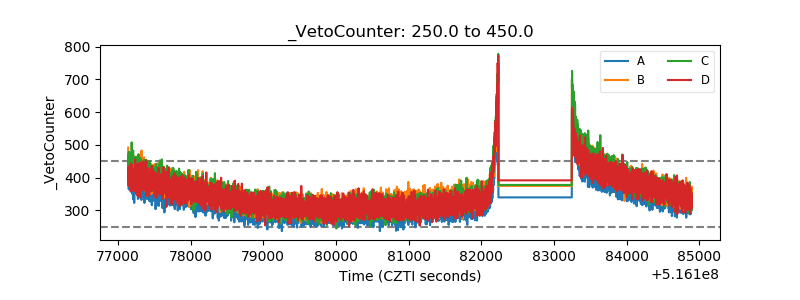 |