| Param | Original file | Final file |
|---|---|---|
| Filename | modeM0/AS1A14_113T09_9000006574_57450cztM0_level2.fits | modeM0/AS1A14_113T09_9000006574_57450cztM0_level2_quad_clean.evt |
| Size (bytes) | 414,270,720 | 87,252,480 |
| Size | 395.1 MB | 83.2 MB |
| Events in quadrant A | 2,715,926 | 584,290 |
| Events in quadrant B | 4,027,284 | 590,583 |
| Events in quadrant C | 3,866,541 | 545,352 |
| Events in quadrant D | 4,265,603 | 509,180 |
| Mode SS | |||
|---|---|---|---|
| Quadrant | BADHDUFLAG | Total packets | Discarded packets |
| A | 0 | 120 | 0 |
| B | 0 | 120 | 0 |
| C | 0 | 120 | 0 |
| D | 0 | 120 | 0 |
| Mode M9 | |||
|---|---|---|---|
| Quadrant | BADHDUFLAG | Total packets | Discarded packets |
| A | 0 | 11 | 0 |
| B | 0 | 11 | 0 |
| C | 0 | 11 | 0 |
| D | 0 | 11 | 0 |
| Mode M0 | |||
|---|---|---|---|
| Quadrant | BADHDUFLAG | Total packets | Discarded packets |
| A | 0 | 12353 | 1 |
| B | 0 | 16024 | 1 |
| C | 0 | 15467 | 1 |
| D | 0 | 16814 | 1 |
| Quadrant | Total seconds | Saturated seconds | Saturation percentage |
|---|---|---|---|
| A | 5906 | 60 | 1.015916% |
| B | 5907 | 494 | 8.362959% |
| C | 5907 | 231 | 3.910615% |
| D | 5907 | 330 | 5.586592% |
Noise dominated data is calculated using 1-second bins in cleaned event files. If a bin has >2000 counts, and if more than 50% of those come from <1% of pixels, then it is considered to be noise-dominated and hence unusable.
| Quadrant | # 1 sec bins | Bins with >0 counts | Bins with >2000 counts | High rate bins dominated by noise | Noise dominated (total time) | Noise dominated (detector-on time) | Marked lightcurve |
|---|---|---|---|---|---|---|---|
| A | 6997 | 5908 | 2 | 2 | 0.03% | 0.03% | 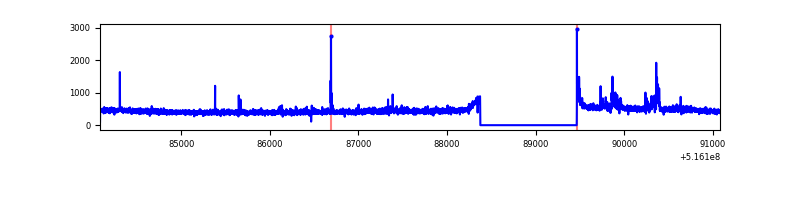 |
| B | 6998 | 5909 | 254 | 254 | 3.63% | 4.30% | 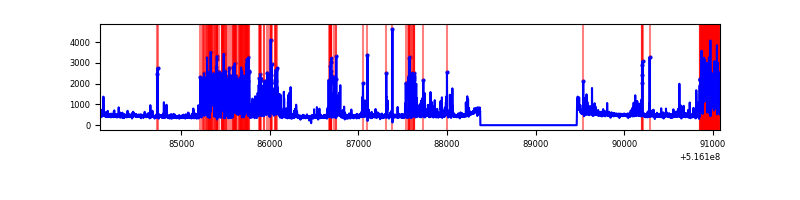 |
| C | 6998 | 5909 | 139 | 139 | 1.99% | 2.35% | 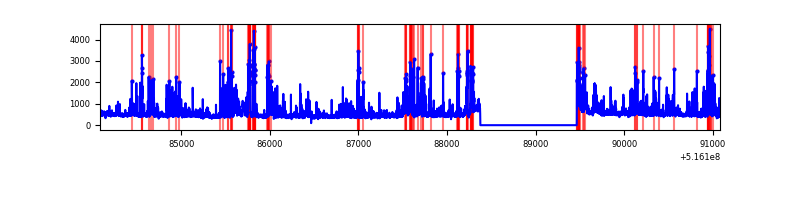 |
| D | 6998 | 5908 | 260 | 260 | 3.72% | 4.40% | 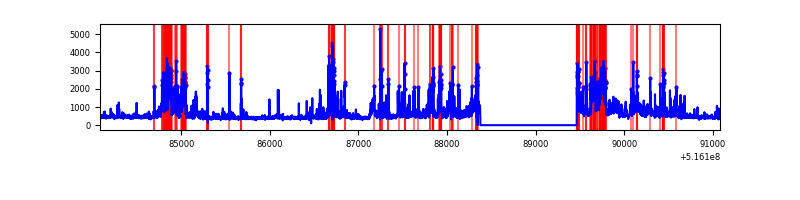 |
Top three noisy pixels from each quadrant. If the there are fewer than three noisy pixels in the level2.evt file, extra rows are filled as -1
| Pixel properties | Quadrant properties | ||||||
|---|---|---|---|---|---|---|---|
| Quadrant | DetID | PixID | Counts | Sigma | Mean | Median | Sigma |
| A | 3 | 14 | 164179 | 1016.55 | 653 | 637 | 160.9 |
| A | 10 | 251 | 11369 | 66.71 | 653 | 637 | 160.9 |
| A | 3 | 137 | 7871 | 44.97 | 653 | 637 | 160.9 |
| B | 4 | 206 | 1330508 | 9906.77 | 621 | 598 | 134.2 |
| B | 10 | 247 | 105786 | 783.57 | 621 | 598 | 134.2 |
| B | 7 | 252 | 49446 | 363.88 | 621 | 598 | 134.2 |
| C | 15 | 224 | 1058575 | 6267.21 | 619 | 611 | 168.8 |
| C | 1 | 16 | 155074 | 915.01 | 619 | 611 | 168.8 |
| C | 13 | 3 | 69126 | 405.87 | 619 | 611 | 168.8 |
| D | 15 | 142 | 860746 | 4932.0 | 617 | 588 | 174.4 |
| D | 7 | 96 | 357306 | 2045.36 | 617 | 588 | 174.4 |
| D | 8 | 240 | 199228 | 1138.96 | 617 | 588 | 174.4 |
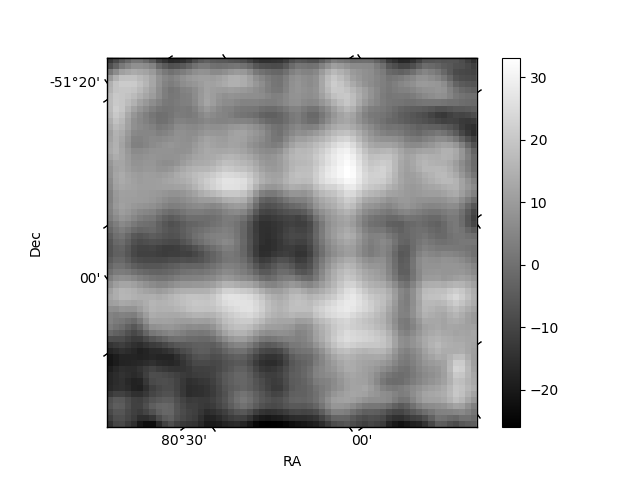
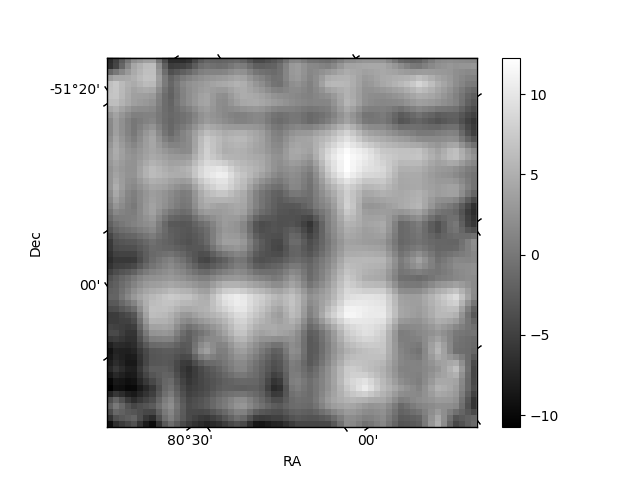
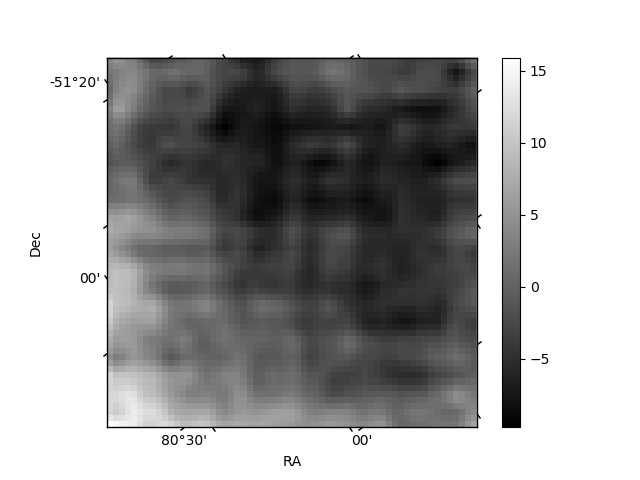
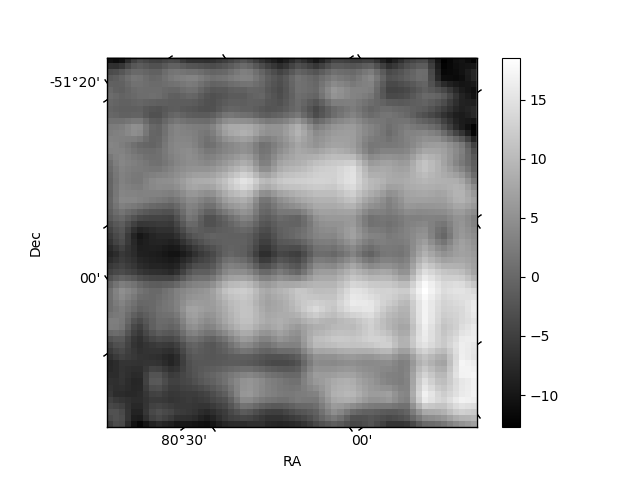
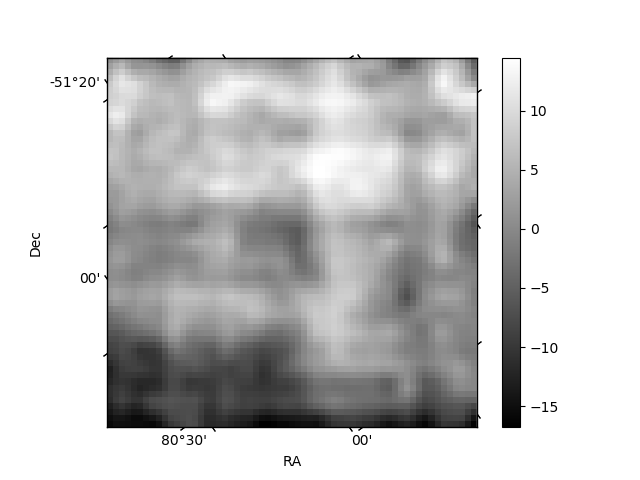
Histogram calculated using DETX and DETY for each event in the final _common_clean file
| Quadrant A | 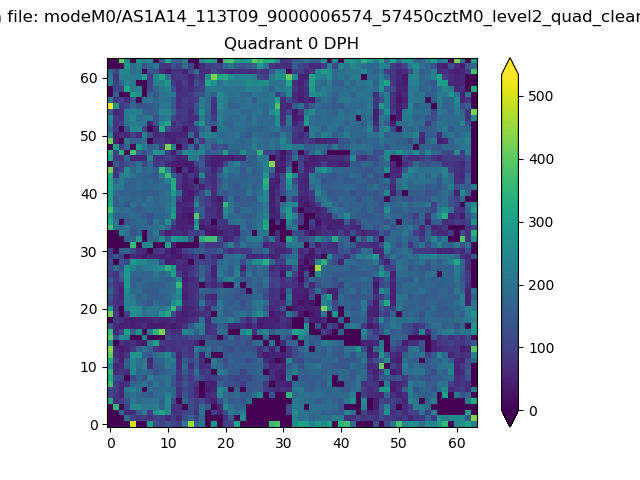 |
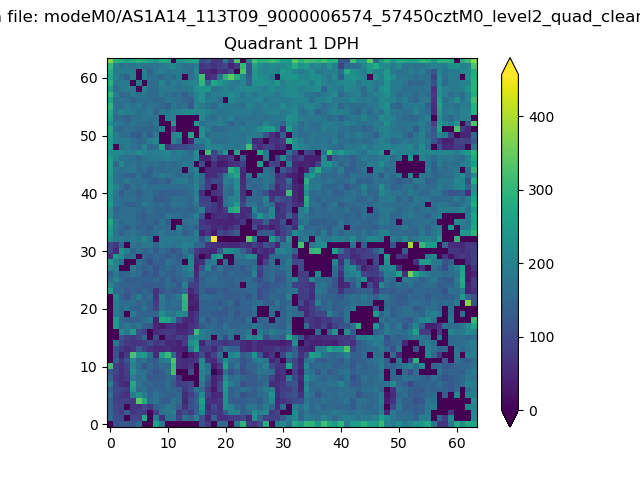 |
Quadrant B |
|---|---|---|---|
| Quadrant D | 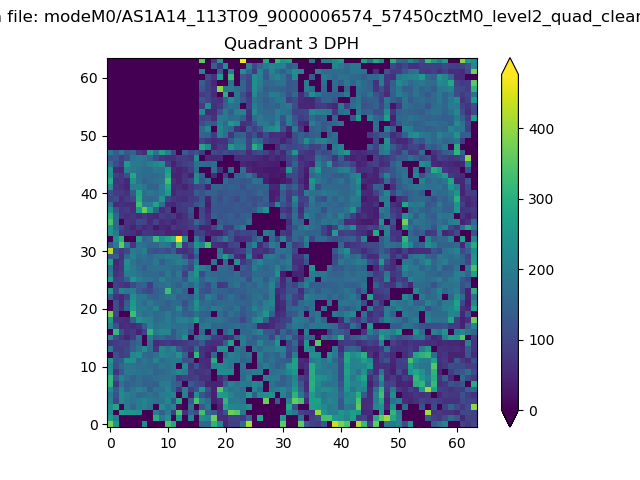 |
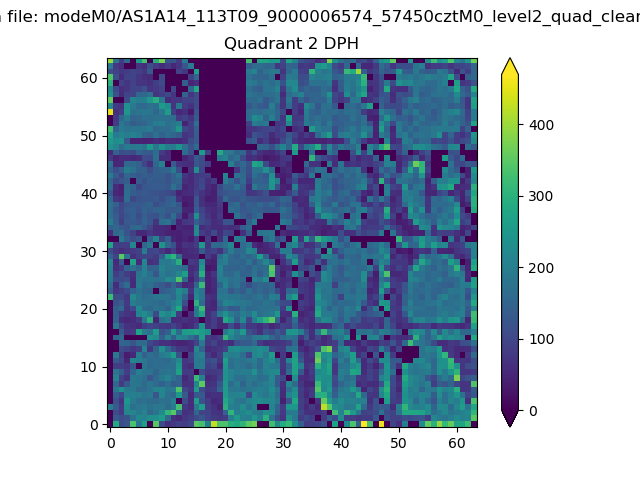 |
Quadrant C |
| Plot type | Count rate plots | Images |
|---|---|---|
| Comparison with Poisson distribution Blue bars denote a histogram of data divided into 1 sec bins. Red curve is a Poisson curve with rate = median count rate of data. |
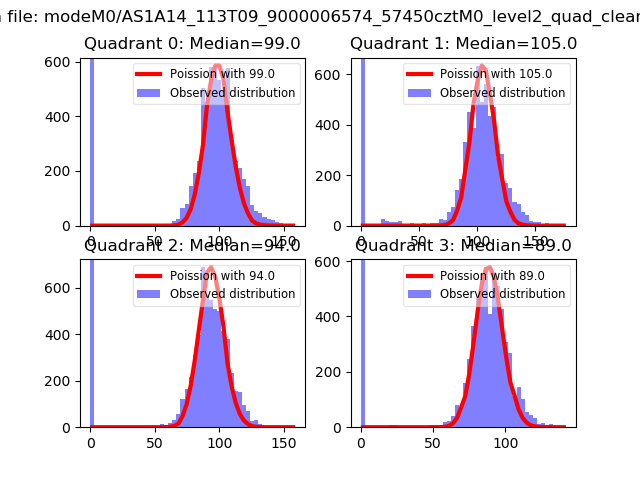 |
 |
| Quadrant-wise count rates Data is divided into 100 sec bins |
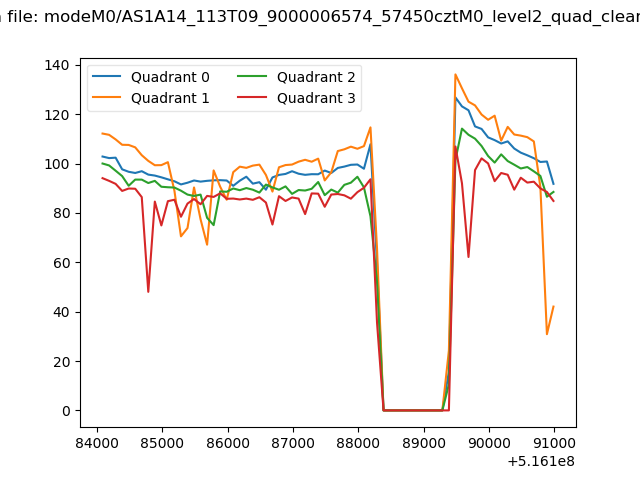 |
|
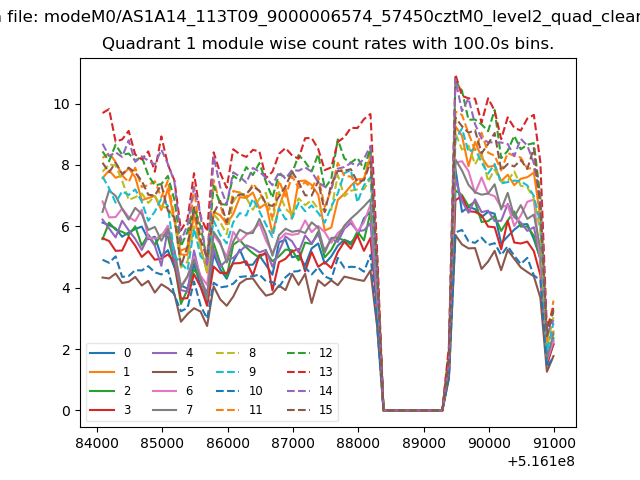
| Module-wise count rates for Quadrant A Data is divided into 100 sec bins |
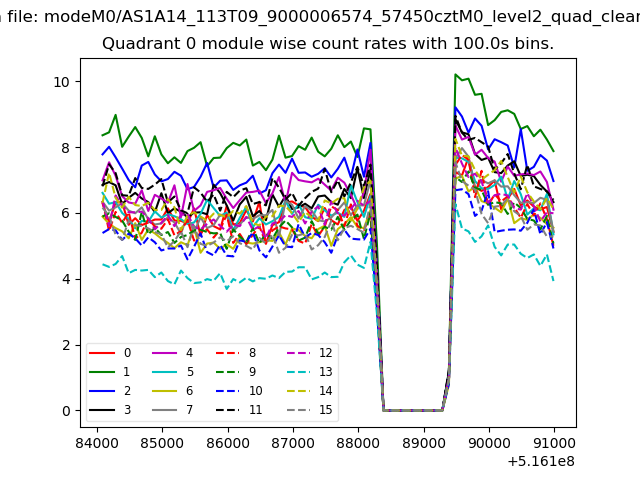 |
 |
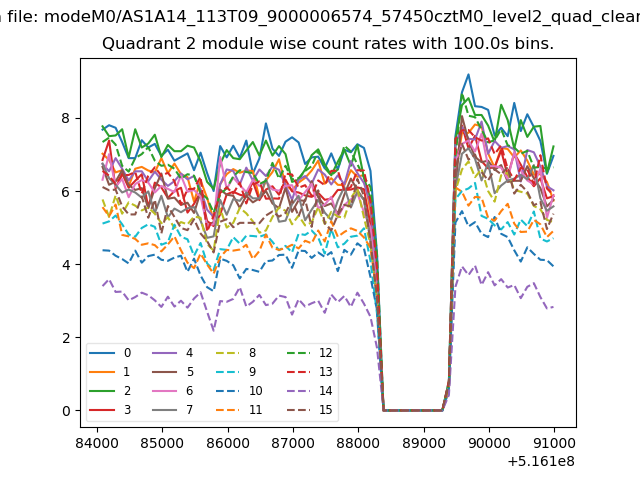
| Module-wise count rates for Quadrant B Data is divided into 100 sec bins |
 |
 |
| Module-wise count rates for Quadrant C Data is divided into 100 sec bins |
 |
 |
| Module-wise count rates for Quadrant D Data is divided into 100 sec bins |
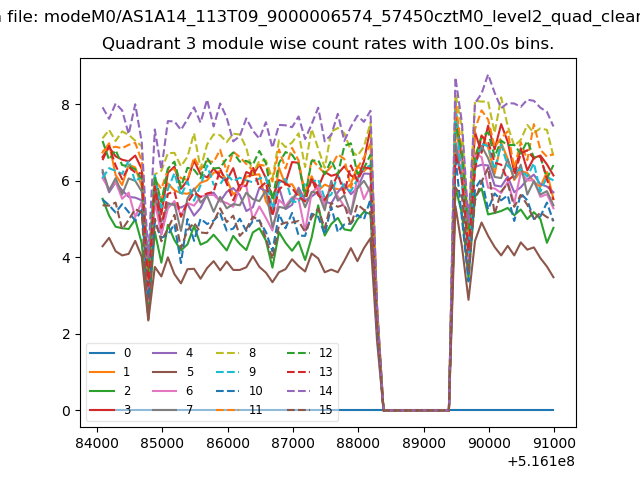 |
 |
| Parameter | Plot |
|---|---|
| CZT HV Monitor | 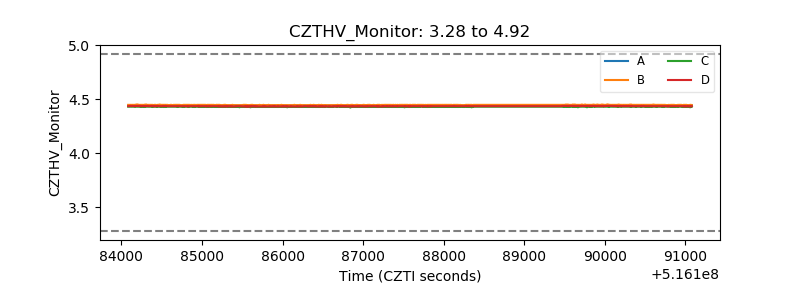 |
| D_VDD | 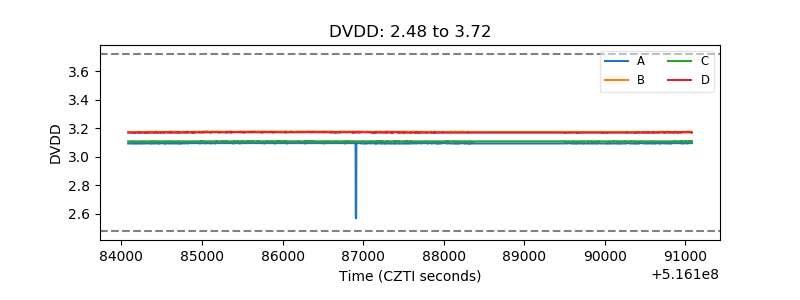 |
| Temperature 1 | 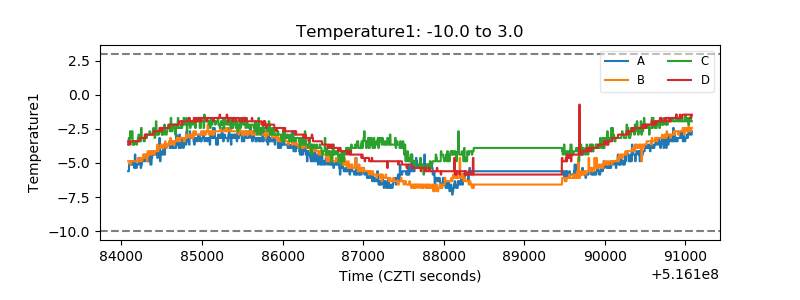 |
| Veto HV Monitor | 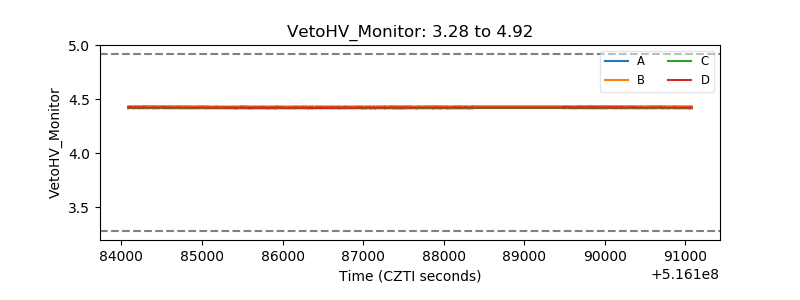 |
| Veto LLD | 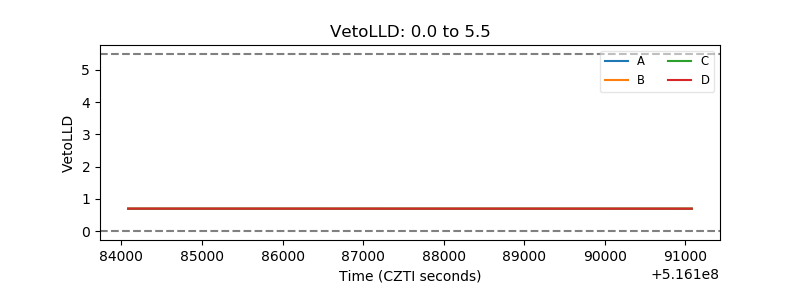 |
| Alpha Counter | 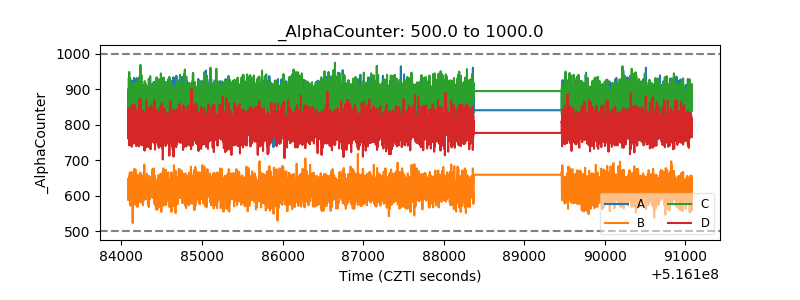 |
| _CPM_Rate | 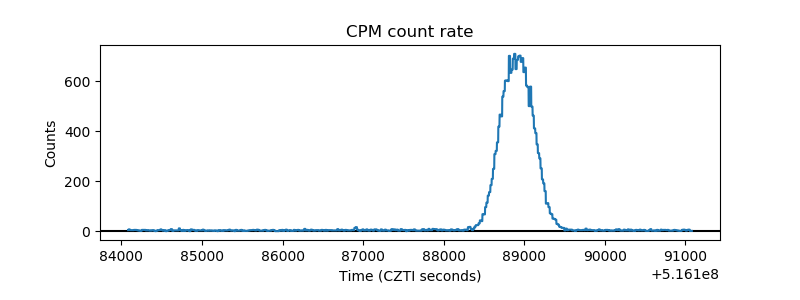 |
| CZT Counter | 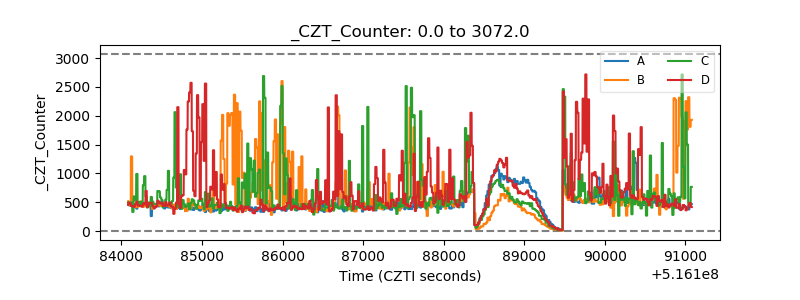 |
| +2.5 Volts monitor | 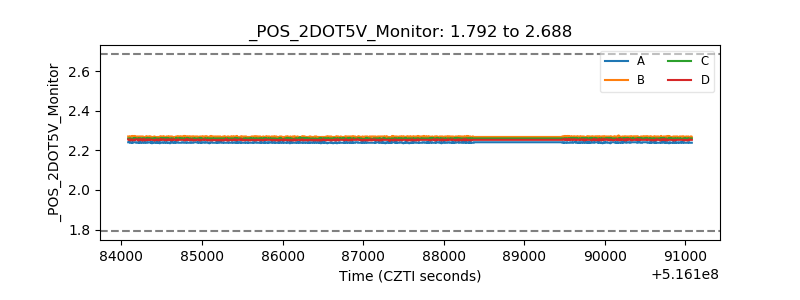 |
| +5 Volts monitor |  |
| _ROLL_ROT | 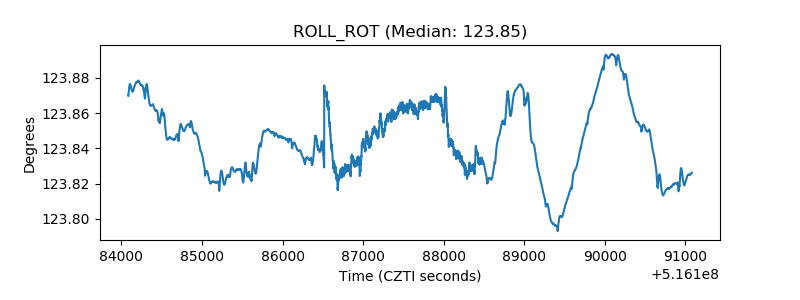 |
| _Roll_DEC | 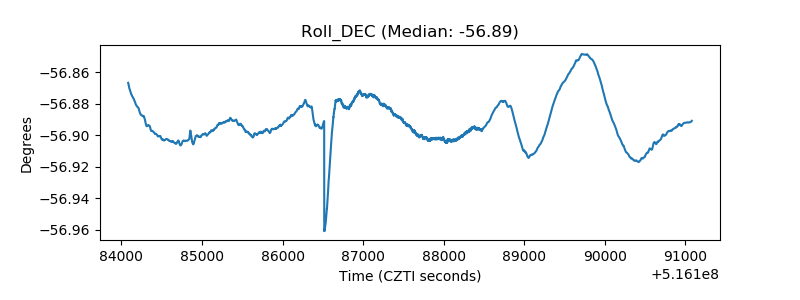 |
| _Roll_RA | 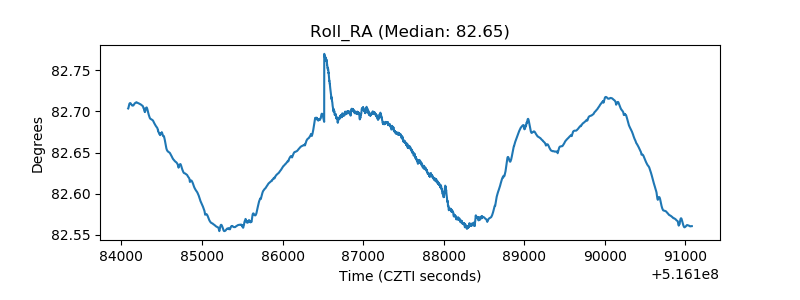 |
| Veto Counter | 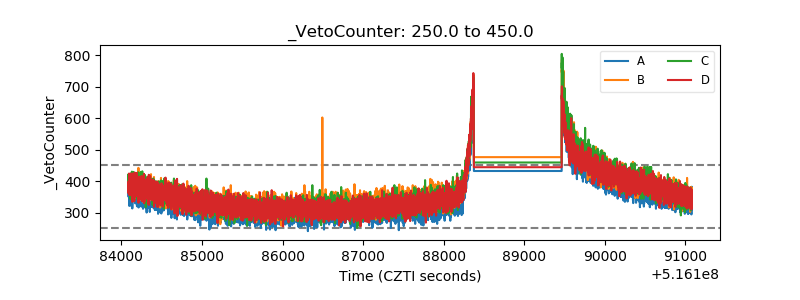 |