| Param | Original file | Final file |
|---|---|---|
| Filename | modeM0/AS1A14_113T09_9000006574_57452cztM0_level2.fits | modeM0/AS1A14_113T09_9000006574_57452cztM0_level2_quad_clean.evt |
| Size (bytes) | 455,483,520 | 85,688,640 |
| Size | 434.4 MB | 81.7 MB |
| Events in quadrant A | 4,166,550 | 564,976 |
| Events in quadrant B | 4,091,507 | 586,882 |
| Events in quadrant C | 4,774,097 | 510,346 |
| Events in quadrant D | 3,371,777 | 522,452 |
| Mode SS | |||
|---|---|---|---|
| Quadrant | BADHDUFLAG | Total packets | Discarded packets |
| A | 0 | 120 | 0 |
| B | 0 | 120 | 0 |
| C | 0 | 120 | 0 |
| D | 0 | 120 | 0 |
| Mode M9 | |||
|---|---|---|---|
| Quadrant | BADHDUFLAG | Total packets | Discarded packets |
| A | 0 | 12 | 0 |
| B | 0 | 12 | 0 |
| C | 0 | 12 | 0 |
| D | 0 | 12 | 0 |
| Mode M0 | |||
|---|---|---|---|
| Quadrant | BADHDUFLAG | Total packets | Discarded packets |
| A | 0 | 16613 | 1 |
| B | 0 | 16294 | 1 |
| C | 0 | 18311 | 1 |
| D | 0 | 14080 | 1 |
| Quadrant | Total seconds | Saturated seconds | Saturation percentage |
|---|---|---|---|
| A | 5870 | 397 | 6.763203% |
| B | 5871 | 522 | 8.891160% |
| C | 5871 | 574 | 9.776869% |
| D | 5871 | 118 | 2.009879% |
Noise dominated data is calculated using 1-second bins in cleaned event files. If a bin has >2000 counts, and if more than 50% of those come from <1% of pixels, then it is considered to be noise-dominated and hence unusable.
| Quadrant | # 1 sec bins | Bins with >0 counts | Bins with >2000 counts | High rate bins dominated by noise | Noise dominated (total time) | Noise dominated (detector-on time) | Marked lightcurve |
|---|---|---|---|---|---|---|---|
| A | 7005 | 5872 | 410 | 410 | 5.85% | 6.98% | 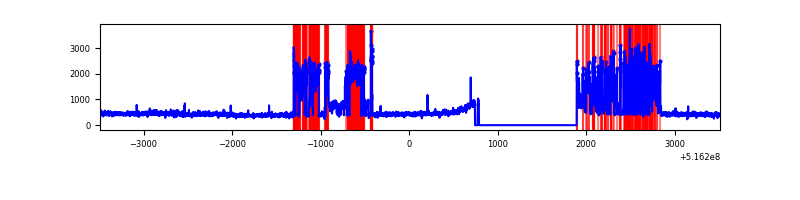 |
| B | 7006 | 5873 | 247 | 247 | 3.53% | 4.21% | 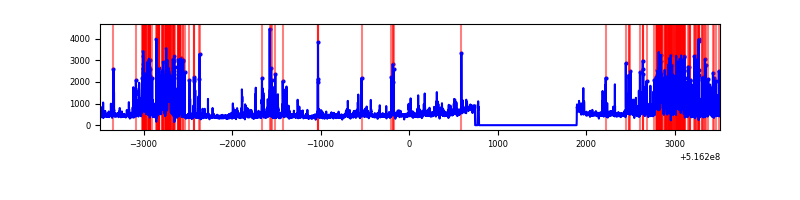 |
| C | 7006 | 5872 | 378 | 378 | 5.40% | 6.44% | 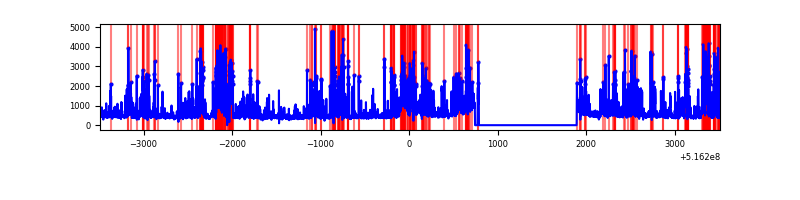 |
| D | 7006 | 5873 | 64 | 64 | 0.91% | 1.09% | 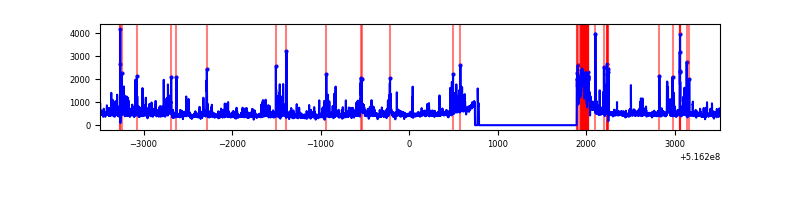 |
Top three noisy pixels from each quadrant. If the there are fewer than three noisy pixels in the level2.evt file, extra rows are filled as -1
| Pixel properties | Quadrant properties | ||||||
|---|---|---|---|---|---|---|---|
| Quadrant | DetID | PixID | Counts | Sigma | Mean | Median | Sigma |
| A | 0 | 12 | 1575400 | 9961.18 | 640 | 624 | 158.1 |
| A | 3 | 14 | 61907 | 387.64 | 640 | 624 | 158.1 |
| A | 13 | 153 | 35583 | 221.13 | 640 | 624 | 158.1 |
| B | 4 | 206 | 1194061 | 9035.37 | 616 | 594 | 132.1 |
| B | 5 | 185 | 174239 | 1314.61 | 616 | 594 | 132.1 |
| B | 10 | 247 | 85647 | 643.91 | 616 | 594 | 132.1 |
| C | 15 | 224 | 2225206 | 13707.97 | 591 | 584 | 162.3 |
| C | 1 | 16 | 54536 | 332.45 | 591 | 584 | 162.3 |
| C | 14 | 254 | 45648 | 277.68 | 591 | 584 | 162.3 |
| D | 15 | 142 | 204924 | 1162.99 | 621 | 593 | 175.7 |
| D | 2 | 249 | 203105 | 1152.64 | 621 | 593 | 175.7 |
| D | 8 | 240 | 175936 | 998.0 | 621 | 593 | 175.7 |
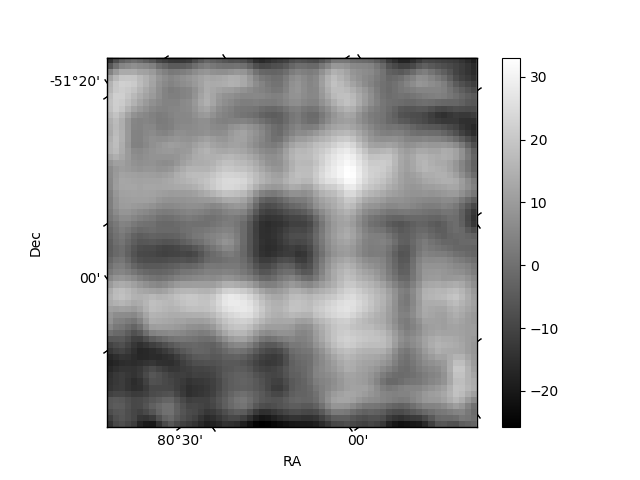
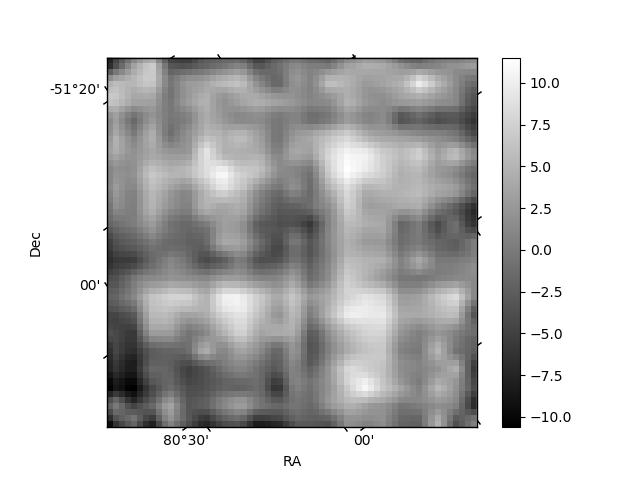
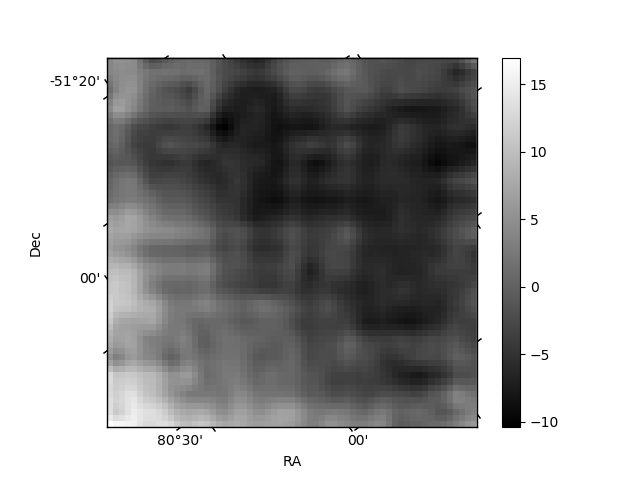
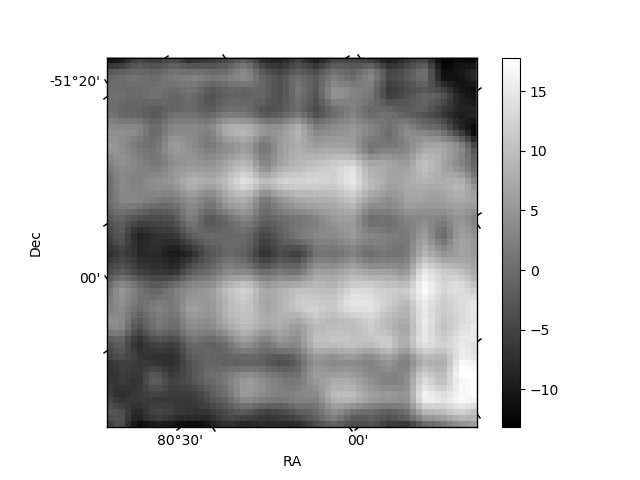
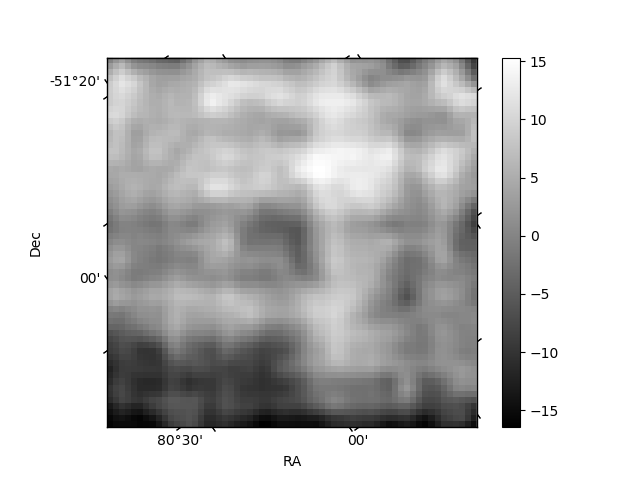
Histogram calculated using DETX and DETY for each event in the final _common_clean file
| Quadrant A | 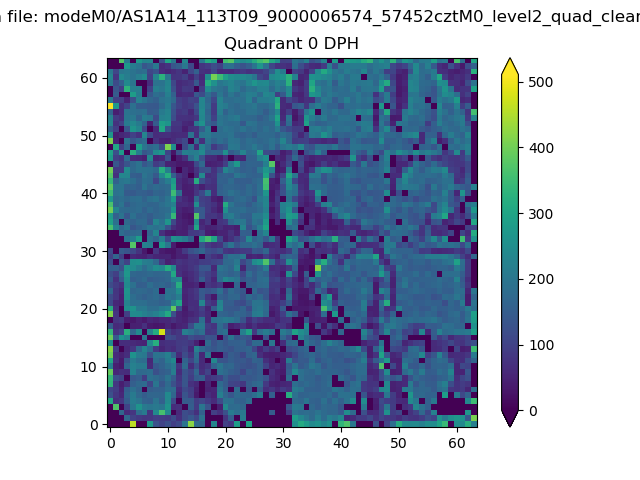 |
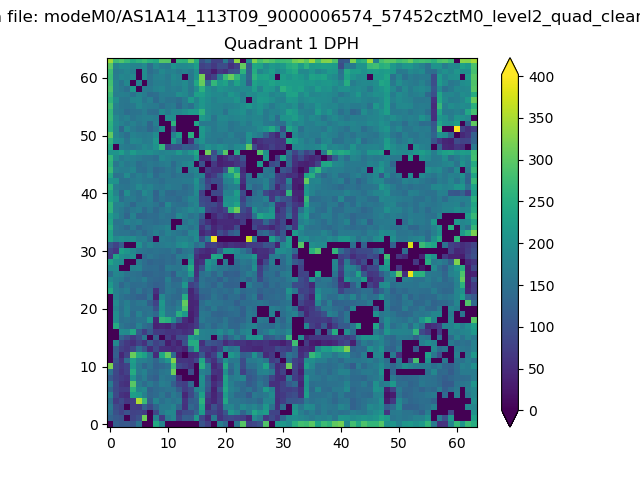 |
Quadrant B |
|---|---|---|---|
| Quadrant D | 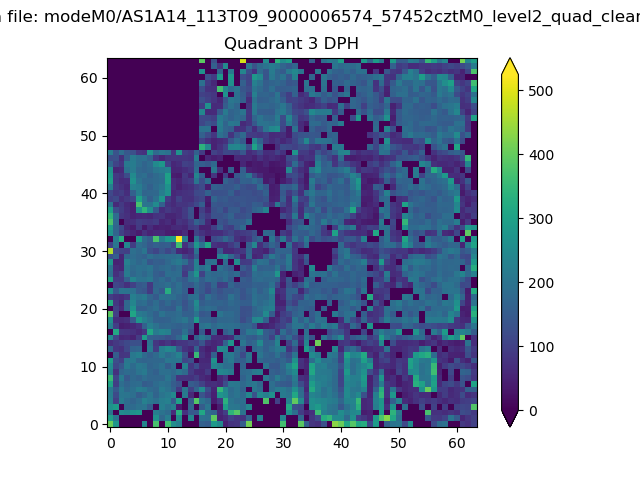 |
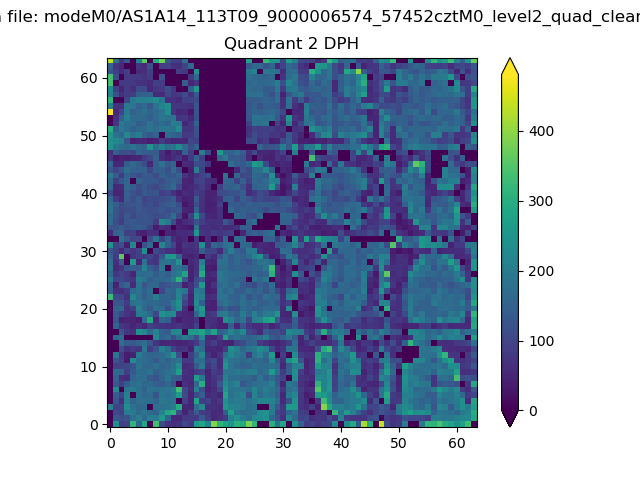 |
Quadrant C |
| Plot type | Count rate plots | Images |
|---|---|---|
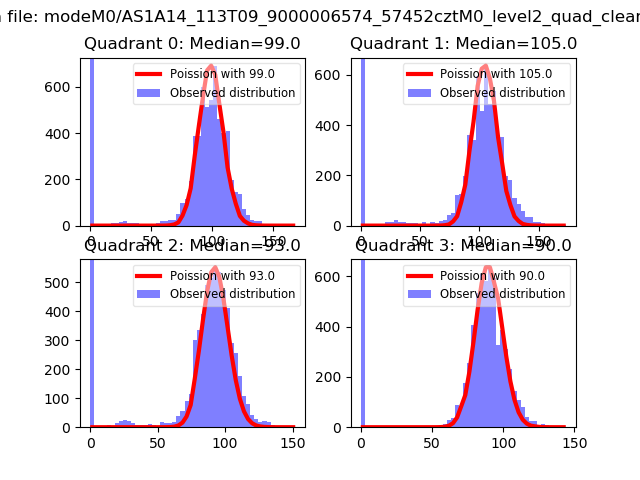
| Comparison with Poisson distribution Blue bars denote a histogram of data divided into 1 sec bins. Red curve is a Poisson curve with rate = median count rate of data. |
 |
 |
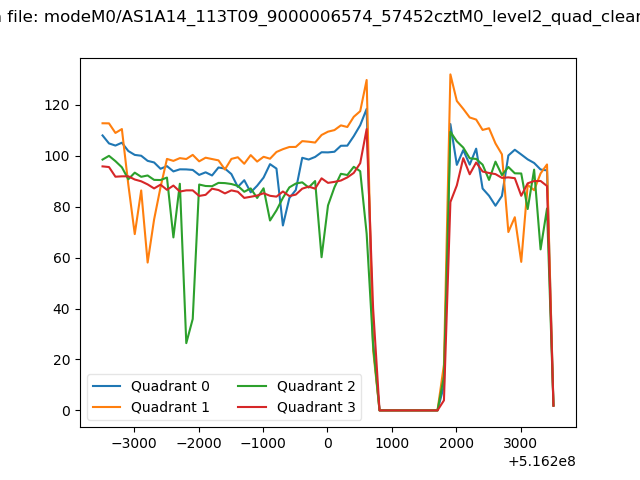
| Quadrant-wise count rates Data is divided into 100 sec bins |
 |
|
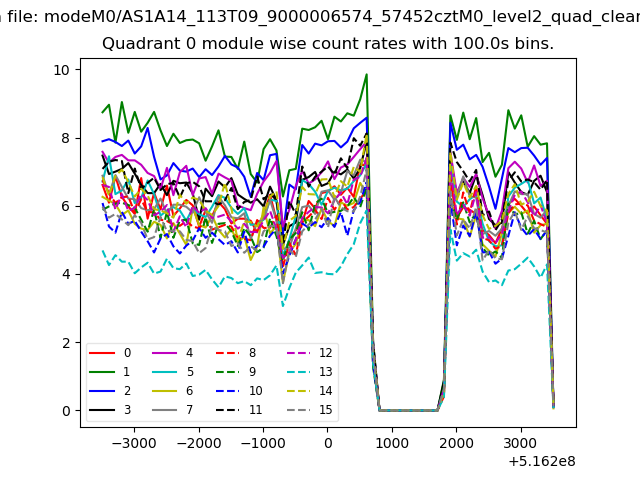
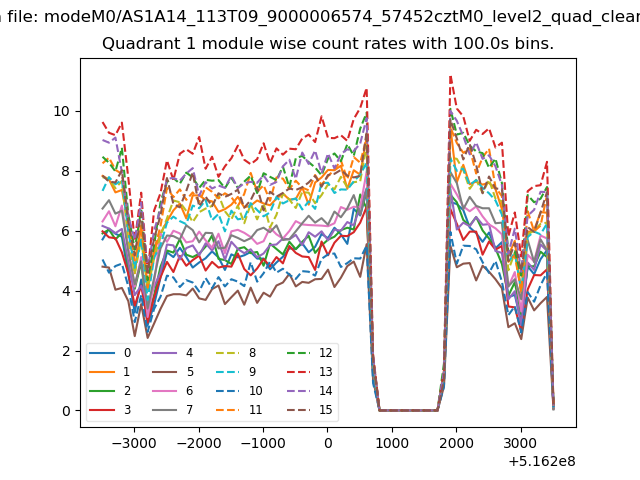
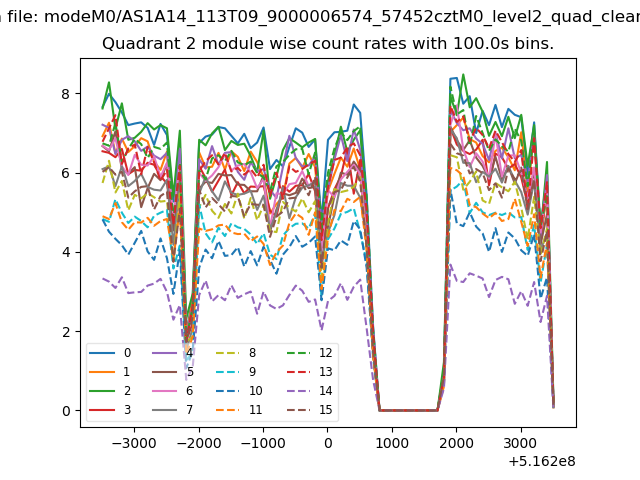
| Module-wise count rates for Quadrant A Data is divided into 100 sec bins |
 |
 |
| Module-wise count rates for Quadrant B Data is divided into 100 sec bins |
 |
 |
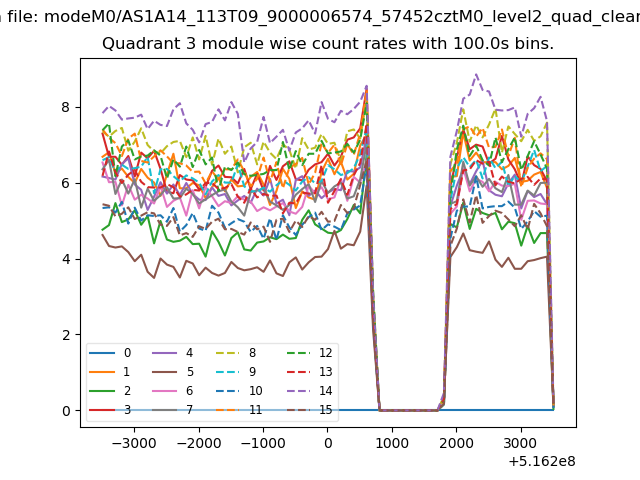
| Module-wise count rates for Quadrant C Data is divided into 100 sec bins |
 |
 |
| Module-wise count rates for Quadrant D Data is divided into 100 sec bins |
 |
 |
| Parameter | Plot |
|---|---|
| CZT HV Monitor | 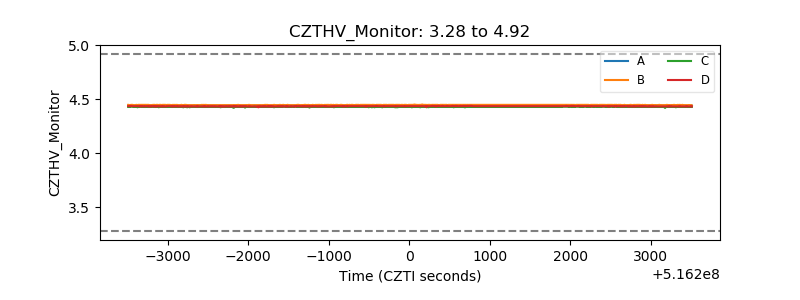 |
| D_VDD | 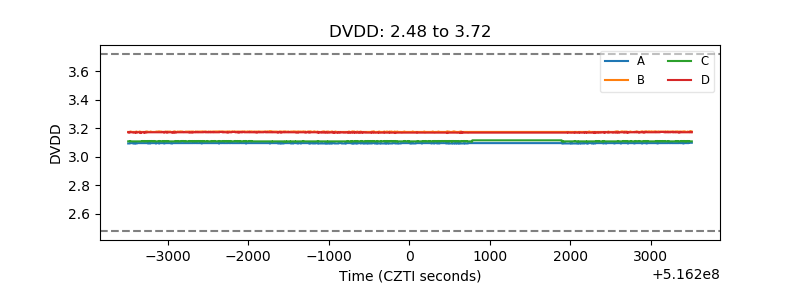 |
| Temperature 1 | 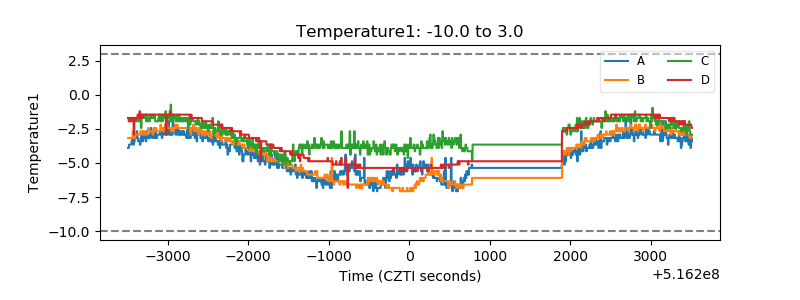 |
| Veto HV Monitor | 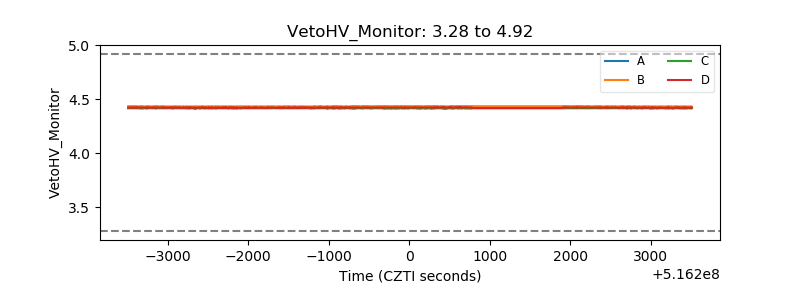 |
| Veto LLD | 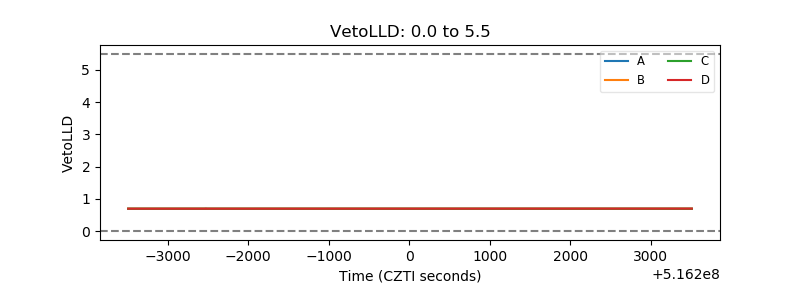 |
| Alpha Counter | 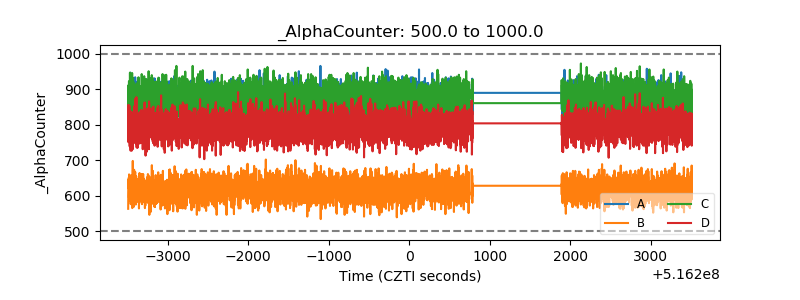 |
| _CPM_Rate | 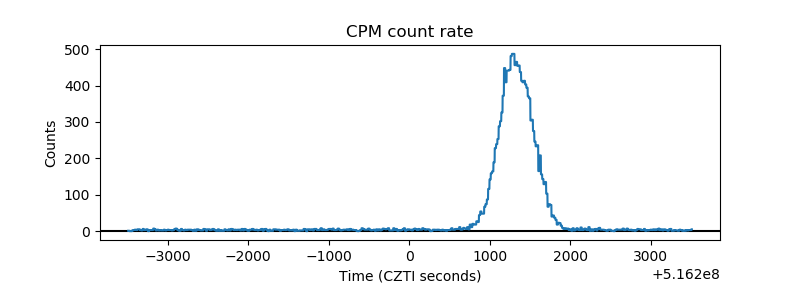 |
| CZT Counter | 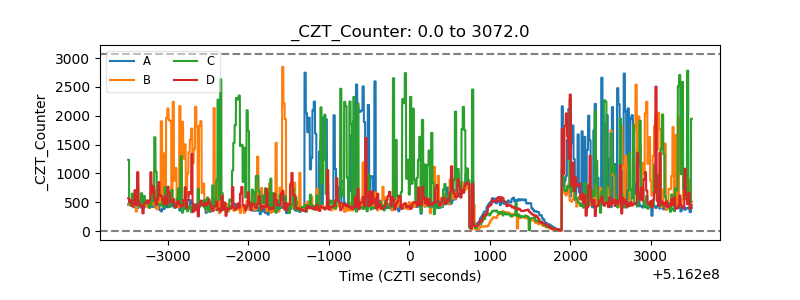 |
| +2.5 Volts monitor |  |
| +5 Volts monitor |  |
| _ROLL_ROT | 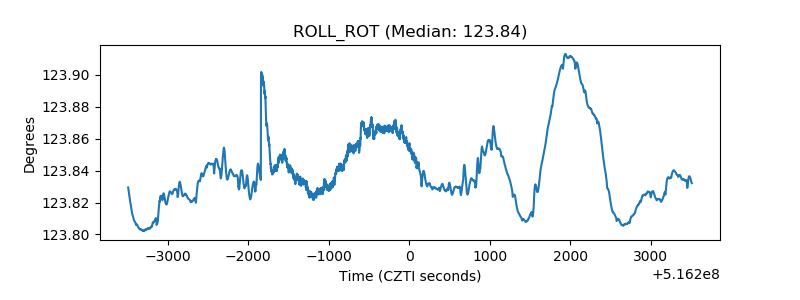 |
| _Roll_DEC | 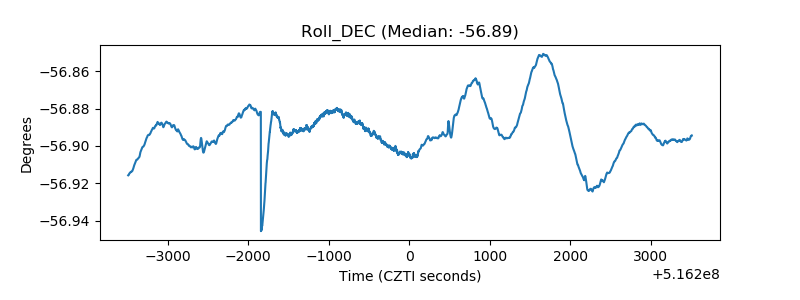 |
| _Roll_RA | 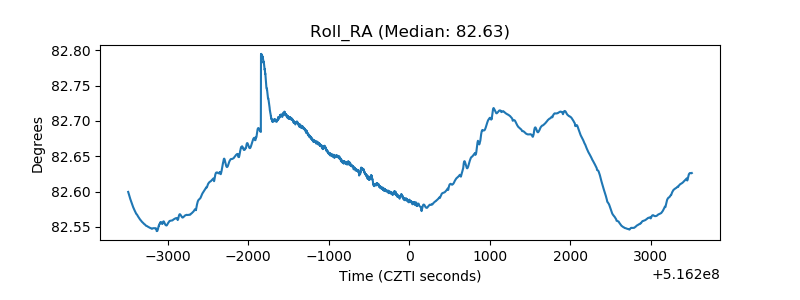 |
| Veto Counter | 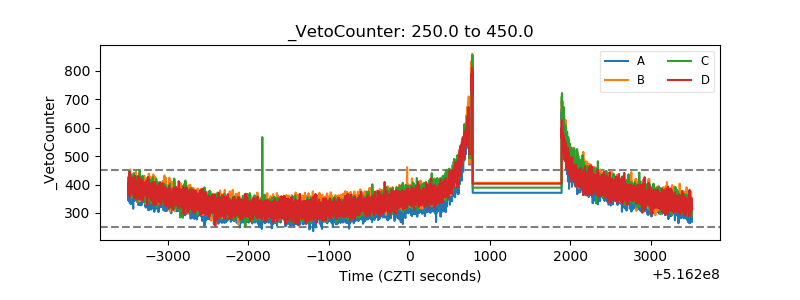 |