| Param | Original file | Final file |
|---|---|---|
| Filename | modeM0/AS1A14_113T09_9000006574_57453cztM0_level2.fits | modeM0/AS1A14_113T09_9000006574_57453cztM0_level2_quad_clean.evt |
| Size (bytes) | 436,567,680 | 84,562,560 |
| Size | 416.3 MB | 80.6 MB |
| Events in quadrant A | 2,897,269 | 571,205 |
| Events in quadrant B | 4,474,635 | 561,750 |
| Events in quadrant C | 5,018,569 | 501,100 |
| Events in quadrant D | 3,312,616 | 515,466 |
| Mode SS | |||
|---|---|---|---|
| Quadrant | BADHDUFLAG | Total packets | Discarded packets |
| A | 0 | 120 | 0 |
| B | 0 | 120 | 0 |
| C | 0 | 120 | 0 |
| D | 0 | 120 | 0 |
| Mode M9 | |||
|---|---|---|---|
| Quadrant | BADHDUFLAG | Total packets | Discarded packets |
| A | 0 | 10 | 0 |
| B | 0 | 10 | 0 |
| C | 0 | 10 | 0 |
| D | 0 | 10 | 0 |
| Mode M0 | |||
|---|---|---|---|
| Quadrant | BADHDUFLAG | Total packets | Discarded packets |
| A | 0 | 13023 | 1 |
| B | 0 | 17467 | 1 |
| C | 0 | 19097 | 1 |
| D | 0 | 13896 | 1 |
| Quadrant | Total seconds | Saturated seconds | Saturation percentage |
|---|---|---|---|
| A | 5879 | 100 | 1.700970% |
| B | 5878 | 672 | 11.432460% |
| C | 5878 | 597 | 10.156516% |
| D | 5878 | 114 | 1.939435% |
Noise dominated data is calculated using 1-second bins in cleaned event files. If a bin has >2000 counts, and if more than 50% of those come from <1% of pixels, then it is considered to be noise-dominated and hence unusable.
| Quadrant | # 1 sec bins | Bins with >0 counts | Bins with >2000 counts | High rate bins dominated by noise | Noise dominated (total time) | Noise dominated (detector-on time) | Marked lightcurve |
|---|---|---|---|---|---|---|---|
| A | 6904 | 5880 | 42 | 42 | 0.61% | 0.71% | 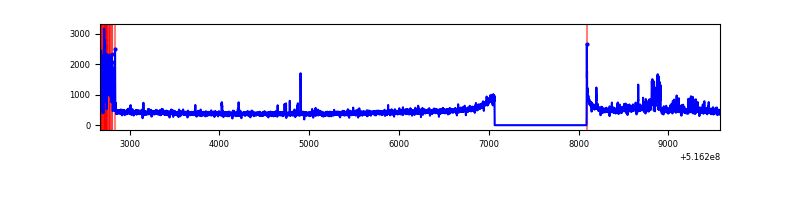 |
| B | 6903 | 5879 | 315 | 315 | 4.56% | 5.36% | 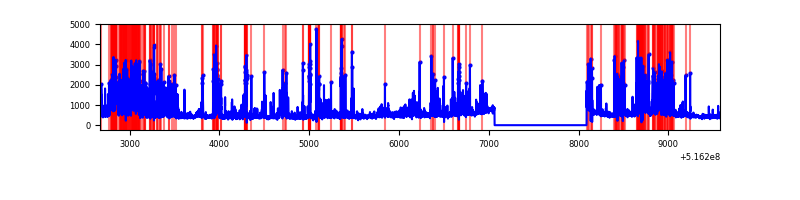 |
| C | 6903 | 5879 | 490 | 490 | 7.10% | 8.33% | 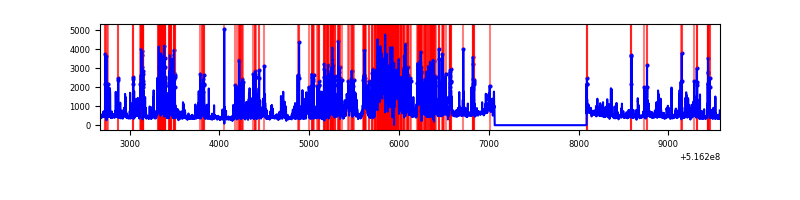 |
| D | 6903 | 5879 | 80 | 80 | 1.16% | 1.36% | 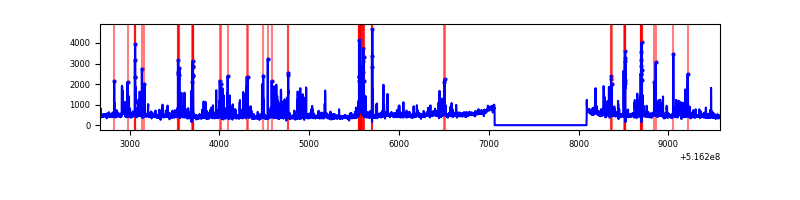 |
Top three noisy pixels from each quadrant. If the there are fewer than three noisy pixels in the level2.evt file, extra rows are filled as -1
| Pixel properties | Quadrant properties | ||||||
|---|---|---|---|---|---|---|---|
| Quadrant | DetID | PixID | Counts | Sigma | Mean | Median | Sigma |
| A | 0 | 12 | 186580 | 1171.77 | 644 | 627 | 158.7 |
| A | 3 | 14 | 114233 | 715.88 | 644 | 627 | 158.7 |
| A | 4 | 95 | 73948 | 462.03 | 644 | 627 | 158.7 |
| B | 4 | 206 | 1510462 | 11629.54 | 606 | 584 | 129.8 |
| B | 5 | 185 | 214398 | 1646.86 | 606 | 584 | 129.8 |
| B | 10 | 247 | 92477 | 707.79 | 606 | 584 | 129.8 |
| C | 15 | 224 | 2459341 | 15310.41 | 584 | 578 | 160.6 |
| C | 14 | 254 | 104607 | 647.78 | 584 | 578 | 160.6 |
| C | 1 | 16 | 77927 | 481.64 | 584 | 578 | 160.6 |
| D | 8 | 240 | 238771 | 1372.5 | 615 | 586 | 173.5 |
| D | 7 | 96 | 211969 | 1218.05 | 615 | 586 | 173.5 |
| D | 2 | 252 | 95785 | 548.57 | 615 | 586 | 173.5 |
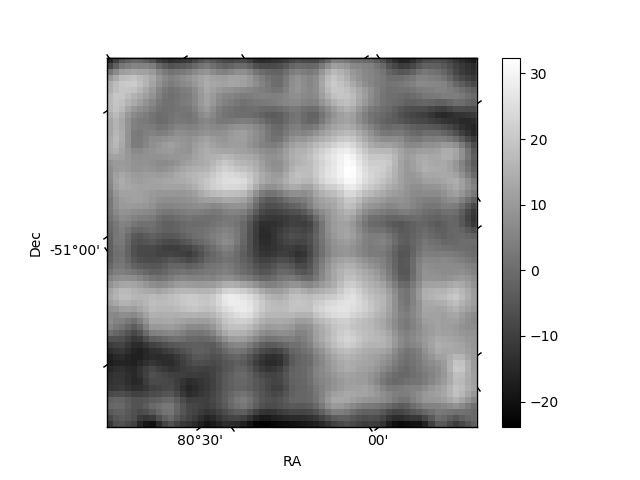
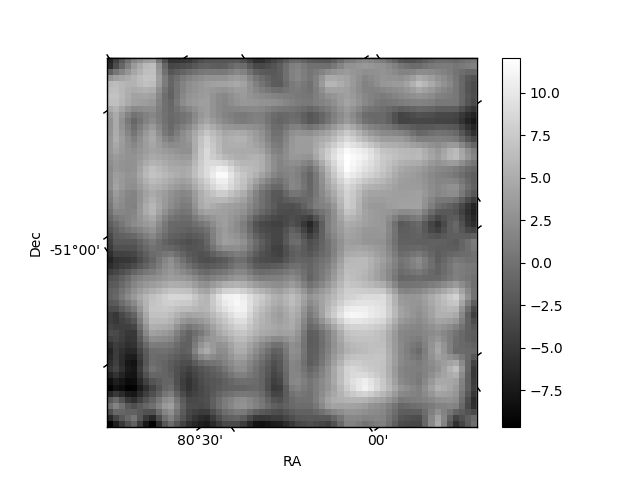
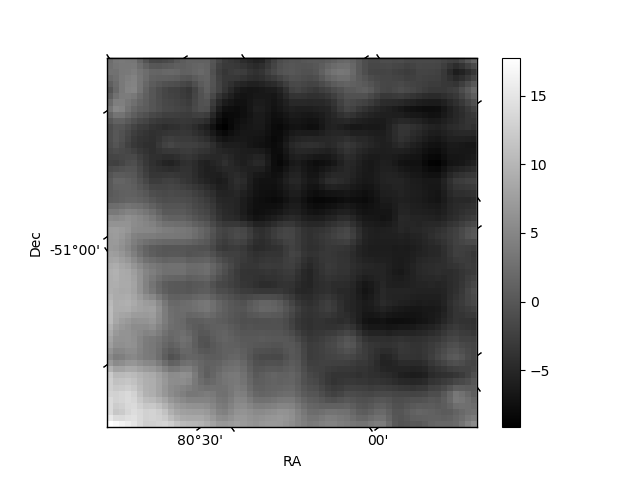
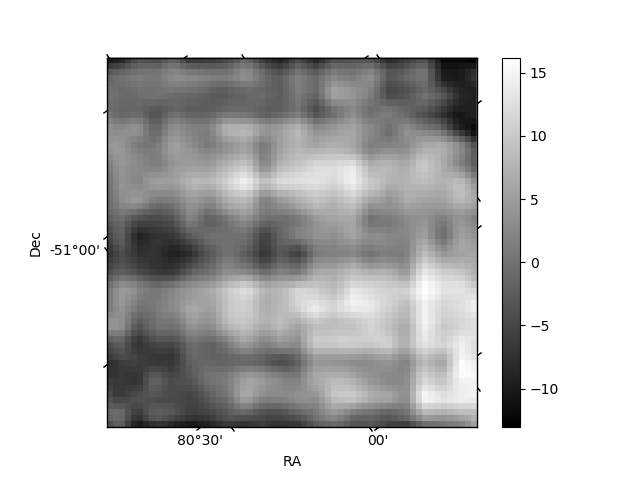
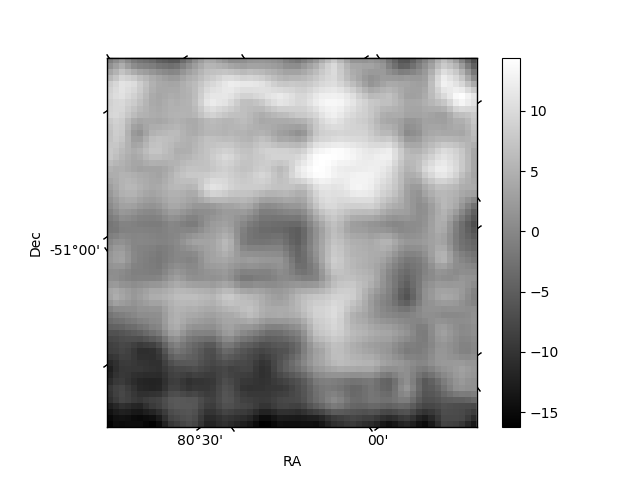
Histogram calculated using DETX and DETY for each event in the final _common_clean file
| Quadrant A | 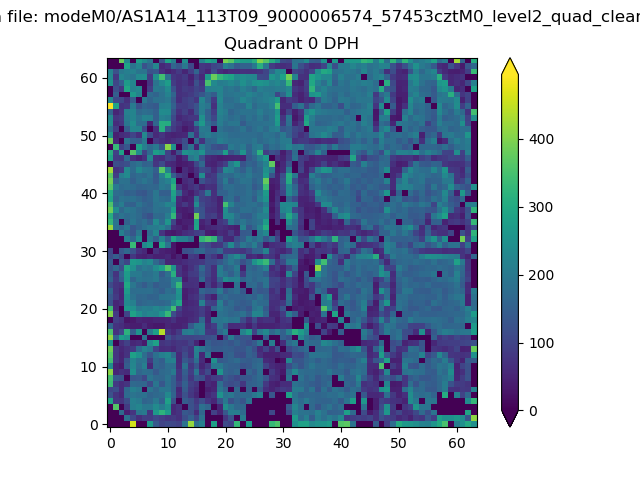 |
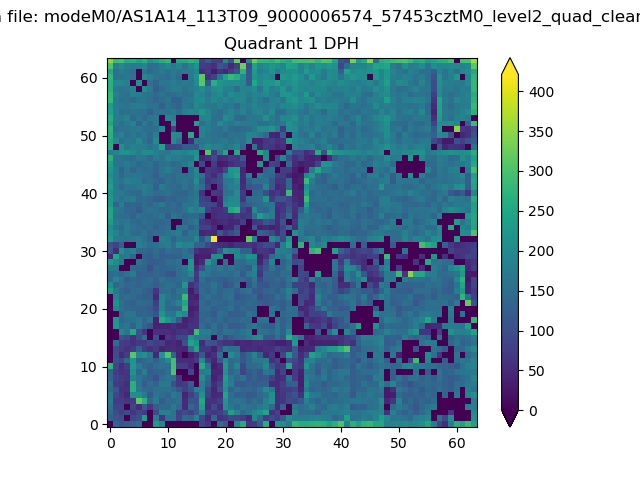 |
Quadrant B |
|---|---|---|---|
| Quadrant D | 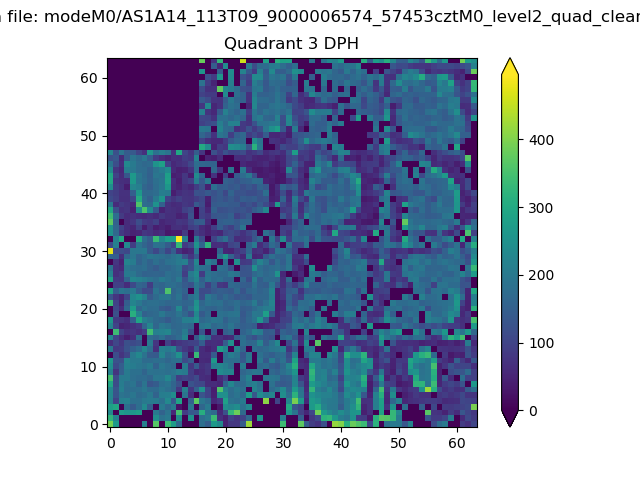 |
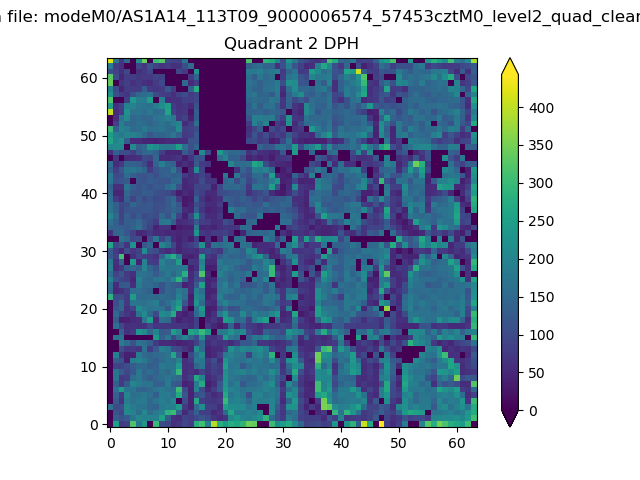 |
Quadrant C |
| Plot type | Count rate plots | Images |
|---|---|---|
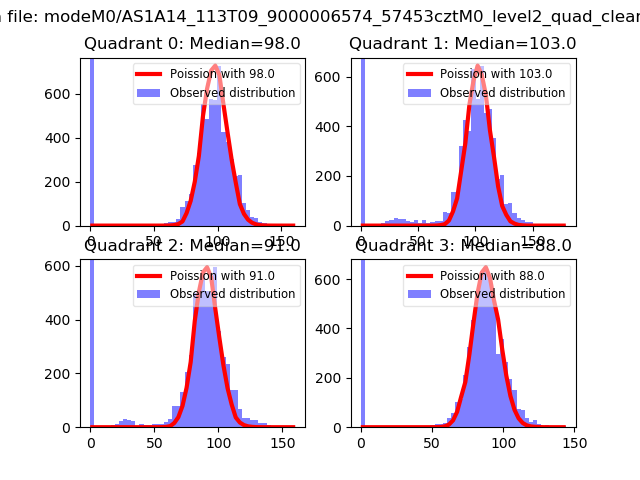
| Comparison with Poisson distribution Blue bars denote a histogram of data divided into 1 sec bins. Red curve is a Poisson curve with rate = median count rate of data. |
 |
 |
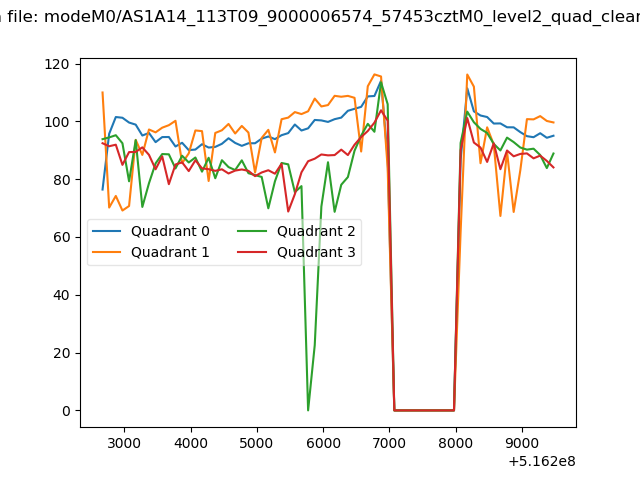
| Quadrant-wise count rates Data is divided into 100 sec bins |
 |
|
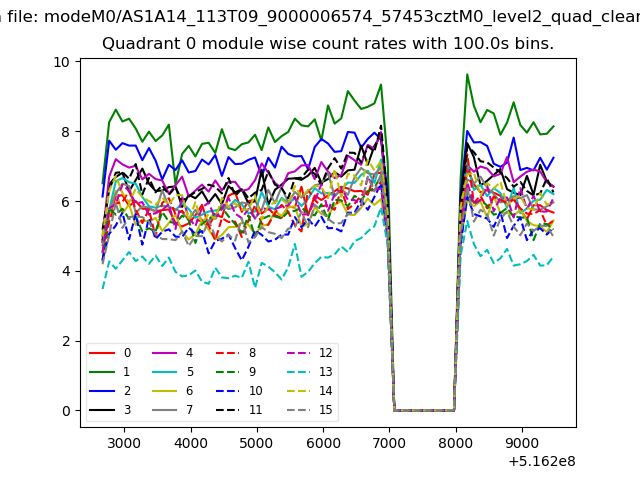
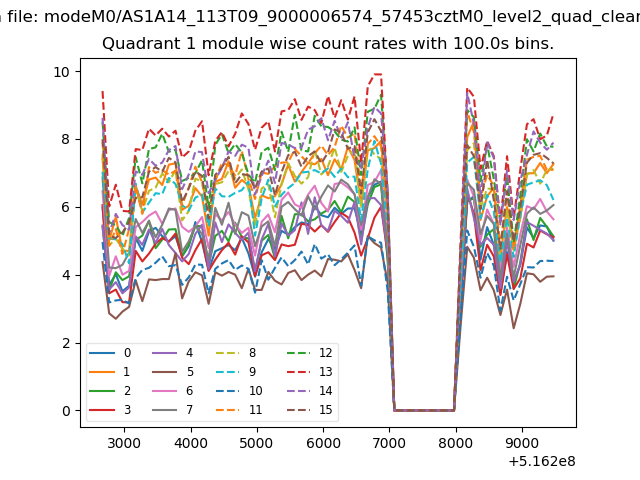
| Module-wise count rates for Quadrant A Data is divided into 100 sec bins |
 |
 |
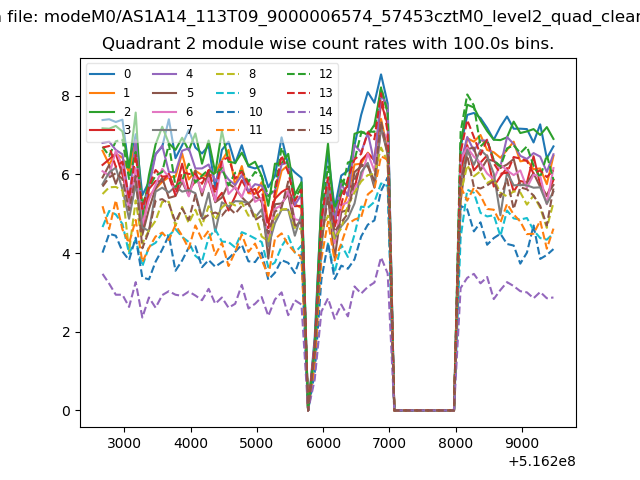
| Module-wise count rates for Quadrant B Data is divided into 100 sec bins |
 |
 |
| Module-wise count rates for Quadrant C Data is divided into 100 sec bins |
 |
 |
| Module-wise count rates for Quadrant D Data is divided into 100 sec bins |
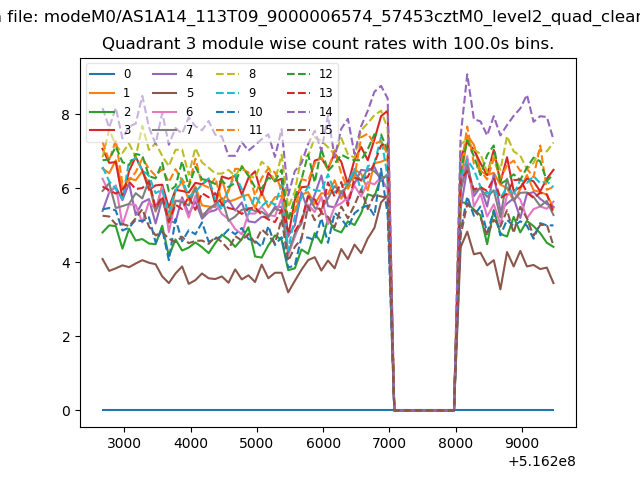 |
 |
| Parameter | Plot |
|---|---|
| CZT HV Monitor | 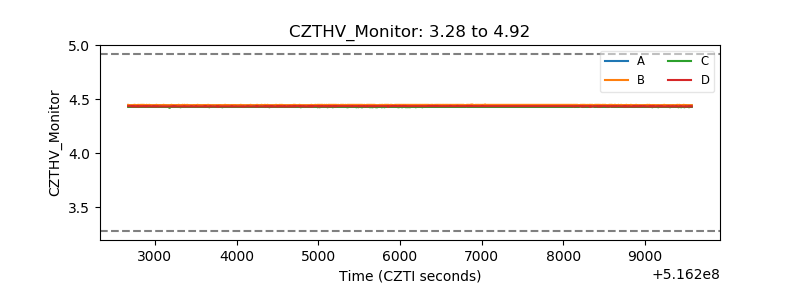 |
| D_VDD | 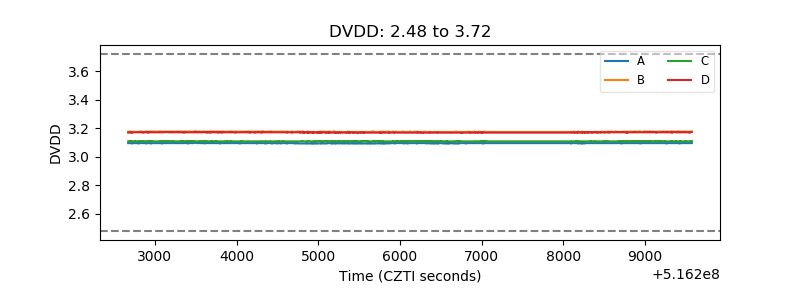 |
| Temperature 1 | 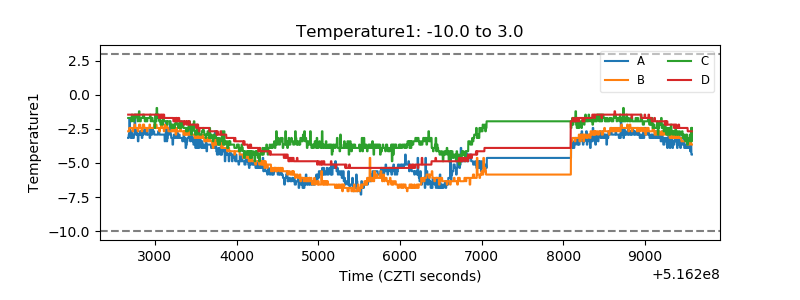 |
| Veto HV Monitor | 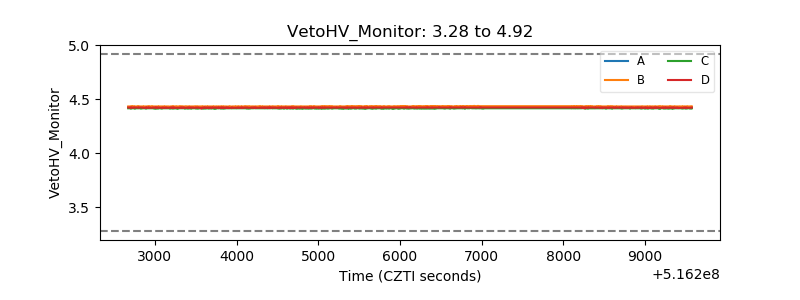 |
| Veto LLD | 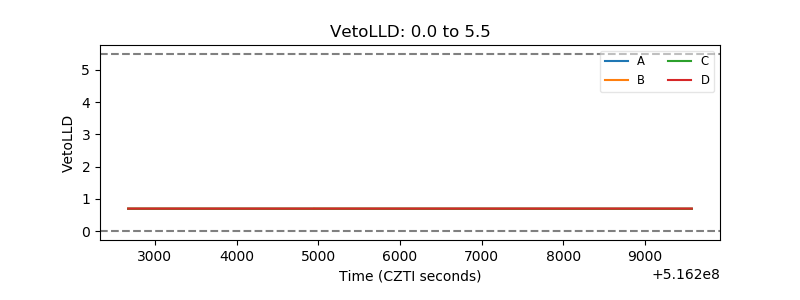 |
| Alpha Counter | 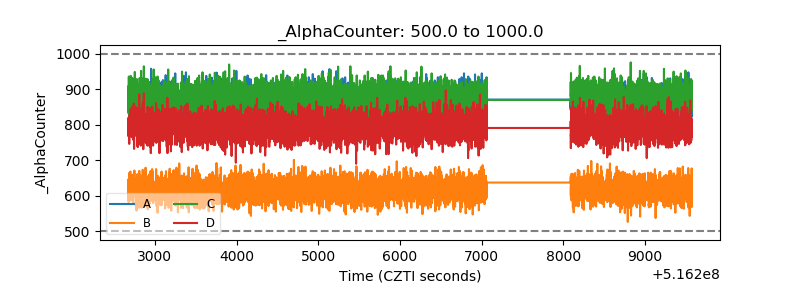 |
| _CPM_Rate | 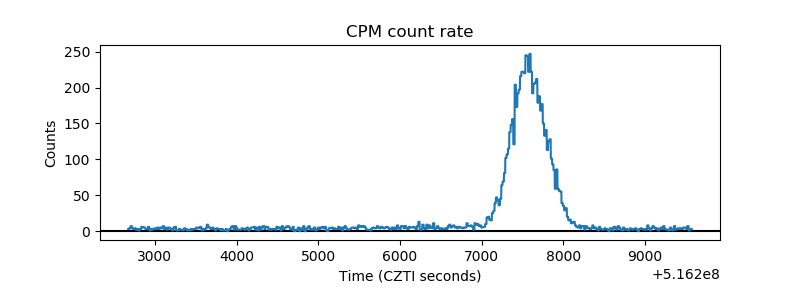 |
| CZT Counter | 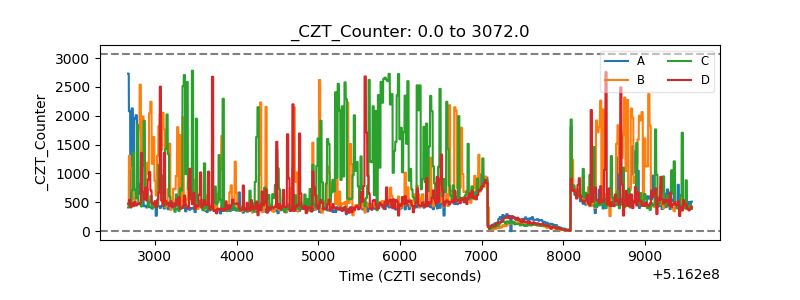 |
| +2.5 Volts monitor |  |
| +5 Volts monitor | 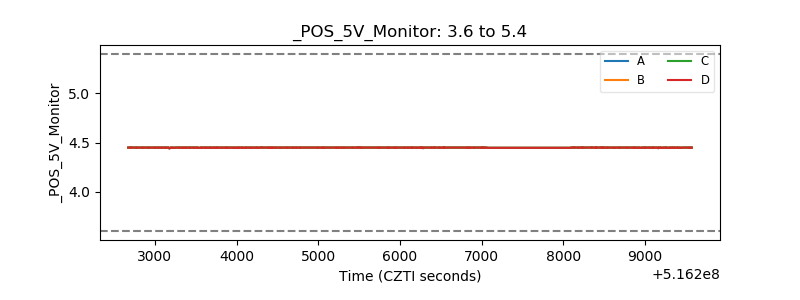 |
| _ROLL_ROT | 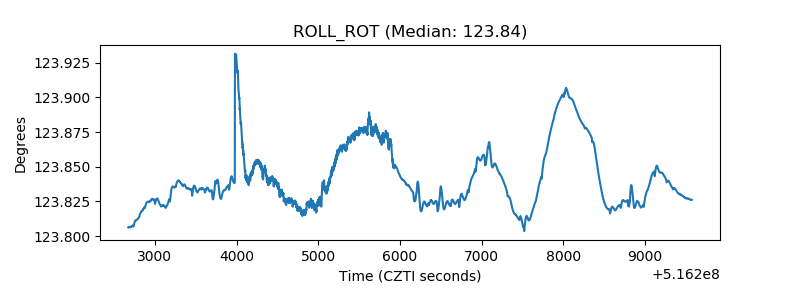 |
| _Roll_DEC | 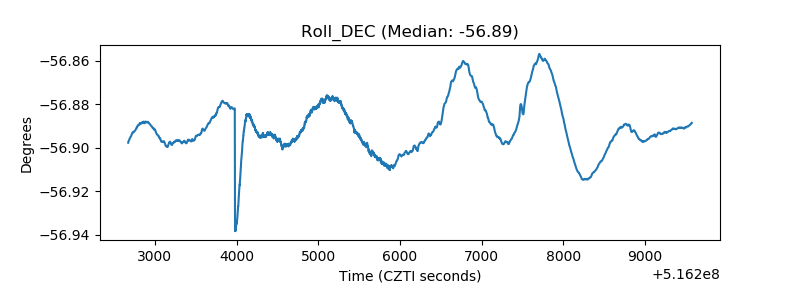 |
| _Roll_RA | 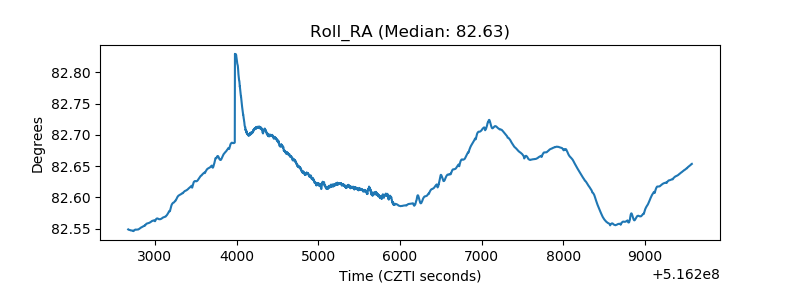 |
| Veto Counter | 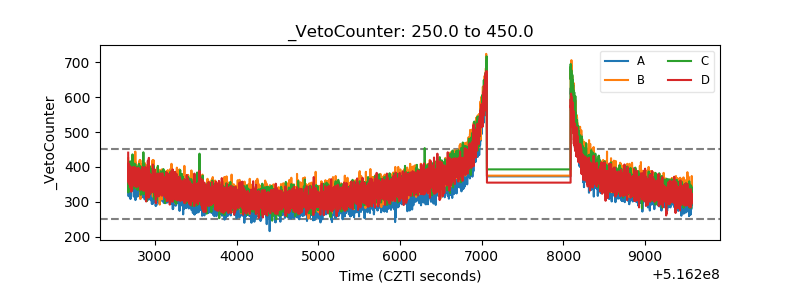 |