| Param | Original file | Final file |
|---|---|---|
| Filename | modeM0/AS1A14_113T09_9000006574_57454cztM0_level2.fits | modeM0/AS1A14_113T09_9000006574_57454cztM0_level2_quad_clean.evt |
| Size (bytes) | 472,078,080 | 88,217,280 |
| Size | 450.2 MB | 84.1 MB |
| Events in quadrant A | 3,048,013 | 601,020 |
| Events in quadrant B | 5,095,045 | 566,535 |
| Events in quadrant C | 4,600,681 | 552,086 |
| Events in quadrant D | 4,244,778 | 515,249 |
| Mode SS | |||
|---|---|---|---|
| Quadrant | BADHDUFLAG | Total packets | Discarded packets |
| A | 0 | 126 | 0 |
| B | 0 | 126 | 0 |
| C | 0 | 126 | 0 |
| D | 0 | 126 | 0 |
| Mode M9 | |||
|---|---|---|---|
| Quadrant | BADHDUFLAG | Total packets | Discarded packets |
| A | 0 | 8 | 0 |
| B | 0 | 8 | 0 |
| C | 0 | 8 | 0 |
| D | 0 | 8 | 0 |
| Mode M0 | |||
|---|---|---|---|
| Quadrant | BADHDUFLAG | Total packets | Discarded packets |
| A | 0 | 13489 | 1 |
| B | 0 | 19518 | 1 |
| C | 0 | 18035 | 1 |
| D | 0 | 16989 | 1 |
| Quadrant | Total seconds | Saturated seconds | Saturation percentage |
|---|---|---|---|
| A | 6254 | 35 | 0.559642% |
| B | 6255 | 837 | 13.381295% |
| C | 6255 | 301 | 4.812150% |
| D | 6255 | 393 | 6.282974% |
Noise dominated data is calculated using 1-second bins in cleaned event files. If a bin has >2000 counts, and if more than 50% of those come from <1% of pixels, then it is considered to be noise-dominated and hence unusable.
| Quadrant | # 1 sec bins | Bins with >0 counts | Bins with >2000 counts | High rate bins dominated by noise | Noise dominated (total time) | Noise dominated (detector-on time) | Marked lightcurve |
|---|---|---|---|---|---|---|---|
| A | 7029 | 6255 | 3 | 3 | 0.04% | 0.05% | 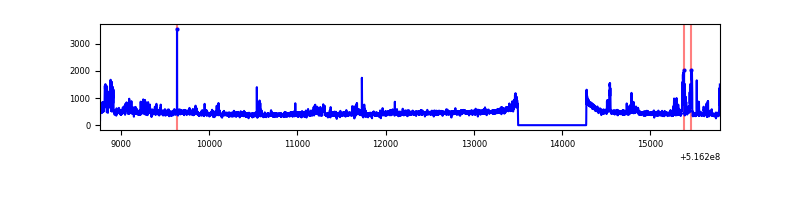 |
| B | 7030 | 6256 | 497 | 497 | 7.07% | 7.94% | 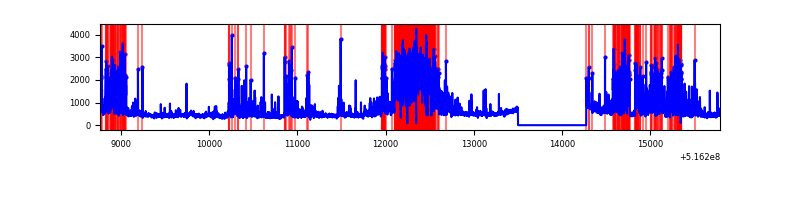 |
| C | 7030 | 6256 | 216 | 216 | 3.07% | 3.45% | 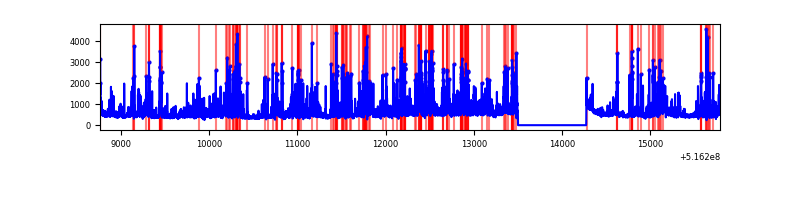 |
| D | 7030 | 6256 | 280 | 280 | 3.98% | 4.48% | 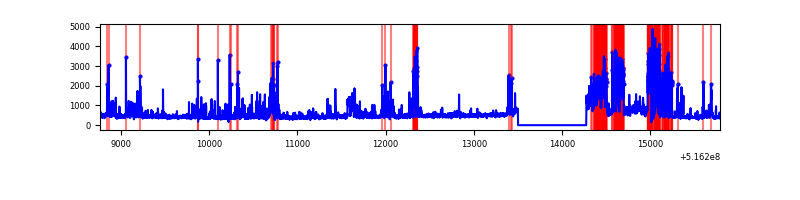 |
Top three noisy pixels from each quadrant. If the there are fewer than three noisy pixels in the level2.evt file, extra rows are filled as -1
| Pixel properties | Quadrant properties | ||||||
|---|---|---|---|---|---|---|---|
| Quadrant | DetID | PixID | Counts | Sigma | Mean | Median | Sigma |
| A | 3 | 14 | 317881 | 1899.79 | 673 | 654 | 167.0 |
| A | 4 | 95 | 95499 | 568.0 | 673 | 654 | 167.0 |
| A | 0 | 12 | 15538 | 89.14 | 673 | 654 | 167.0 |
| B | 4 | 206 | 1267888 | 9413.94 | 627 | 602 | 134.6 |
| B | 5 | 185 | 1051600 | 7807.26 | 627 | 602 | 134.6 |
| B | 0 | 63 | 106144 | 784.01 | 627 | 602 | 134.6 |
| C | 15 | 224 | 1715790 | 9834.89 | 636 | 629 | 174.4 |
| C | 3 | 248 | 112018 | 638.72 | 636 | 629 | 174.4 |
| C | 1 | 16 | 98849 | 563.2 | 636 | 629 | 174.4 |
| D | 8 | 240 | 875387 | 4895.14 | 633 | 602 | 178.7 |
| D | 15 | 142 | 304826 | 1702.38 | 633 | 602 | 178.7 |
| D | 2 | 249 | 172732 | 963.21 | 633 | 602 | 178.7 |
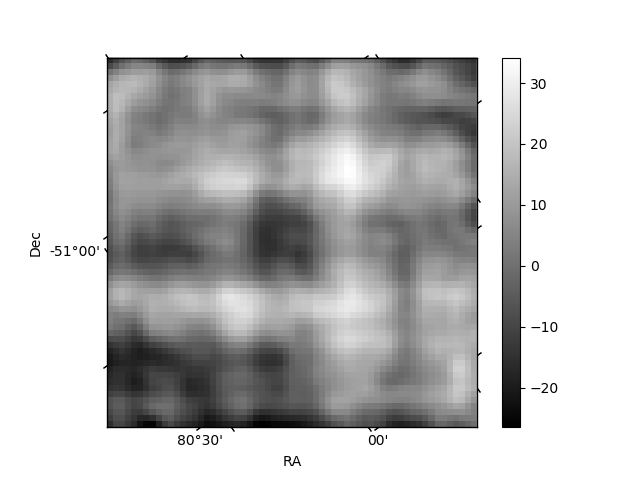
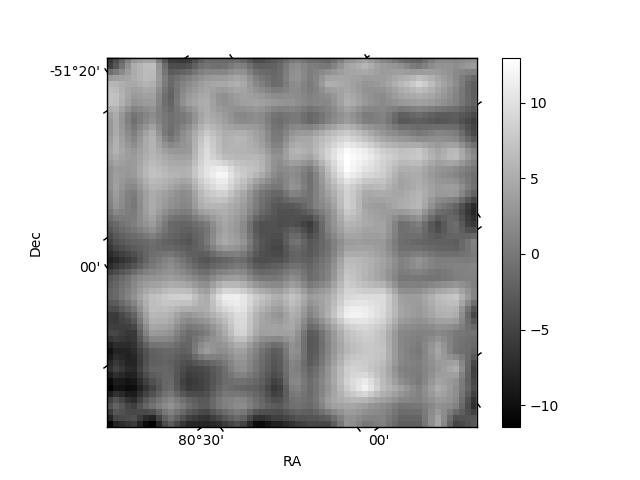
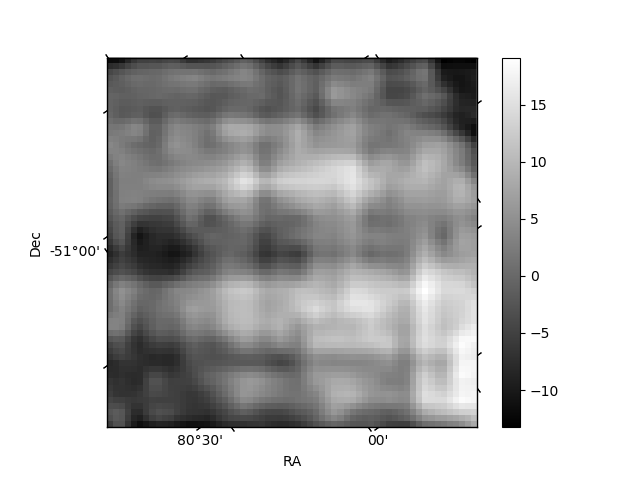
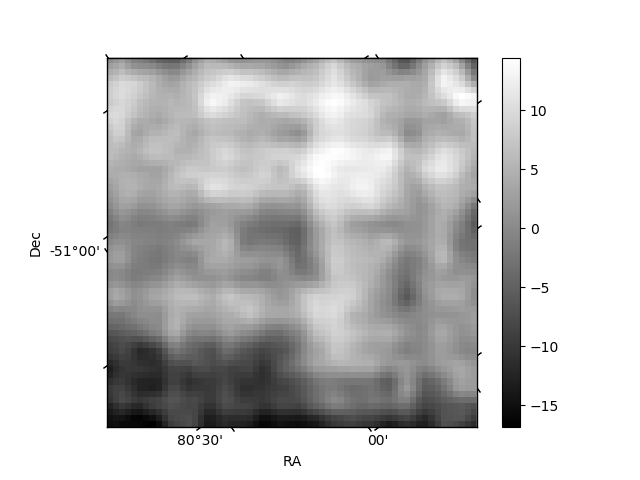
Histogram calculated using DETX and DETY for each event in the final _common_clean file
| Quadrant A | 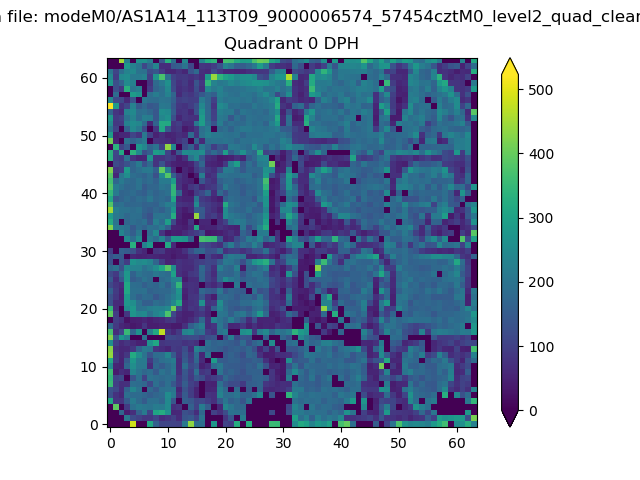 |
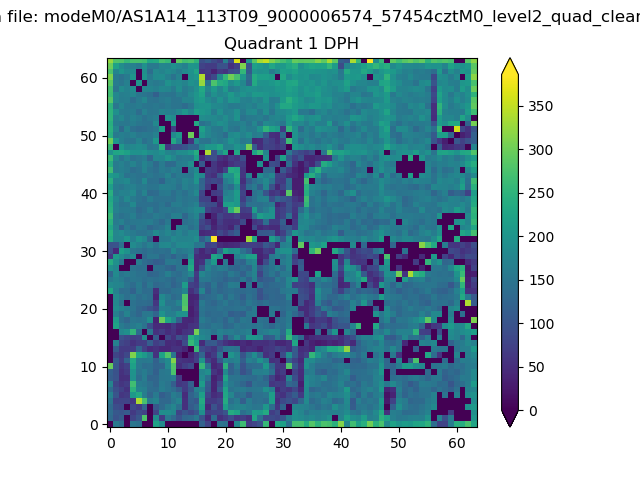 |
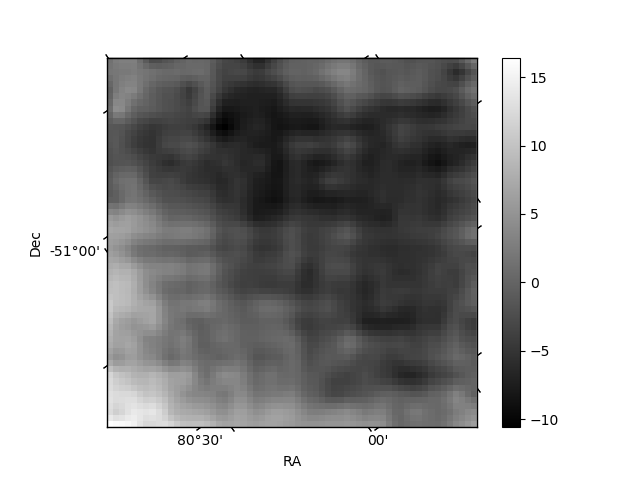
Quadrant B |
|---|---|---|---|
| Quadrant D | 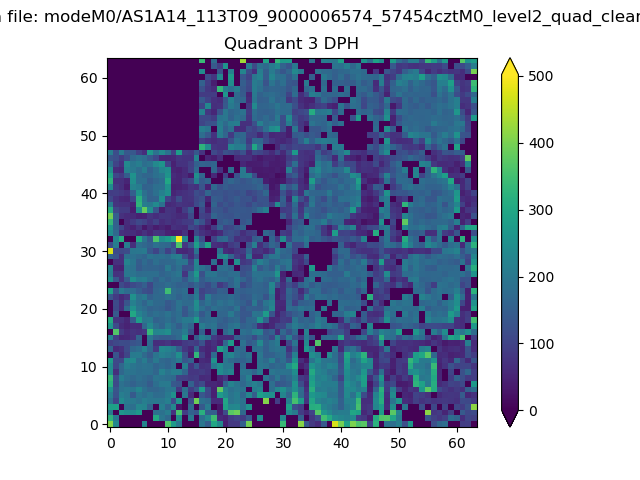 |
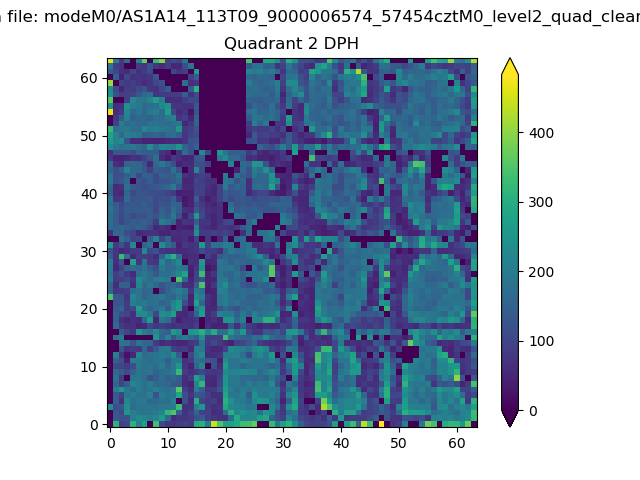 |
Quadrant C |
| Plot type | Count rate plots | Images |
|---|---|---|
| Comparison with Poisson distribution Blue bars denote a histogram of data divided into 1 sec bins. Red curve is a Poisson curve with rate = median count rate of data. |
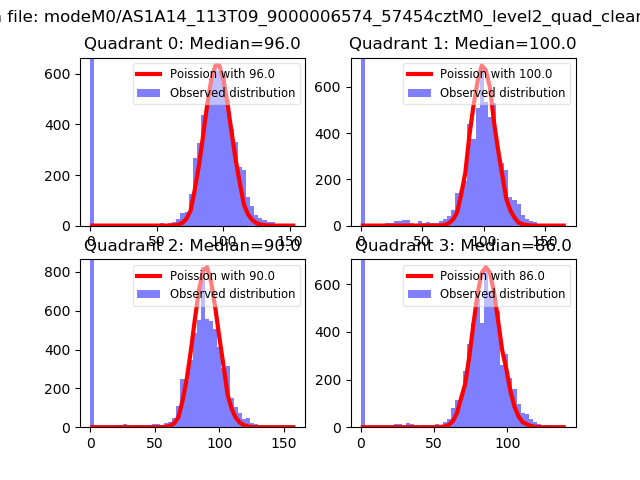 |
 |
| Quadrant-wise count rates Data is divided into 100 sec bins |
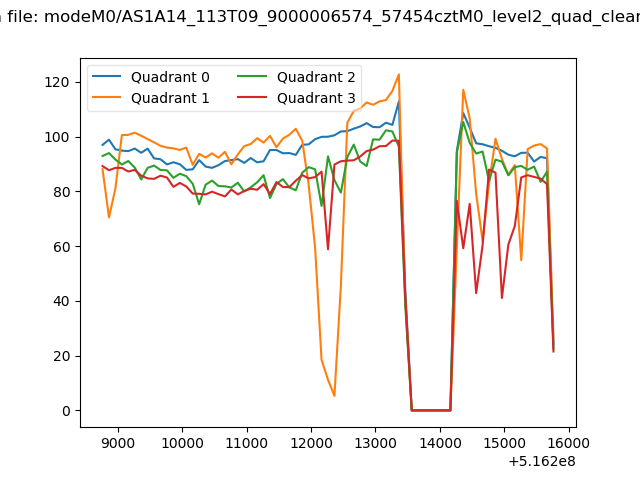 |
|
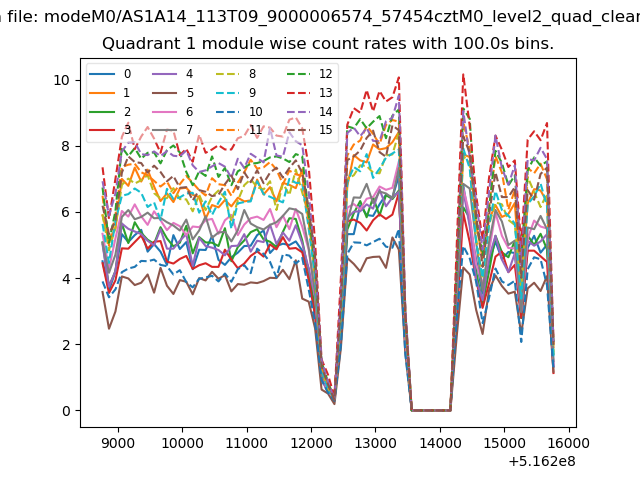
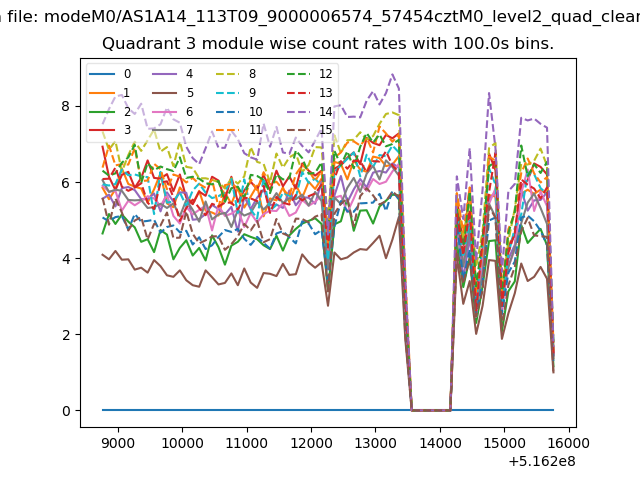
| Module-wise count rates for Quadrant A Data is divided into 100 sec bins |
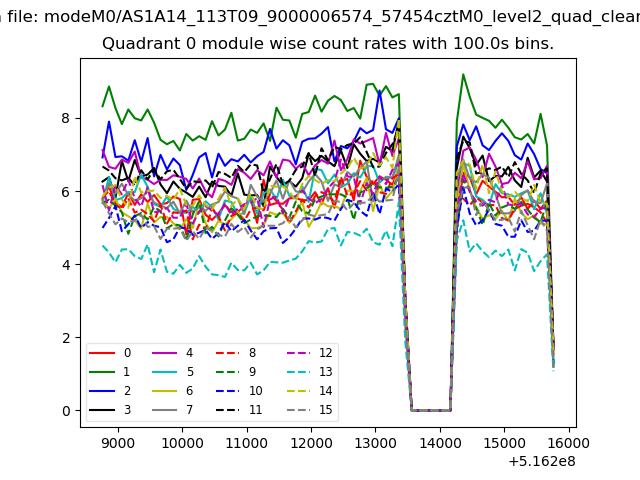 |
 |
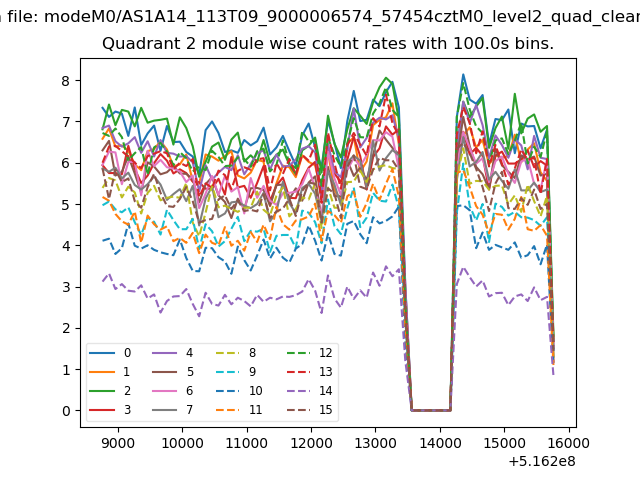
| Module-wise count rates for Quadrant B Data is divided into 100 sec bins |
 |
 |
| Module-wise count rates for Quadrant C Data is divided into 100 sec bins |
 |
 |
| Module-wise count rates for Quadrant D Data is divided into 100 sec bins |
 |
 |
| Parameter | Plot |
|---|---|
| CZT HV Monitor |  |
| D_VDD | 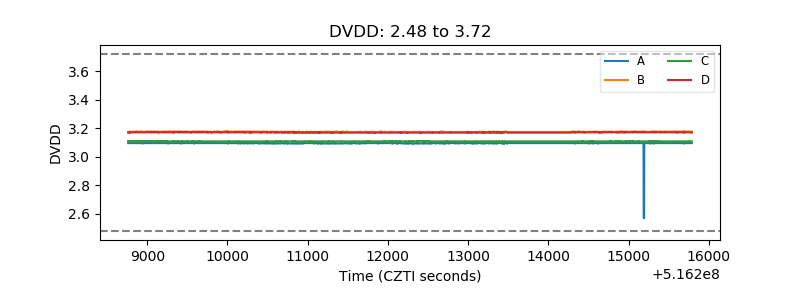 |
| Temperature 1 | 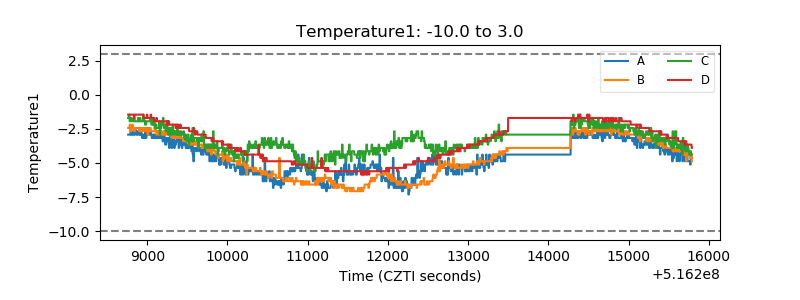 |
| Veto HV Monitor | 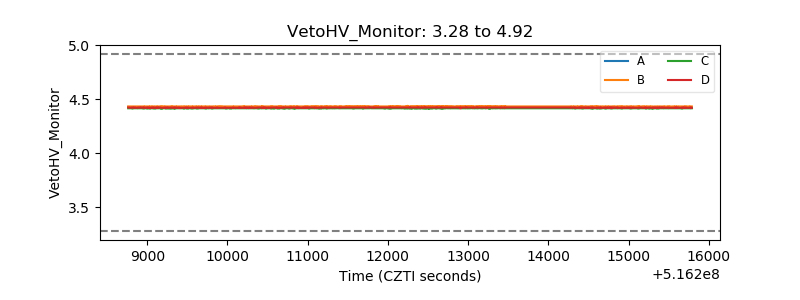 |
| Veto LLD | 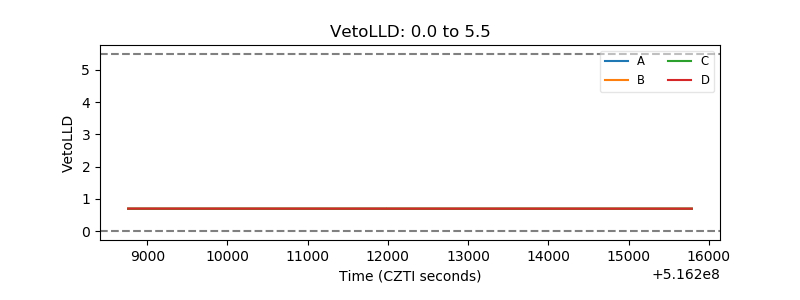 |
| Alpha Counter | 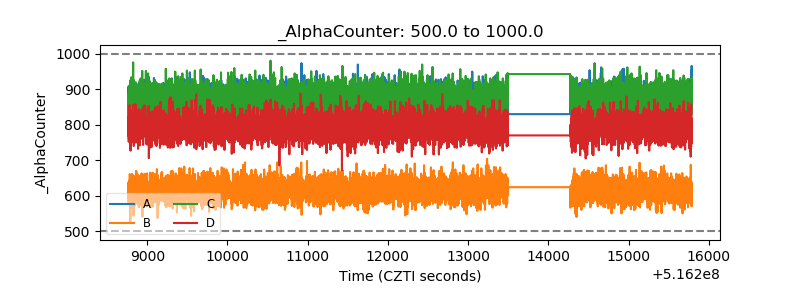 |
| _CPM_Rate | 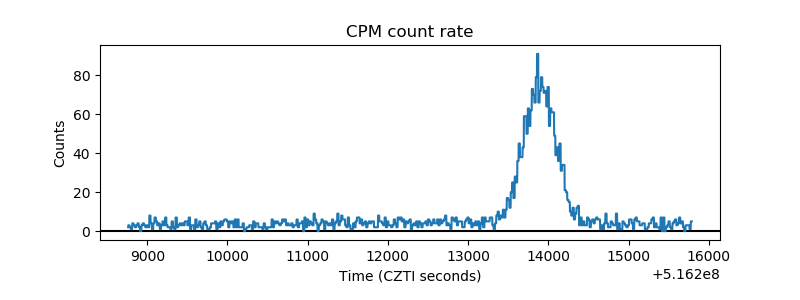 |
| CZT Counter | 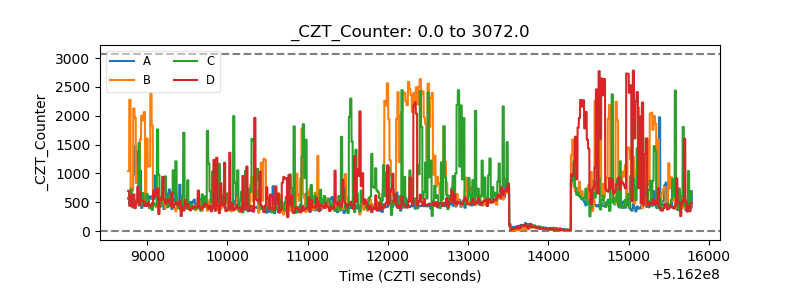 |
| +2.5 Volts monitor | 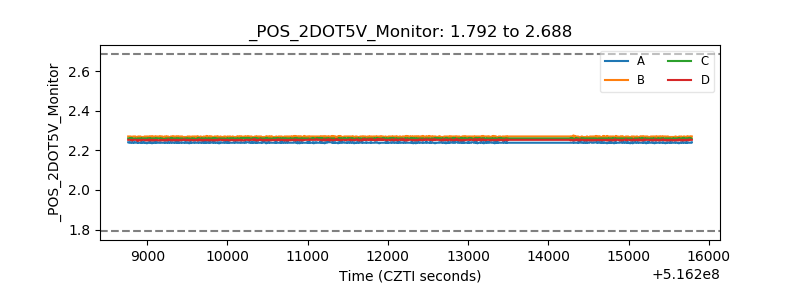 |
| +5 Volts monitor | 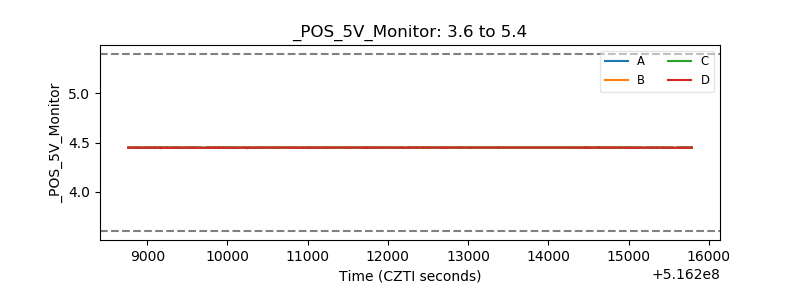 |
| _ROLL_ROT | 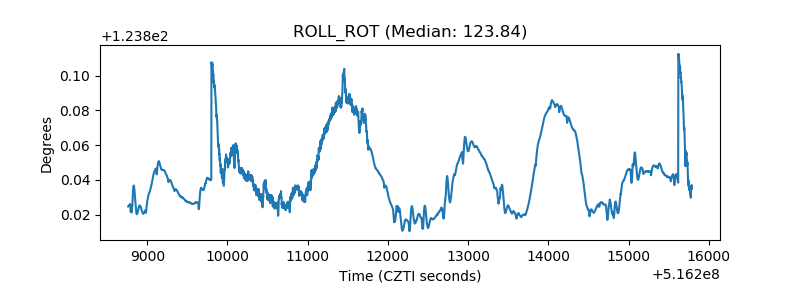 |
| _Roll_DEC | 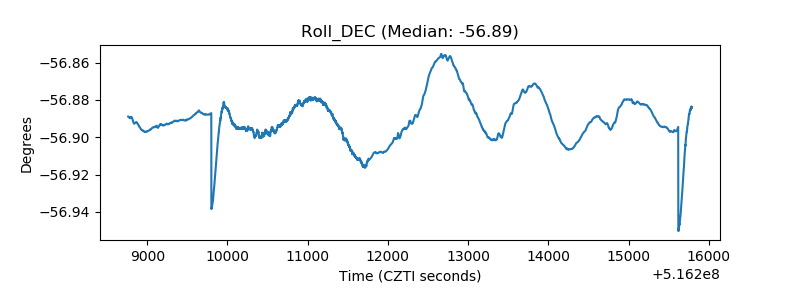 |
| _Roll_RA | 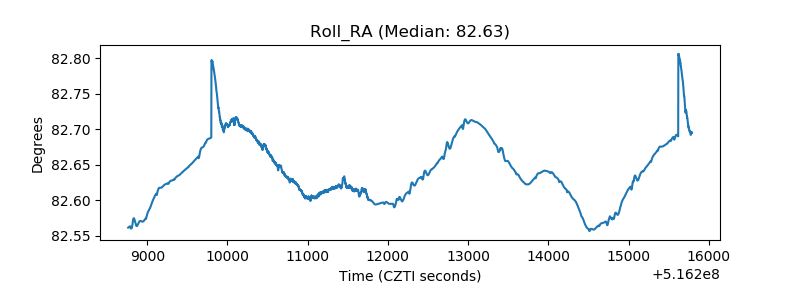 |
| Veto Counter | 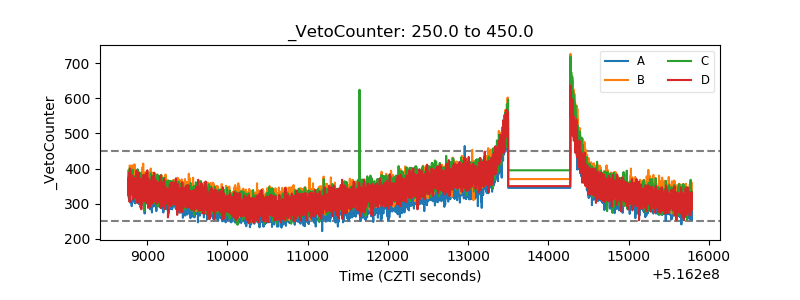 |