| Param | Original file | Final file |
|---|---|---|
| Filename | modeM0/AS1A14_113T09_9000006574_57455cztM0_level2.fits | modeM0/AS1A14_113T09_9000006574_57455cztM0_level2_quad_clean.evt |
| Size (bytes) | 502,634,880 | 98,196,480 |
| Size | 479.3 MB | 93.6 MB |
| Events in quadrant A | 3,214,489 | 653,959 |
| Events in quadrant B | 4,454,342 | 678,358 |
| Events in quadrant C | 5,082,843 | 599,789 |
| Events in quadrant D | 5,318,129 | 559,783 |
| Mode SS | |||
|---|---|---|---|
| Quadrant | BADHDUFLAG | Total packets | Discarded packets |
| A | 0 | 140 | 0 |
| B | 0 | 140 | 0 |
| C | 0 | 140 | 0 |
| D | 0 | 140 | 0 |
| Mode M9 | |||
|---|---|---|---|
| Quadrant | BADHDUFLAG | Total packets | Discarded packets |
| A | 0 | 4 | 0 |
| B | 0 | 4 | 0 |
| C | 0 | 4 | 0 |
| D | 0 | 4 | 0 |
| Mode M0 | |||
|---|---|---|---|
| Quadrant | BADHDUFLAG | Total packets | Discarded packets |
| A | 0 | 14657 | 1 |
| B | 0 | 17897 | 1 |
| C | 0 | 19836 | 1 |
| D | 0 | 20557 | 1 |
| Quadrant | Total seconds | Saturated seconds | Saturation percentage |
|---|---|---|---|
| A | 6906 | 25 | 0.362004% |
| B | 6907 | 283 | 4.097293% |
| C | 6907 | 330 | 4.777762% |
| D | 6906 | 446 | 6.458152% |
Noise dominated data is calculated using 1-second bins in cleaned event files. If a bin has >2000 counts, and if more than 50% of those come from <1% of pixels, then it is considered to be noise-dominated and hence unusable.
| Quadrant | # 1 sec bins | Bins with >0 counts | Bins with >2000 counts | High rate bins dominated by noise | Noise dominated (total time) | Noise dominated (detector-on time) | Marked lightcurve |
|---|---|---|---|---|---|---|---|
| A | 7311 | 6907 | 2 | 2 | 0.03% | 0.03% | 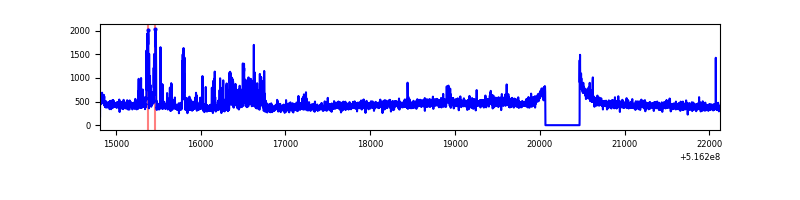 |
| B | 7312 | 6908 | 122 | 122 | 1.67% | 1.77% | 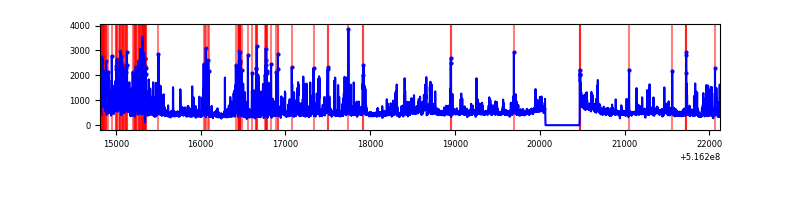 |
| C | 7312 | 6908 | 263 | 263 | 3.60% | 3.81% | 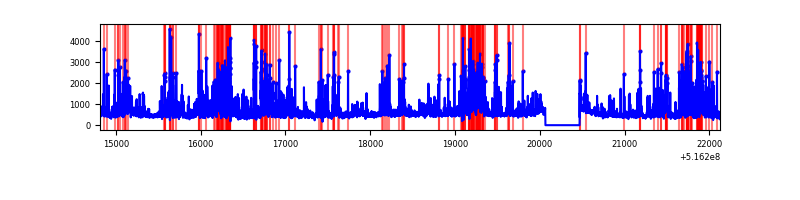 |
| D | 7311 | 6907 | 431 | 431 | 5.90% | 6.24% | 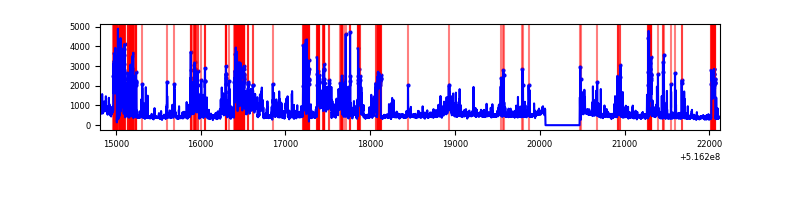 |
Top three noisy pixels from each quadrant. If the there are fewer than three noisy pixels in the level2.evt file, extra rows are filled as -1
| Pixel properties | Quadrant properties | ||||||
|---|---|---|---|---|---|---|---|
| Quadrant | DetID | PixID | Counts | Sigma | Mean | Median | Sigma |
| A | 3 | 14 | 231256 | 1271.46 | 738 | 720 | 181.3 |
| A | 4 | 95 | 108230 | 592.94 | 738 | 720 | 181.3 |
| A | 4 | 3 | 10804 | 55.62 | 738 | 720 | 181.3 |
| B | 4 | 206 | 1123253 | 7269.0 | 720 | 692 | 154.4 |
| B | 0 | 63 | 137287 | 884.5 | 720 | 692 | 154.4 |
| B | 10 | 247 | 92310 | 593.26 | 720 | 692 | 154.4 |
| C | 15 | 224 | 1755769 | 9161.73 | 699 | 693 | 191.6 |
| C | 14 | 254 | 142722 | 741.41 | 699 | 693 | 191.6 |
| C | 3 | 248 | 139355 | 723.83 | 699 | 693 | 191.6 |
| D | 15 | 142 | 894291 | 4555.42 | 695 | 664 | 196.2 |
| D | 8 | 240 | 693003 | 3529.32 | 695 | 664 | 196.2 |
| D | 7 | 96 | 303741 | 1544.99 | 695 | 664 | 196.2 |
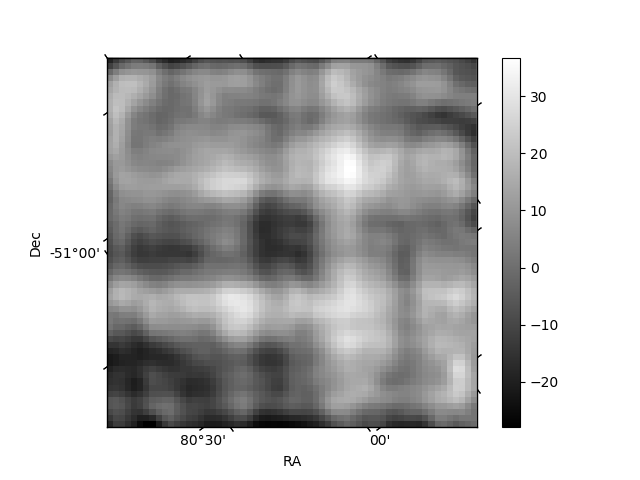
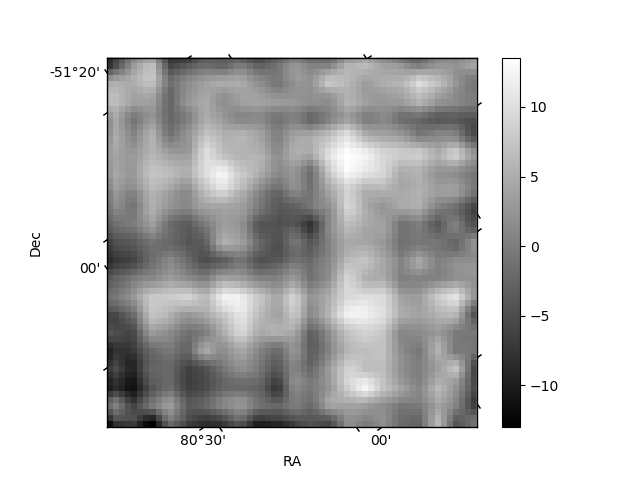
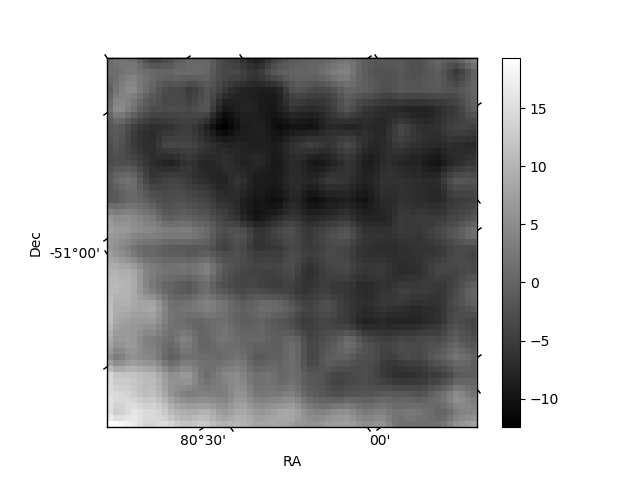
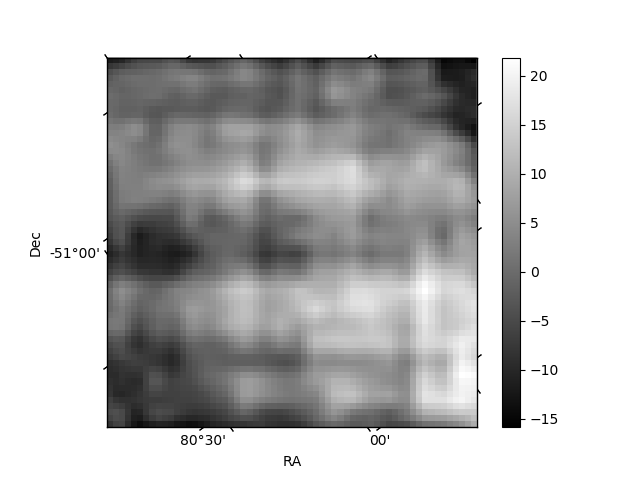
Histogram calculated using DETX and DETY for each event in the final _common_clean file
| Quadrant A | 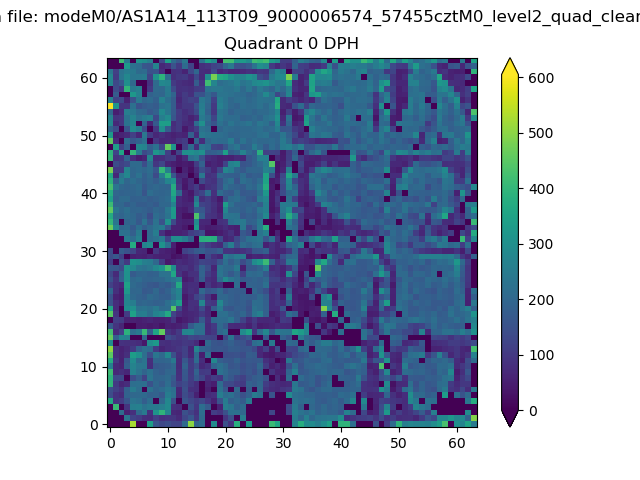 |
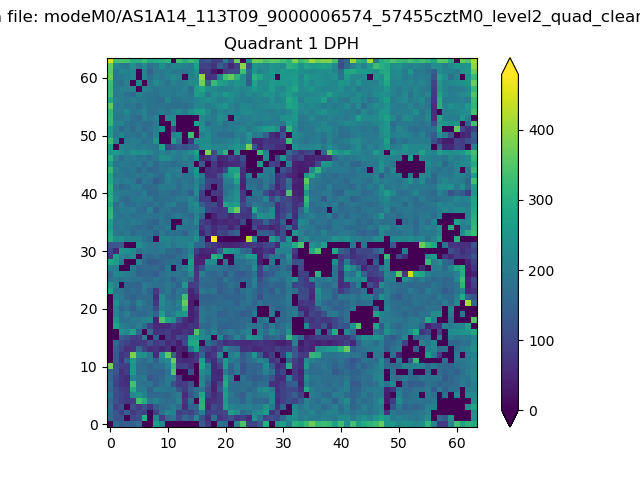 |
Quadrant B |
|---|---|---|---|
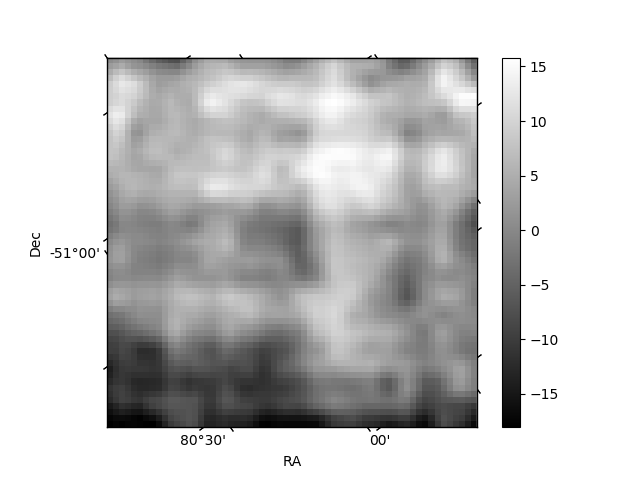
| Quadrant D | 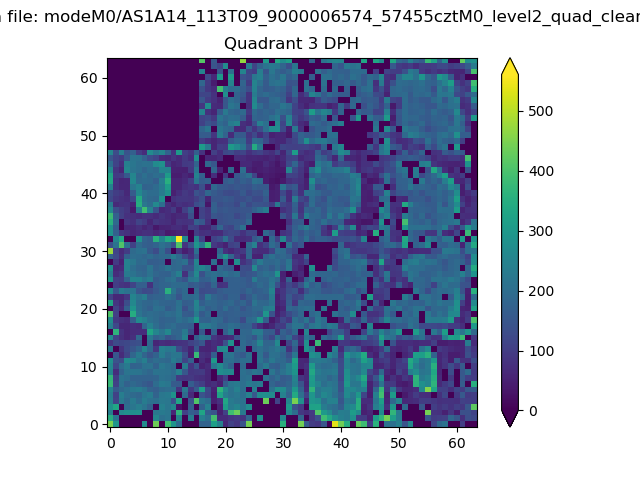 |
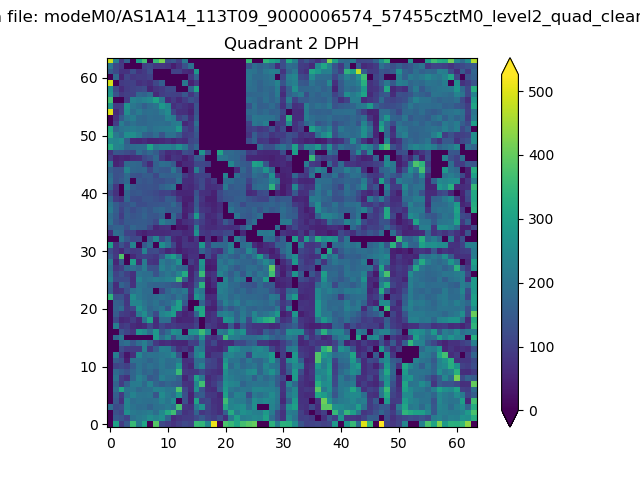 |
Quadrant C |
| Plot type | Count rate plots | Images |
|---|---|---|
| Comparison with Poisson distribution Blue bars denote a histogram of data divided into 1 sec bins. Red curve is a Poisson curve with rate = median count rate of data. |
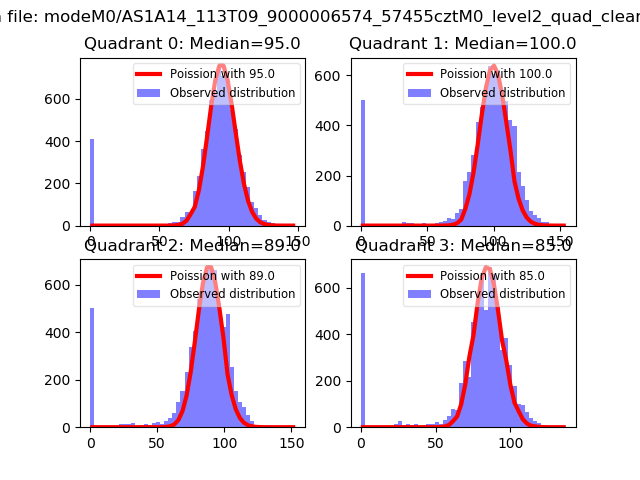 |
 |
| Quadrant-wise count rates Data is divided into 100 sec bins |
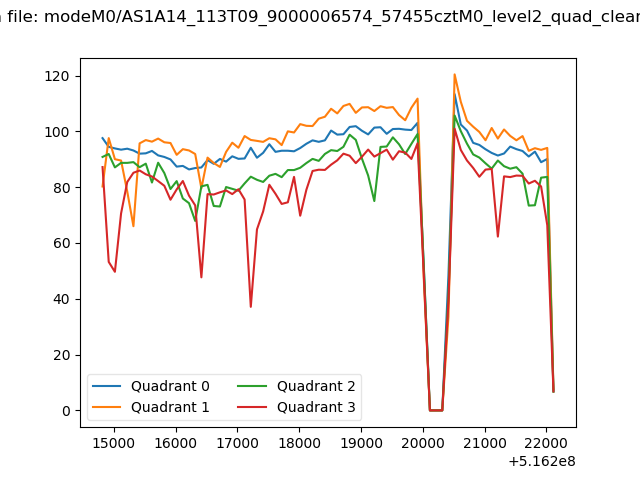 |
|
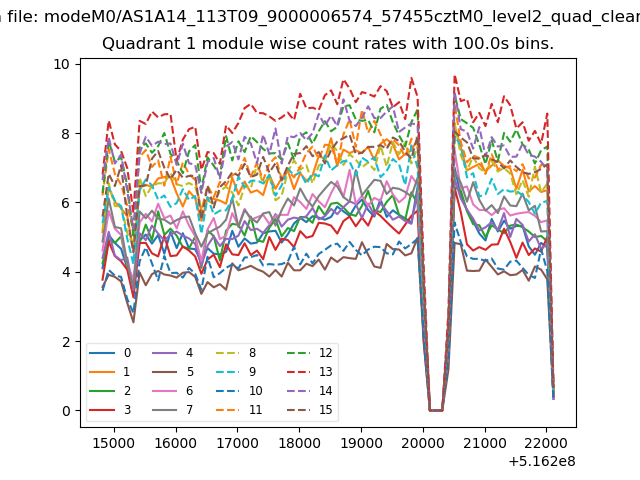
| Module-wise count rates for Quadrant A Data is divided into 100 sec bins |
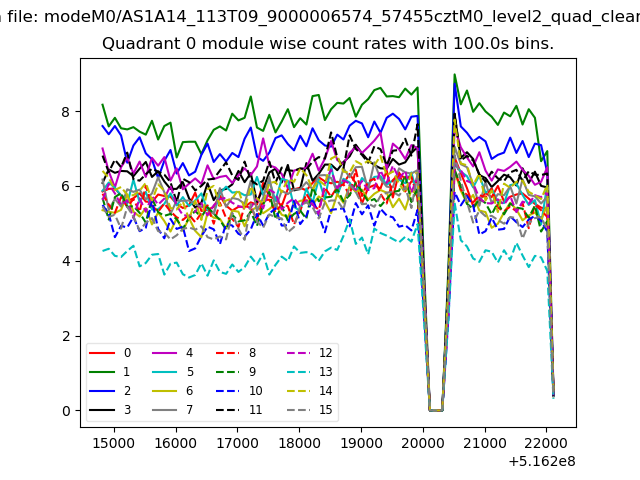 |
 |
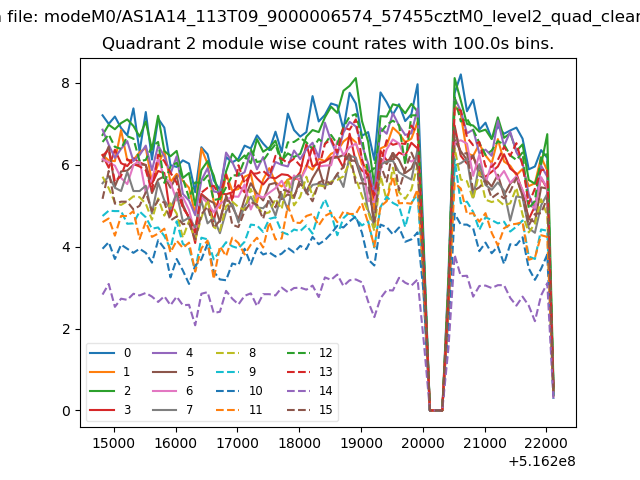
| Module-wise count rates for Quadrant B Data is divided into 100 sec bins |
 |
 |
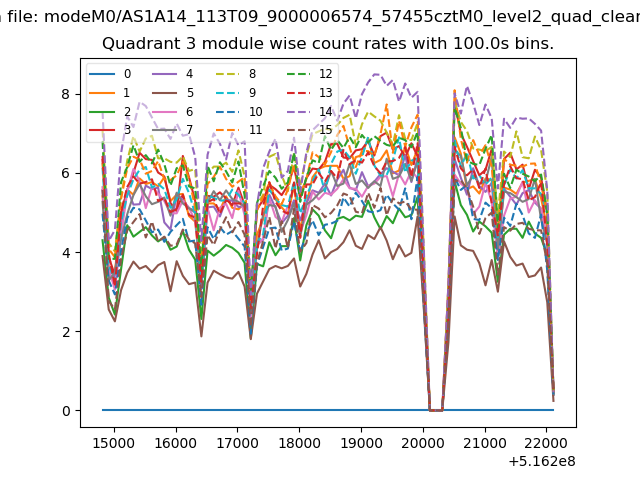
| Module-wise count rates for Quadrant C Data is divided into 100 sec bins |
 |
 |
| Module-wise count rates for Quadrant D Data is divided into 100 sec bins |
 |
 |
| Parameter | Plot |
|---|---|
| CZT HV Monitor | 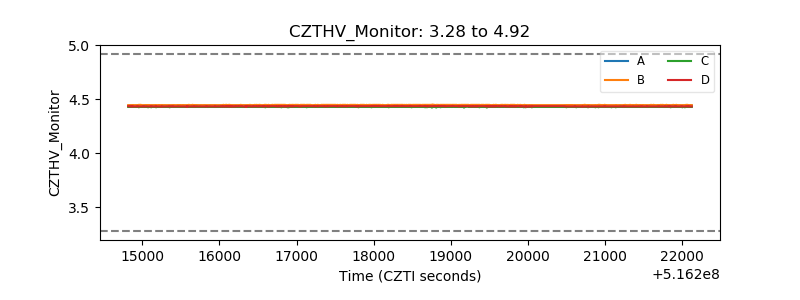 |
| D_VDD | 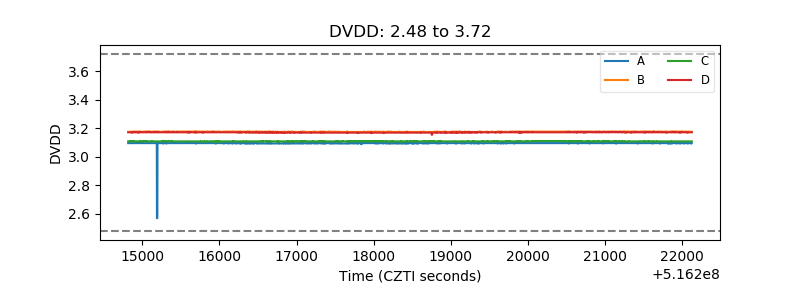 |
| Temperature 1 | 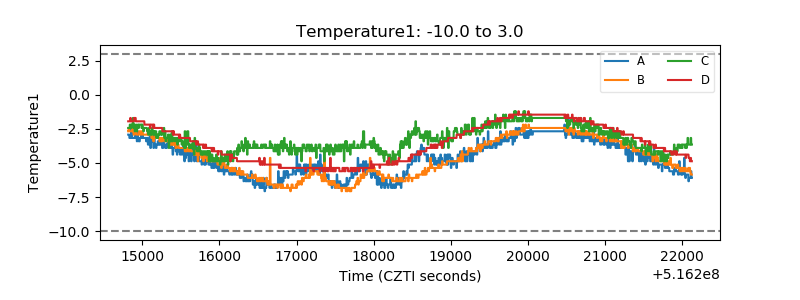 |
| Veto HV Monitor | 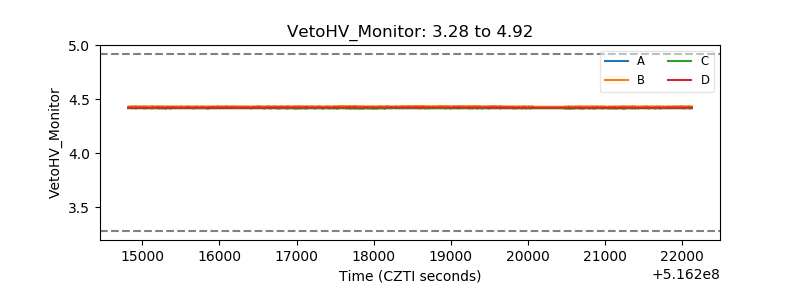 |
| Veto LLD | 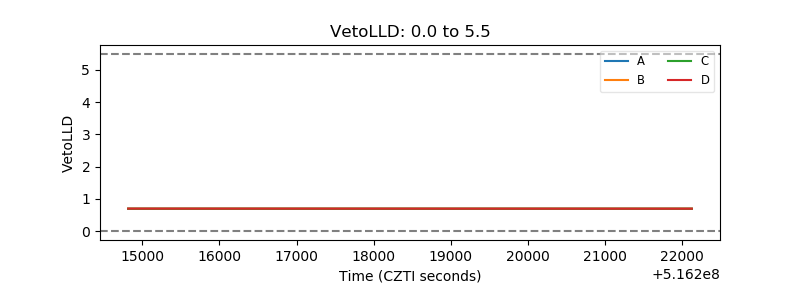 |
| Alpha Counter | 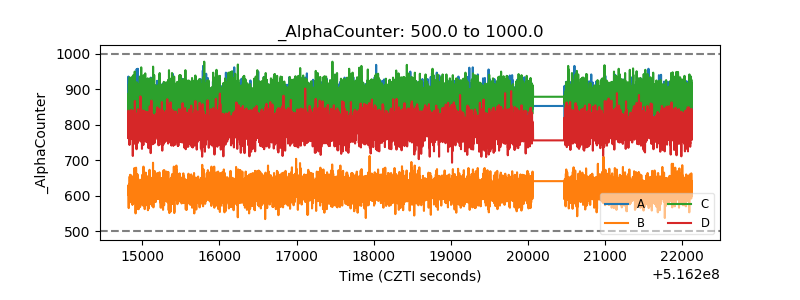 |
| _CPM_Rate | 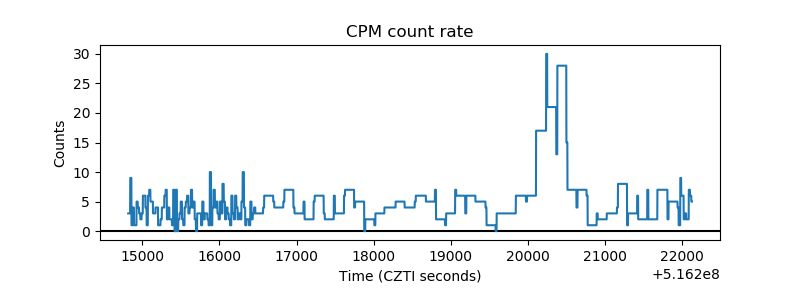 |
| CZT Counter | 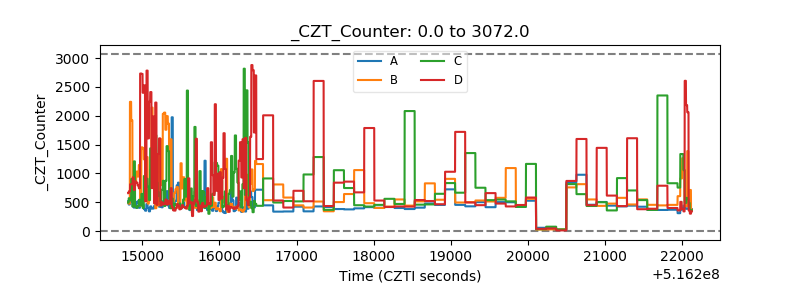 |
| +2.5 Volts monitor |  |
| +5 Volts monitor |  |
| _ROLL_ROT | 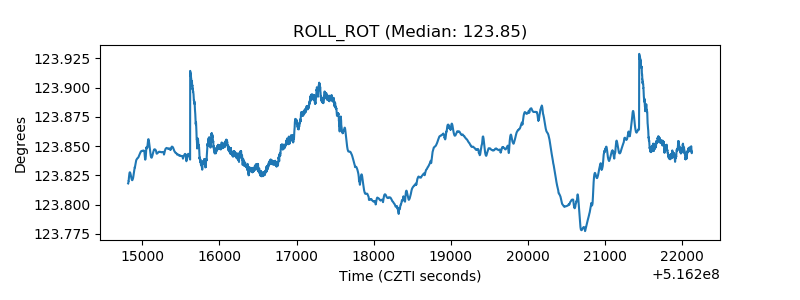 |
| _Roll_DEC | 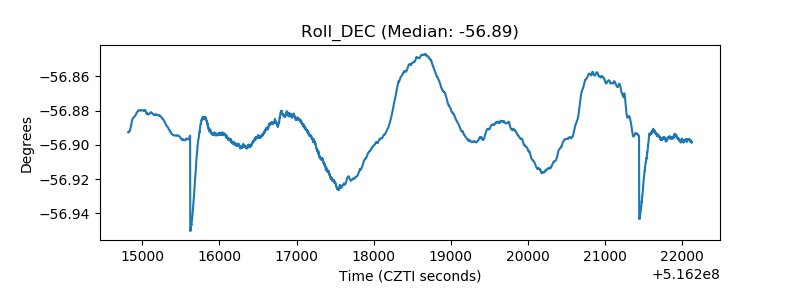 |
| _Roll_RA | 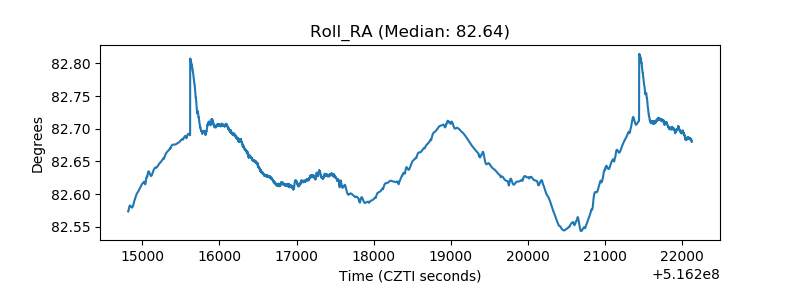 |
| Veto Counter | 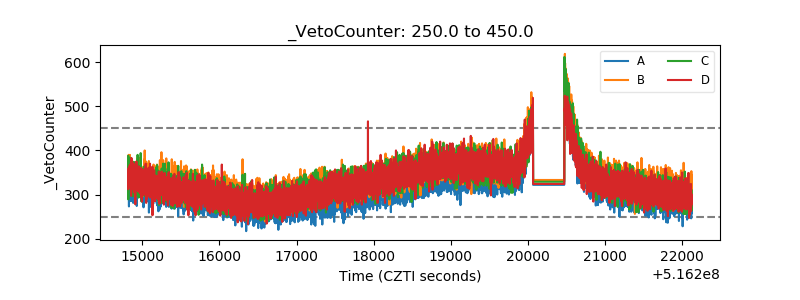 |