| Param | Original file | Final file |
|---|---|---|
| Filename | modeM0/AS1A14_113T09_9000006574_57457cztM0_level2.fits | modeM0/AS1A14_113T09_9000006574_57457cztM0_level2_quad_clean.evt |
| Size (bytes) | 578,286,720 | 98,959,680 |
| Size | 551.5 MB | 94.4 MB |
| Events in quadrant A | 3,492,878 | 643,571 |
| Events in quadrant B | 5,392,190 | 665,485 |
| Events in quadrant C | 6,110,420 | 573,188 |
| Events in quadrant D | 5,791,742 | 559,252 |
| Mode SS | |||
|---|---|---|---|
| Quadrant | BADHDUFLAG | Total packets | Discarded packets |
| A | 0 | 158 | 0 |
| B | 0 | 158 | 0 |
| C | 0 | 158 | 0 |
| D | 0 | 158 | 0 |
| Mode M0 | |||
|---|---|---|---|
| Quadrant | BADHDUFLAG | Total packets | Discarded packets |
| A | 0 | 16509 | 0 |
| B | 0 | 21723 | 0 |
| C | 0 | 23671 | 0 |
| D | 0 | 22866 | 0 |
| Quadrant | Total seconds | Saturated seconds | Saturation percentage |
|---|---|---|---|
| A | 7978 | 24 | 0.300827% |
| B | 7978 | 658 | 8.247681% |
| C | 7977 | 403 | 5.052025% |
| D | 7977 | 365 | 4.575655% |
Noise dominated data is calculated using 1-second bins in cleaned event files. If a bin has >2000 counts, and if more than 50% of those come from <1% of pixels, then it is considered to be noise-dominated and hence unusable.
| Quadrant | # 1 sec bins | Bins with >0 counts | Bins with >2000 counts | High rate bins dominated by noise | Noise dominated (total time) | Noise dominated (detector-on time) | Marked lightcurve |
|---|---|---|---|---|---|---|---|
| A | 8253 | 8253 | 6 | 6 | 0.07% | 0.07% | 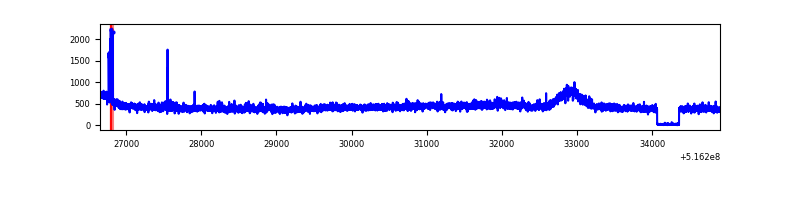 |
| B | 8253 | 8253 | 316 | 316 | 3.83% | 3.83% | 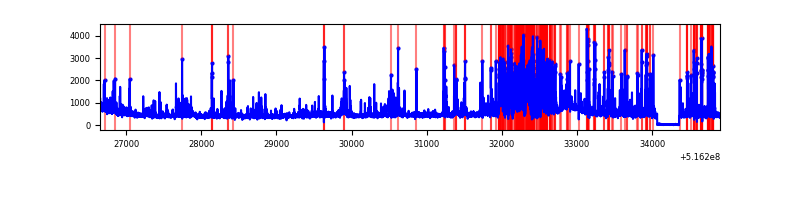 |
| C | 8252 | 8250 | 346 | 346 | 4.19% | 4.19% | 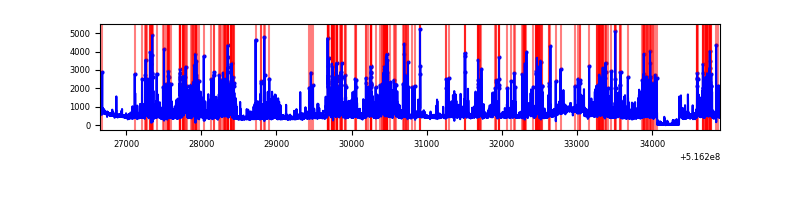 |
| D | 8252 | 8252 | 313 | 313 | 3.79% | 3.79% | 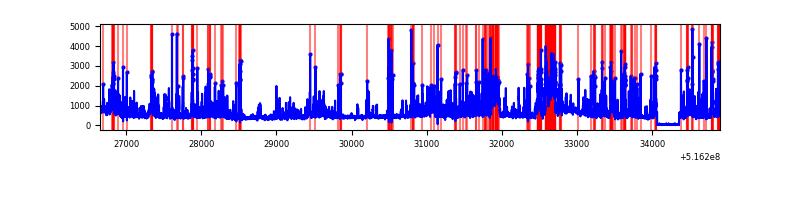 |
Top three noisy pixels from each quadrant. If the there are fewer than three noisy pixels in the level2.evt file, extra rows are filled as -1
| Pixel properties | Quadrant properties | ||||||
|---|---|---|---|---|---|---|---|
| Quadrant | DetID | PixID | Counts | Sigma | Mean | Median | Sigma |
| A | 13 | 153 | 33436 | 151.97 | 875 | 850 | 214.4 |
| A | 3 | 128 | 26117 | 117.84 | 875 | 850 | 214.4 |
| A | 4 | 78 | 26071 | 117.62 | 875 | 850 | 214.4 |
| B | 4 | 206 | 1652452 | 9174.28 | 840 | 809 | 180.0 |
| B | 10 | 247 | 119761 | 660.74 | 840 | 809 | 180.0 |
| B | 5 | 185 | 119502 | 659.3 | 840 | 809 | 180.0 |
| C | 15 | 224 | 2269937 | 10132.92 | 826 | 816 | 223.9 |
| C | 14 | 254 | 124122 | 550.63 | 826 | 816 | 223.9 |
| C | 14 | 245 | 97116 | 430.03 | 826 | 816 | 223.9 |
| D | 3 | 12 | 880919 | 3789.56 | 829 | 792 | 232.3 |
| D | 2 | 249 | 553121 | 2378.16 | 829 | 792 | 232.3 |
| D | 8 | 240 | 396452 | 1703.59 | 829 | 792 | 232.3 |
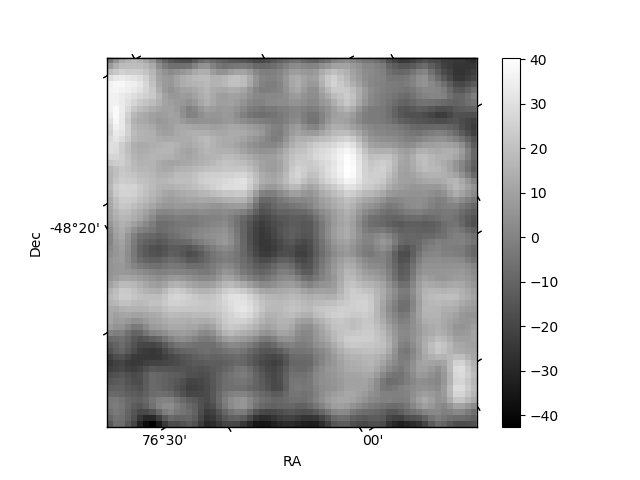
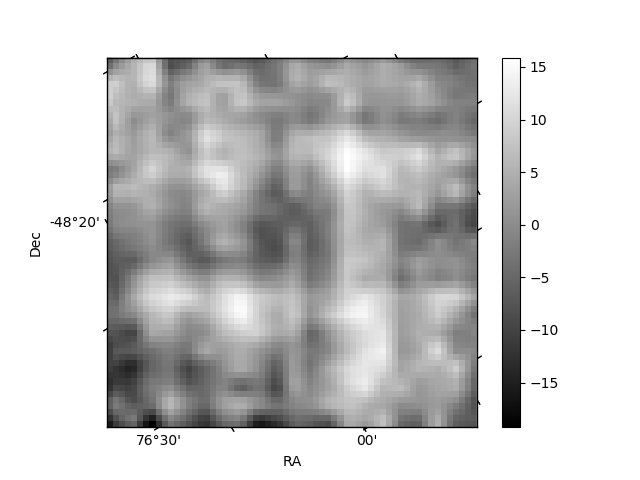
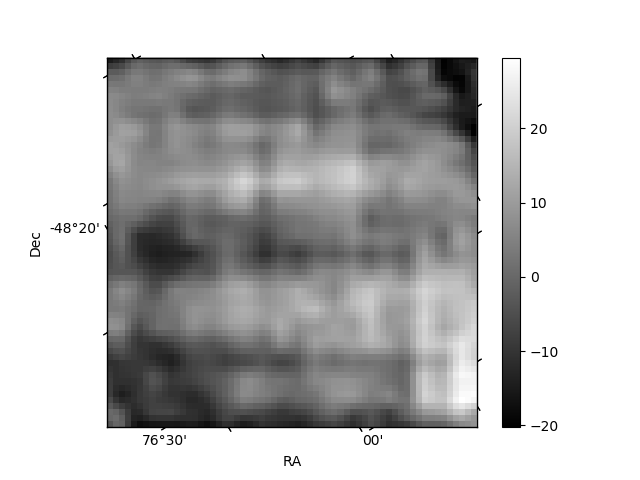
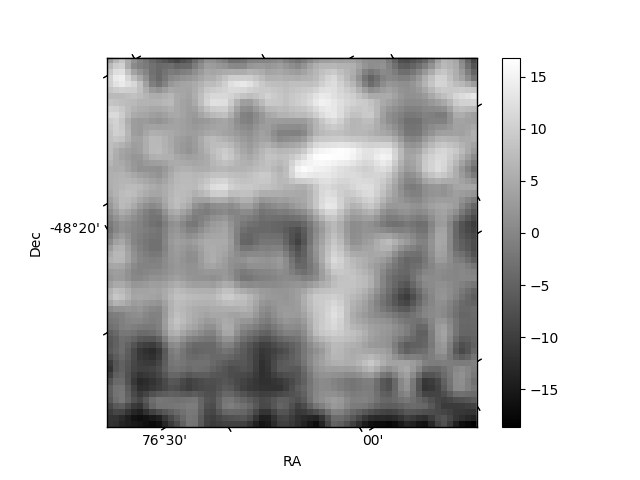
Histogram calculated using DETX and DETY for each event in the final _common_clean file
| Quadrant A | 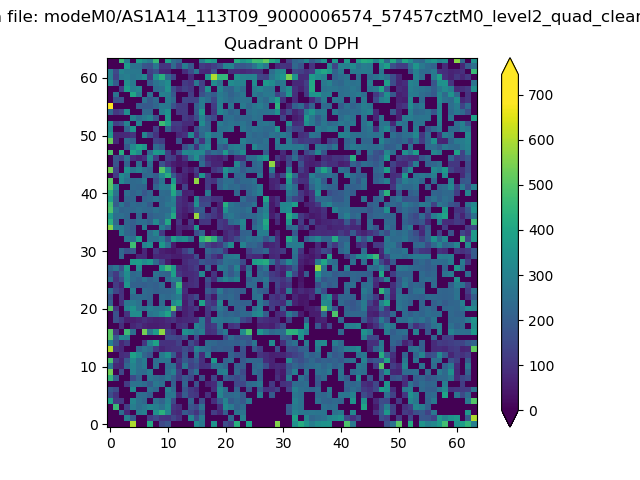 |
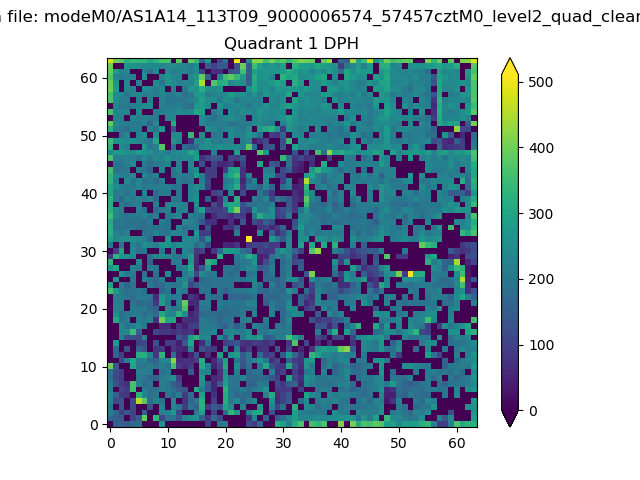 |
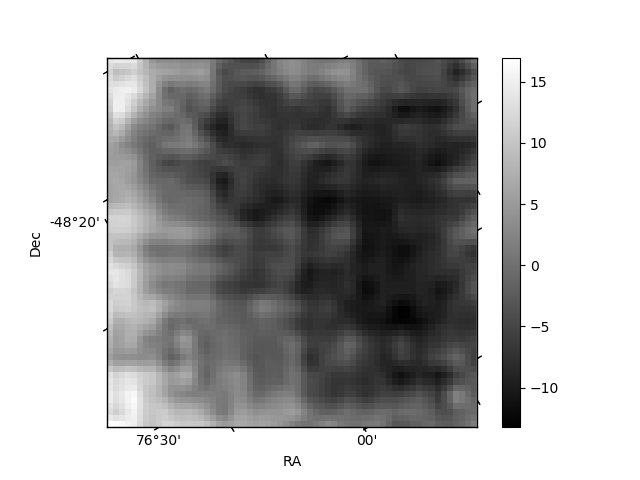
Quadrant B |
|---|---|---|---|
| Quadrant D | 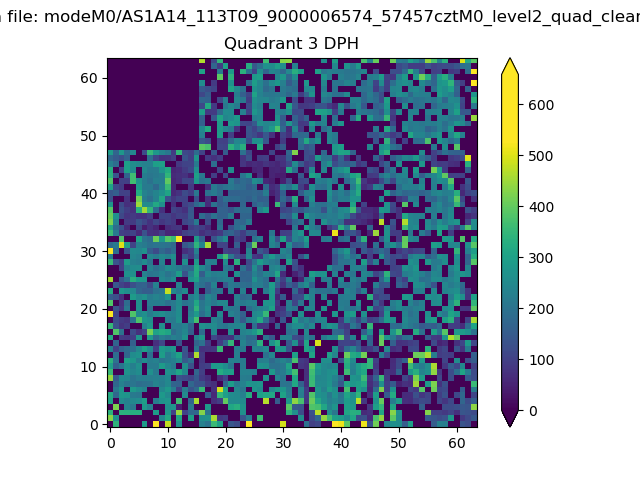 |
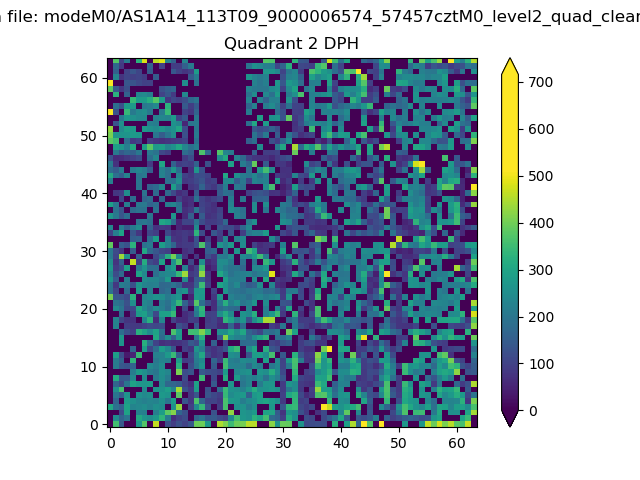 |
Quadrant C |
| Plot type | Count rate plots | Images |
|---|---|---|
| Comparison with Poisson distribution Blue bars denote a histogram of data divided into 1 sec bins. Red curve is a Poisson curve with rate = median count rate of data. |
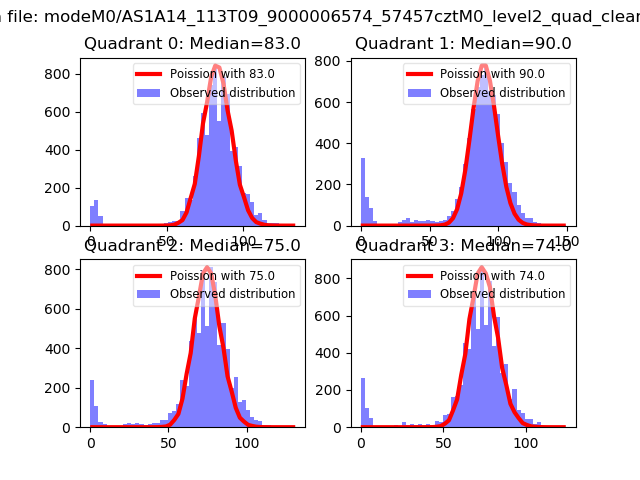 |
 |
| Quadrant-wise count rates Data is divided into 100 sec bins |
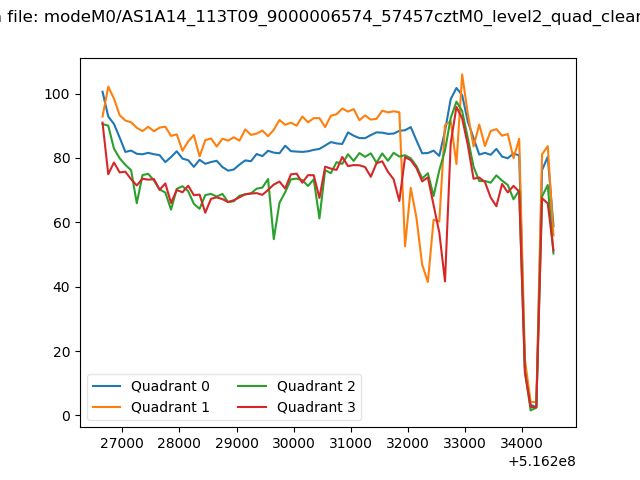 |
|
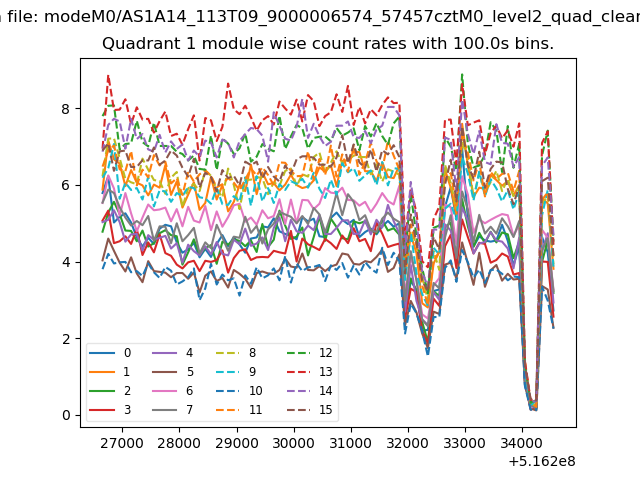
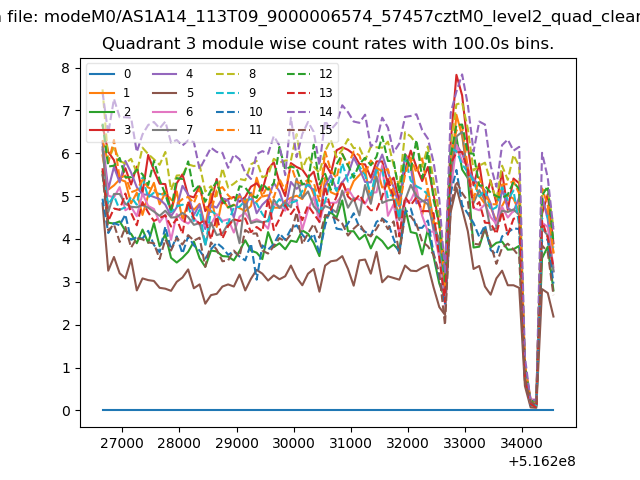
| Module-wise count rates for Quadrant A Data is divided into 100 sec bins |
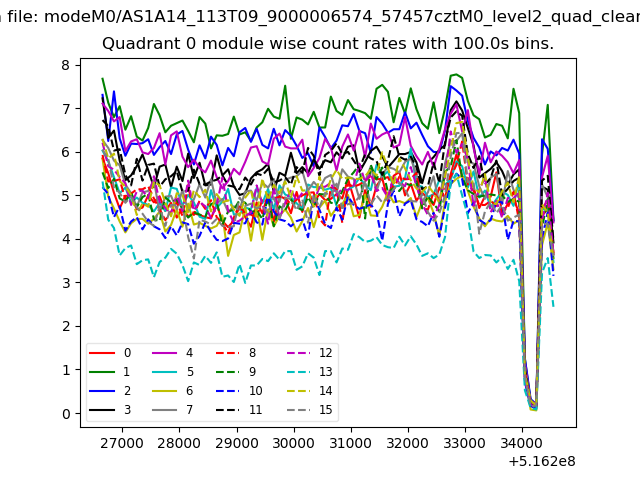 |
 |
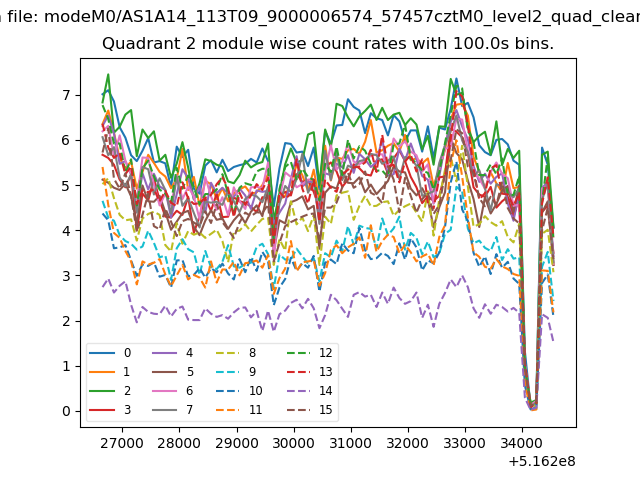
| Module-wise count rates for Quadrant B Data is divided into 100 sec bins |
 |
 |
| Module-wise count rates for Quadrant C Data is divided into 100 sec bins |
 |
 |
| Module-wise count rates for Quadrant D Data is divided into 100 sec bins |
 |
 |
| Parameter | Plot |
|---|---|
| CZT HV Monitor | 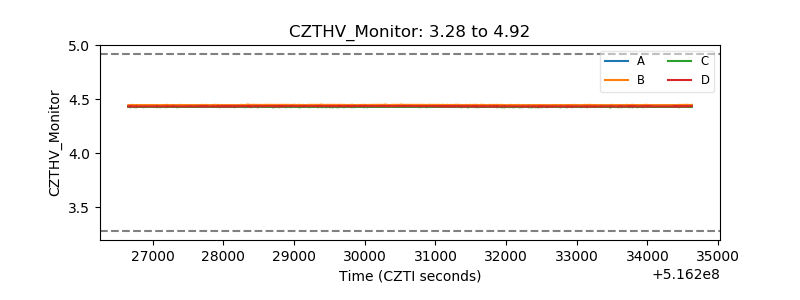 |
| D_VDD | 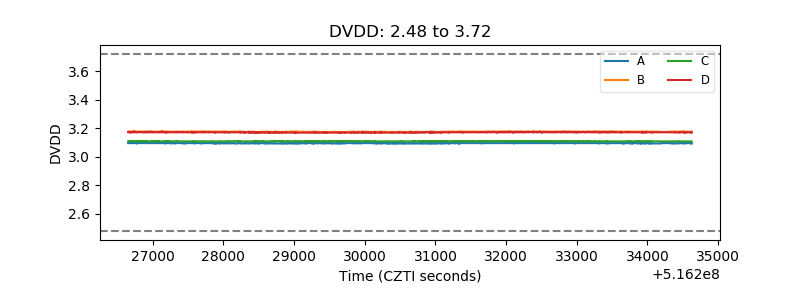 |
| Temperature 1 | 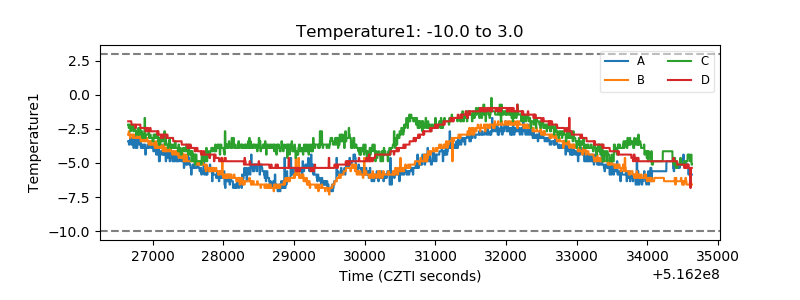 |
| Veto HV Monitor | 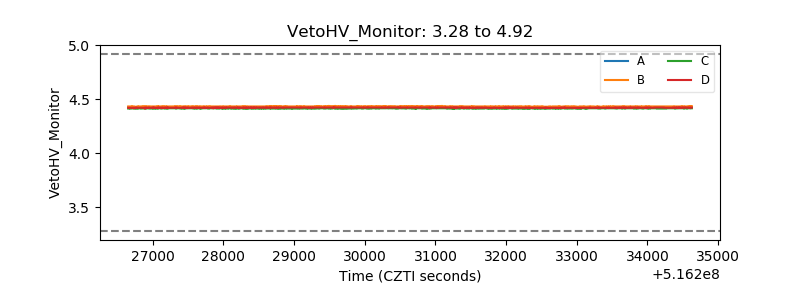 |
| Veto LLD | 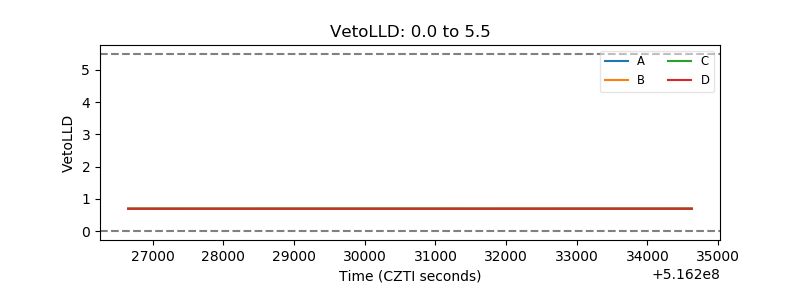 |
| Alpha Counter | 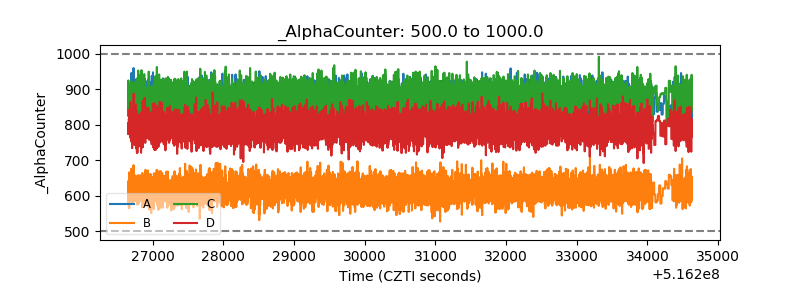 |
| _CPM_Rate | 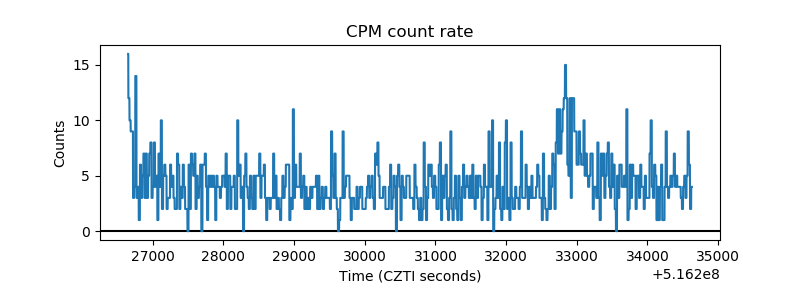 |
| CZT Counter | 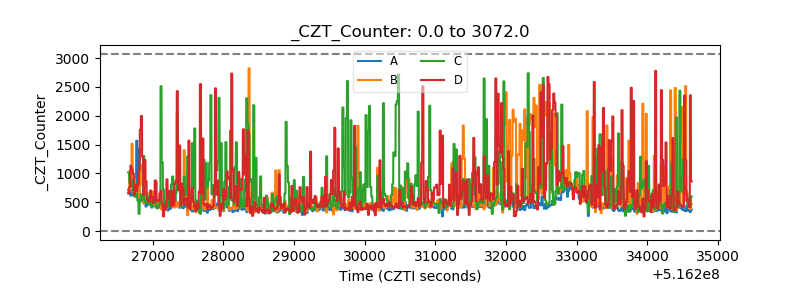 |
| +2.5 Volts monitor | 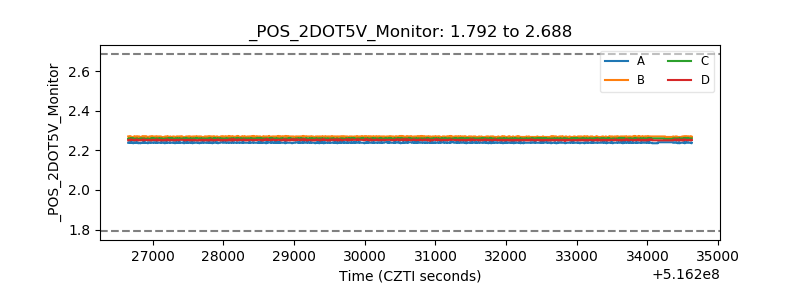 |
| +5 Volts monitor |  |
| _ROLL_ROT | 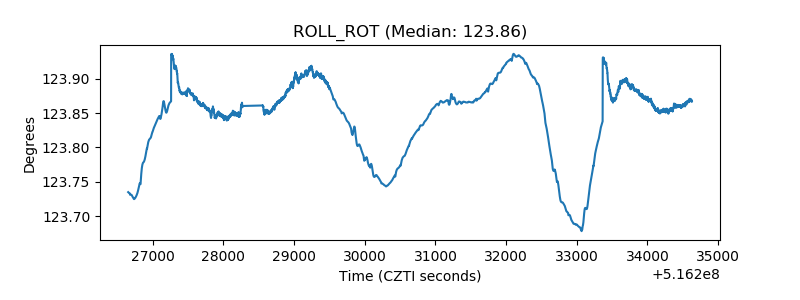 |
| _Roll_DEC | 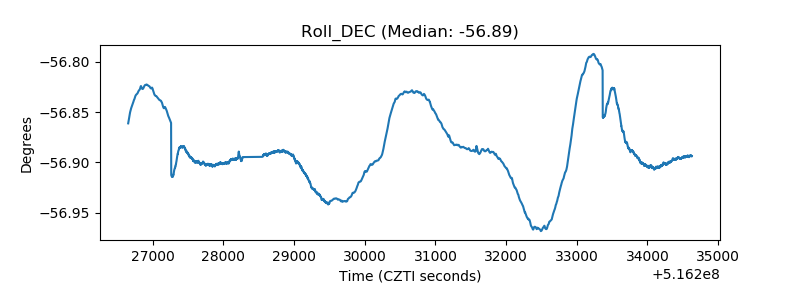 |
| _Roll_RA | 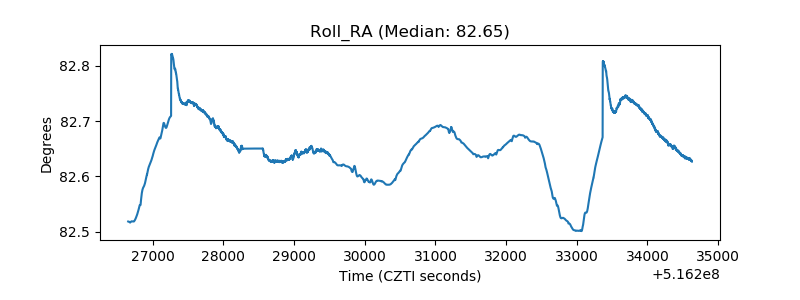 |
| Veto Counter | 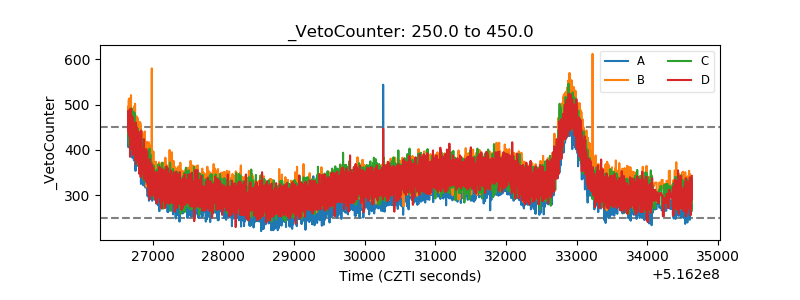 |