| Param | Original file | Final file |
|---|---|---|
| Filename | modeM0/AS1A14_113T09_9000006574_57460cztM0_level2.fits | modeM0/AS1A14_113T09_9000006574_57460cztM0_level2_quad_clean.evt |
| Size (bytes) | 1,387,987,200 | 220,296,960 |
| Size | 1.3 GB | 210.1 MB |
| Events in quadrant A | 8,682,789 | 1,405,528 |
| Events in quadrant B | 13,536,104 | 1,476,574 |
| Events in quadrant C | 13,812,925 | 1,274,952 |
| Events in quadrant D | 13,833,292 | 1,164,404 |
| Mode SS | |||
|---|---|---|---|
| Quadrant | BADHDUFLAG | Total packets | Discarded packets |
| A | 0 | 396 | 0 |
| B | 0 | 396 | 0 |
| C | 0 | 396 | 0 |
| D | 0 | 396 | 0 |
| Mode M9 | |||
|---|---|---|---|
| Quadrant | BADHDUFLAG | Total packets | Discarded packets |
| A | 0 | 14 | 0 |
| B | 0 | 14 | 0 |
| C | 0 | 14 | 0 |
| D | 0 | 14 | 0 |
| Mode M0 | |||
|---|---|---|---|
| Quadrant | BADHDUFLAG | Total packets | Discarded packets |
| A | 0 | 40373 | 3 |
| B | 0 | 54000 | 3 |
| C | 0 | 54109 | 3 |
| D | 0 | 54564 | 3 |
| Quadrant | Total seconds | Saturated seconds | Saturation percentage |
|---|---|---|---|
| A | 19560 | 244 | 1.247444% |
| B | 19561 | 1838 | 9.396248% |
| C | 19561 | 998 | 5.101989% |
| D | 19561 | 1141 | 5.833035% |
Noise dominated data is calculated using 1-second bins in cleaned event files. If a bin has >2000 counts, and if more than 50% of those come from <1% of pixels, then it is considered to be noise-dominated and hence unusable.
| Quadrant | # 1 sec bins | Bins with >0 counts | Bins with >2000 counts | High rate bins dominated by noise | Noise dominated (total time) | Noise dominated (detector-on time) | Marked lightcurve |
|---|---|---|---|---|---|---|---|
| A | 21149 | 19850 | 8 | 8 | 0.04% | 0.04% | 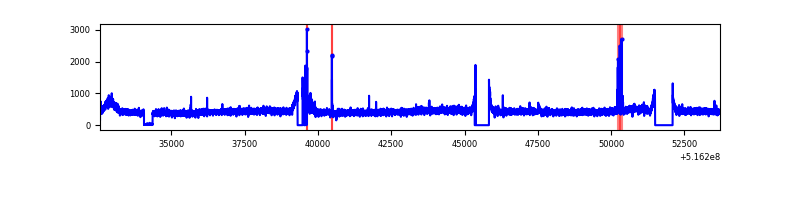 |
| B | 21150 | 19850 | 875 | 875 | 4.14% | 4.41% | 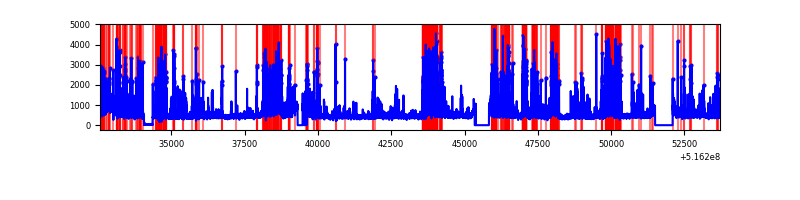 |
| C | 21150 | 19848 | 619 | 619 | 2.93% | 3.12% | 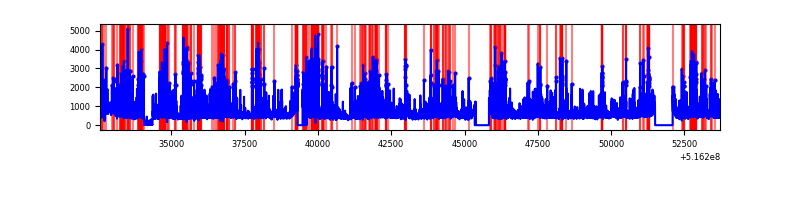 |
| D | 21150 | 19851 | 826 | 826 | 3.91% | 4.16% | 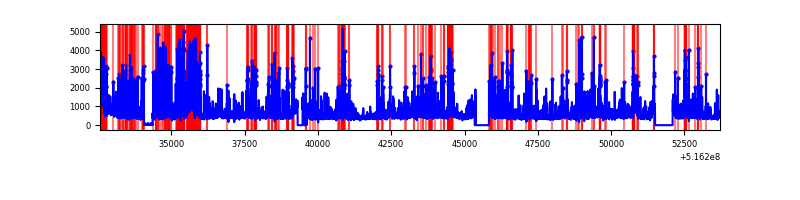 |
Top three noisy pixels from each quadrant. If the there are fewer than three noisy pixels in the level2.evt file, extra rows are filled as -1
| Pixel properties | Quadrant properties | ||||||
|---|---|---|---|---|---|---|---|
| Quadrant | DetID | PixID | Counts | Sigma | Mean | Median | Sigma |
| A | 13 | 153 | 166224 | 313.1 | 2146 | 2090 | 524.2 |
| A | 3 | 14 | 76471 | 141.89 | 2146 | 2090 | 524.2 |
| A | 3 | 128 | 56565 | 103.92 | 2146 | 2090 | 524.2 |
| B | 4 | 206 | 4381224 | 9944.46 | 2056 | 1977 | 440.4 |
| B | 5 | 185 | 260409 | 586.85 | 2056 | 1977 | 440.4 |
| B | 10 | 247 | 232027 | 522.4 | 2056 | 1977 | 440.4 |
| C | 15 | 224 | 4169881 | 7583.94 | 2042 | 2025 | 549.6 |
| C | 14 | 67 | 402842 | 729.34 | 2042 | 2025 | 549.6 |
| C | 1 | 16 | 286012 | 516.75 | 2042 | 2025 | 549.6 |
| D | 15 | 142 | 1824442 | 3210.27 | 2038 | 1948 | 567.7 |
| D | 7 | 96 | 1325377 | 2331.18 | 2038 | 1948 | 567.7 |
| D | 3 | 12 | 759514 | 1334.43 | 2038 | 1948 | 567.7 |
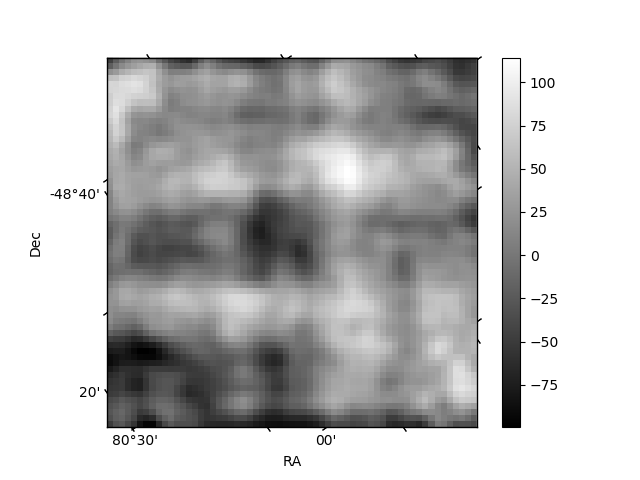
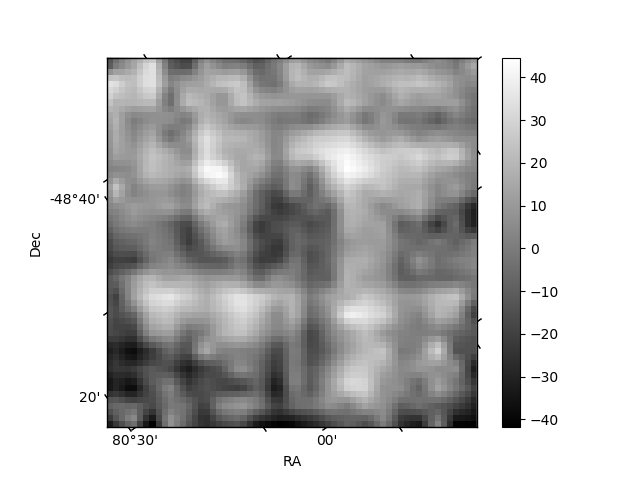
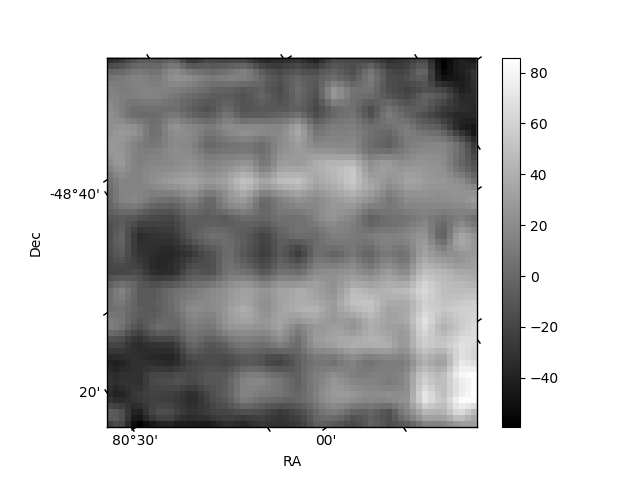
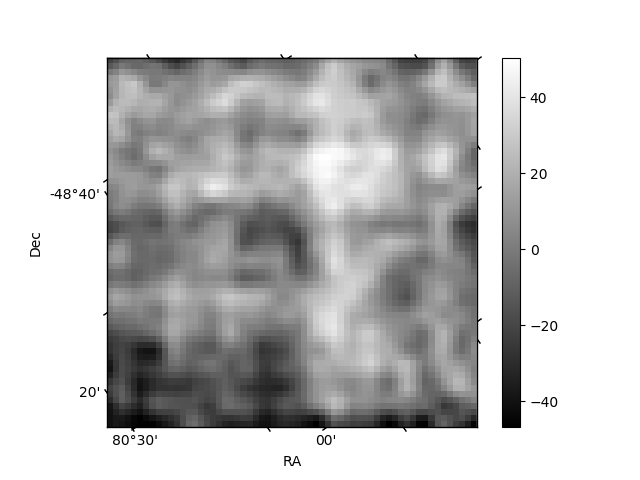
Histogram calculated using DETX and DETY for each event in the final _common_clean file
| Quadrant A | 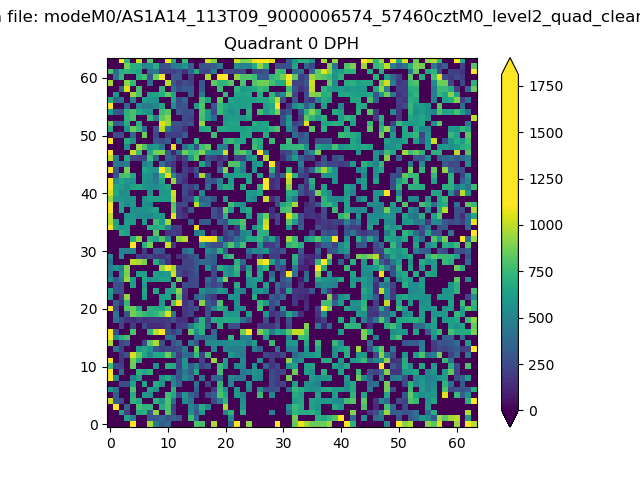 |
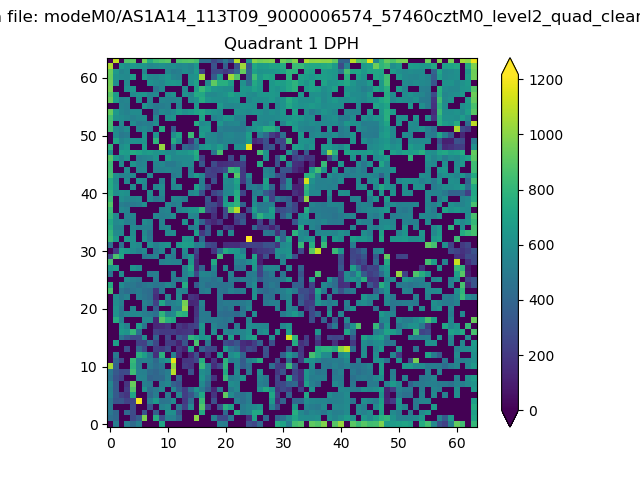 |
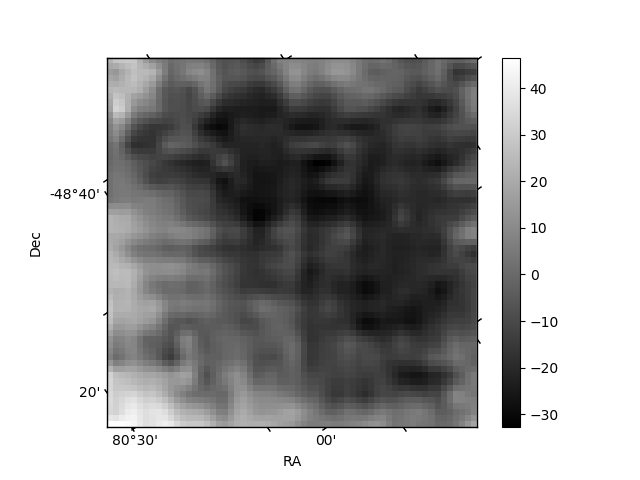
Quadrant B |
|---|---|---|---|
| Quadrant D | 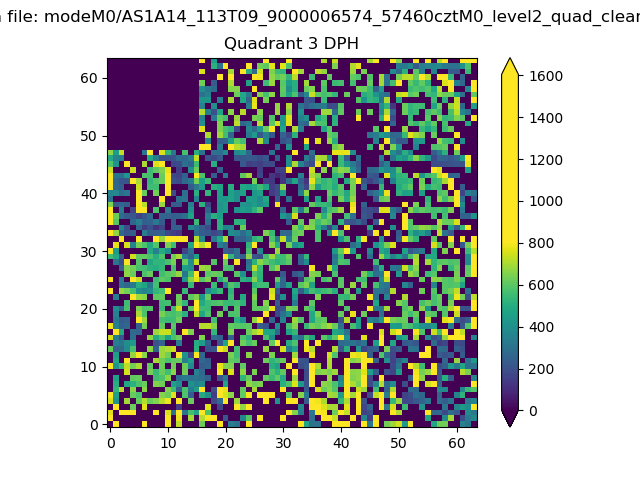 |
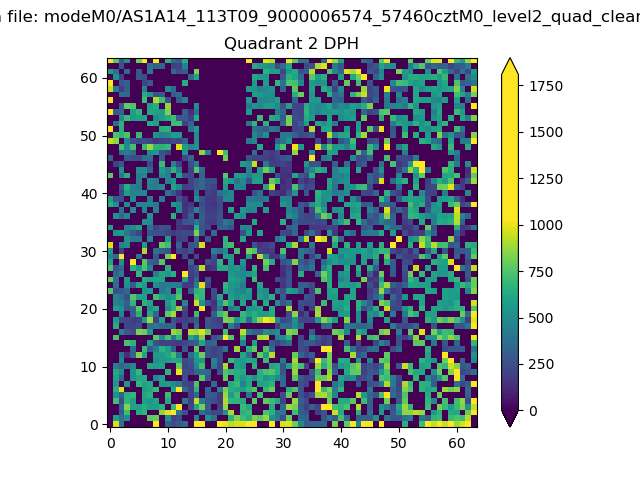 |
Quadrant C |
| Plot type | Count rate plots | Images |
|---|---|---|
| Comparison with Poisson distribution Blue bars denote a histogram of data divided into 1 sec bins. Red curve is a Poisson curve with rate = median count rate of data. |
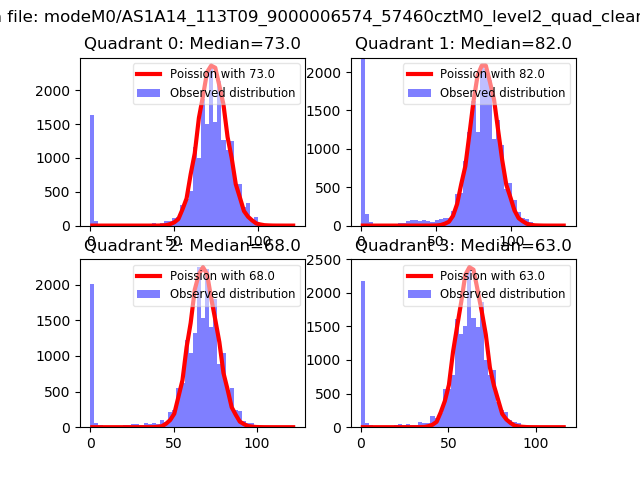 |
 |
| Quadrant-wise count rates Data is divided into 100 sec bins |
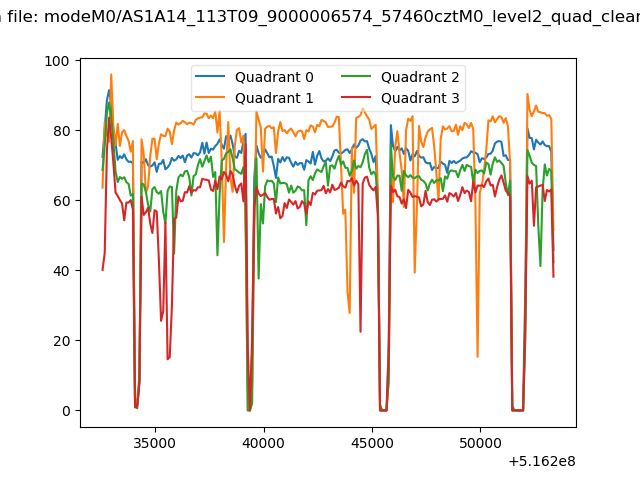 |
|
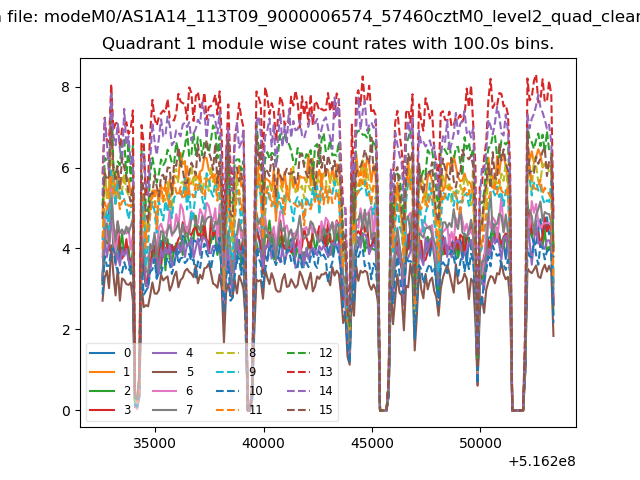
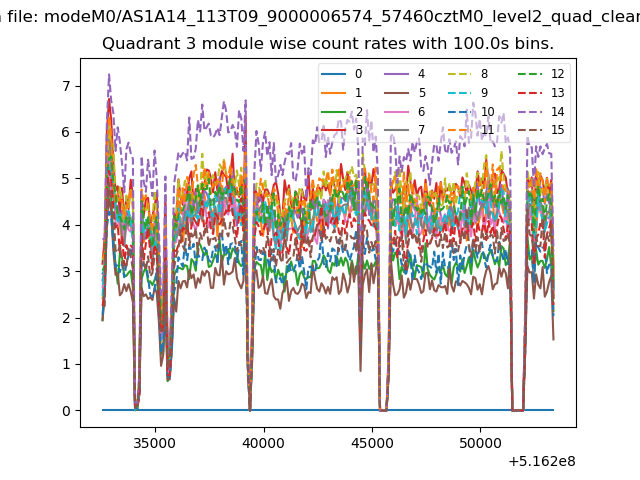
| Module-wise count rates for Quadrant A Data is divided into 100 sec bins |
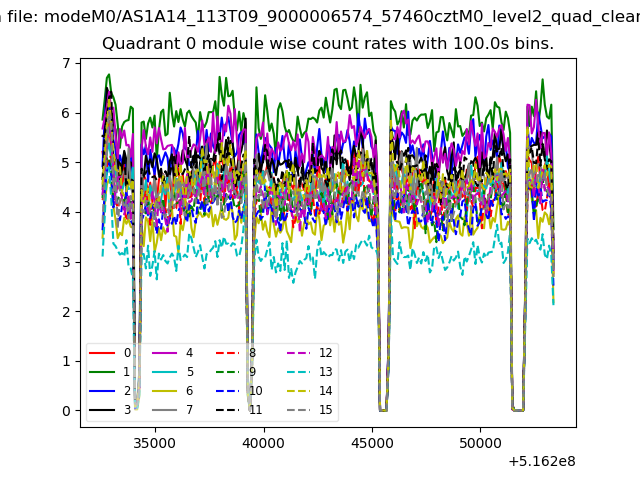 |
 |
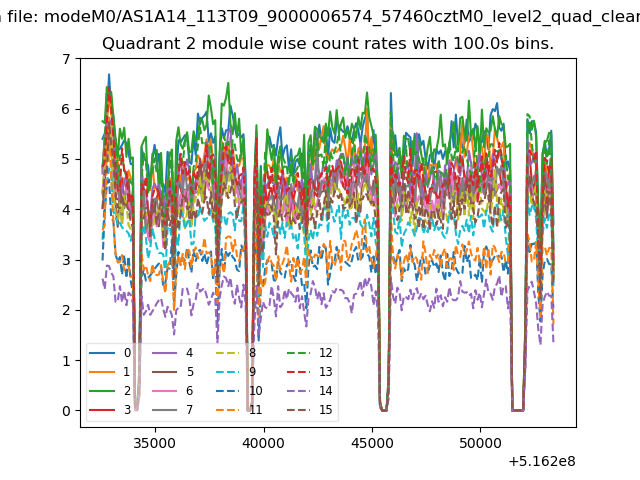
| Module-wise count rates for Quadrant B Data is divided into 100 sec bins |
 |
 |
| Module-wise count rates for Quadrant C Data is divided into 100 sec bins |
 |
 |
| Module-wise count rates for Quadrant D Data is divided into 100 sec bins |
 |
 |
| Parameter | Plot |
|---|---|
| CZT HV Monitor | 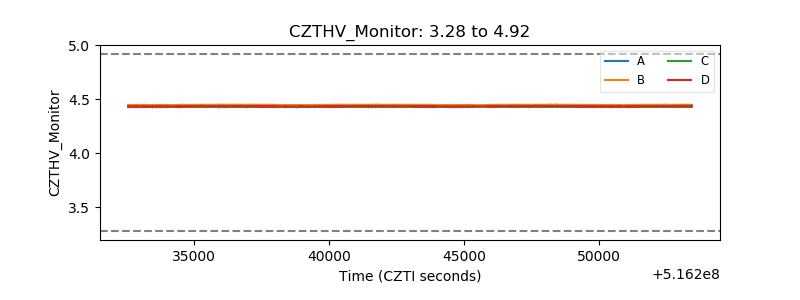 |
| D_VDD | 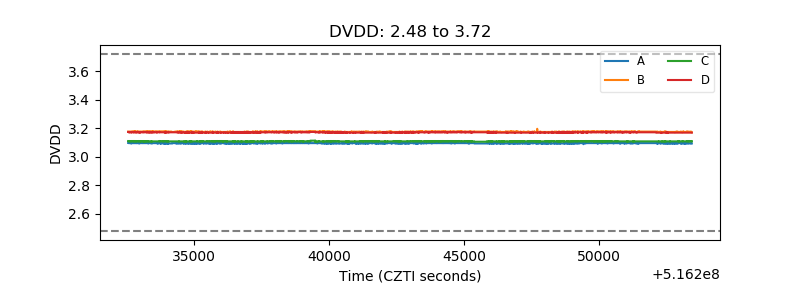 |
| Temperature 1 | 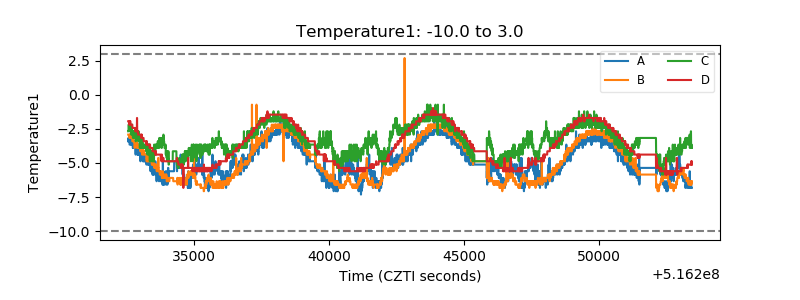 |
| Veto HV Monitor | 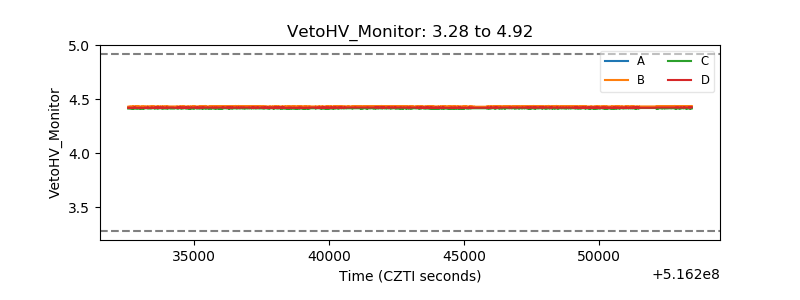 |
| Veto LLD | 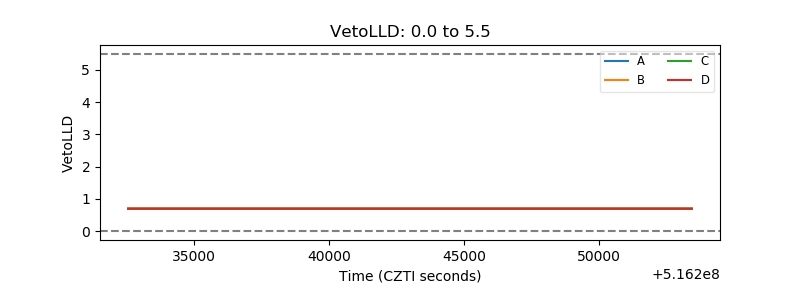 |
| Alpha Counter | 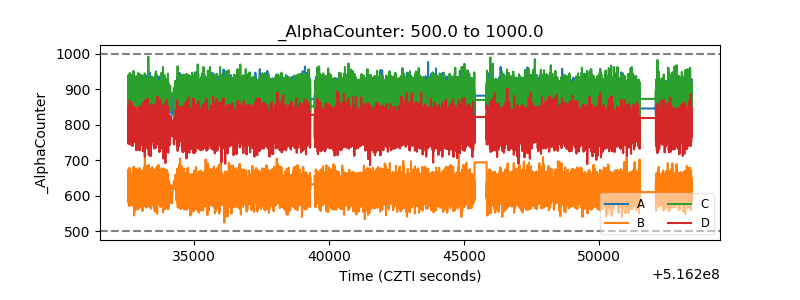 |
| _CPM_Rate | 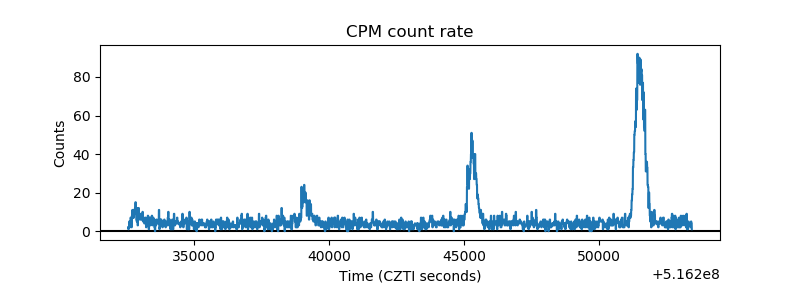 |
| CZT Counter | 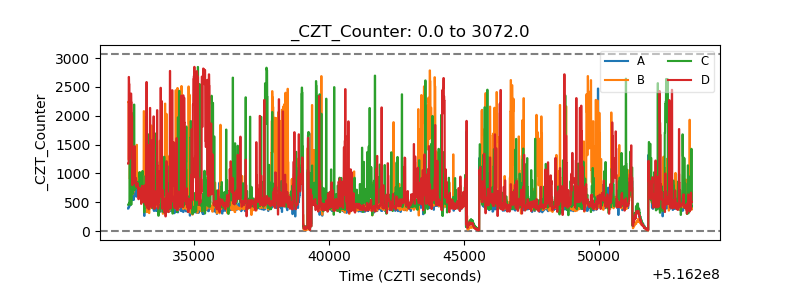 |
| +2.5 Volts monitor | 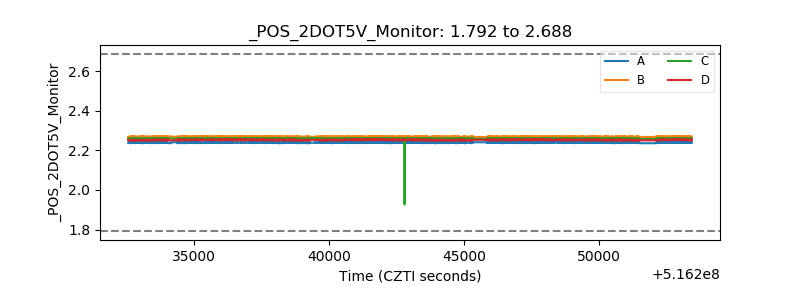 |
| +5 Volts monitor | 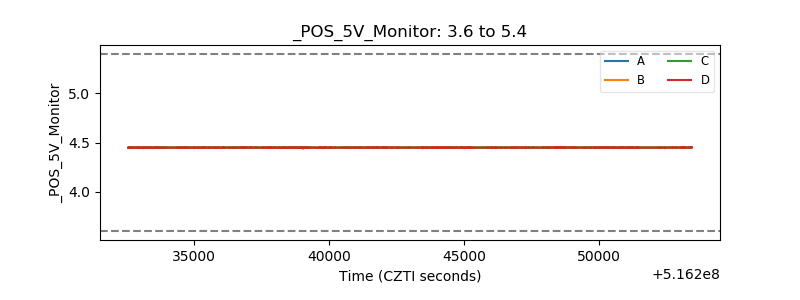 |
| _ROLL_ROT | 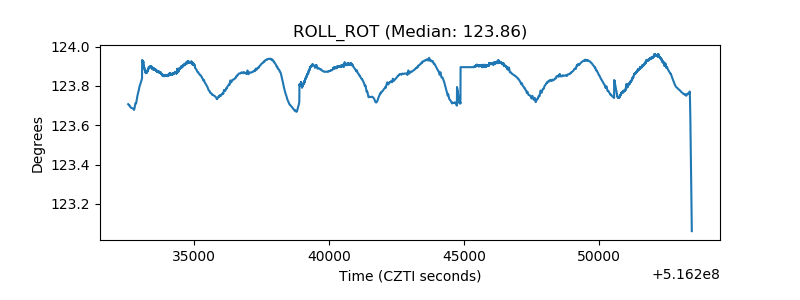 |
| _Roll_DEC | 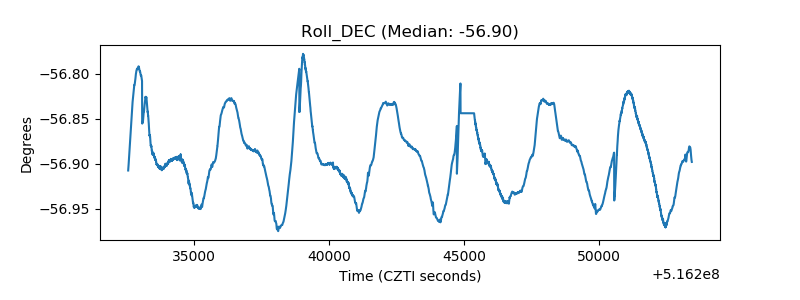 |
| _Roll_RA | 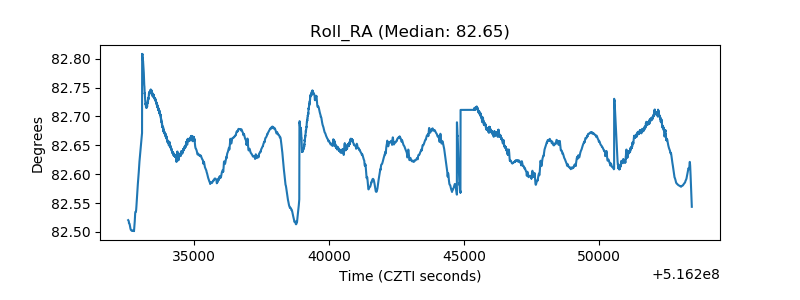 |
| Veto Counter | 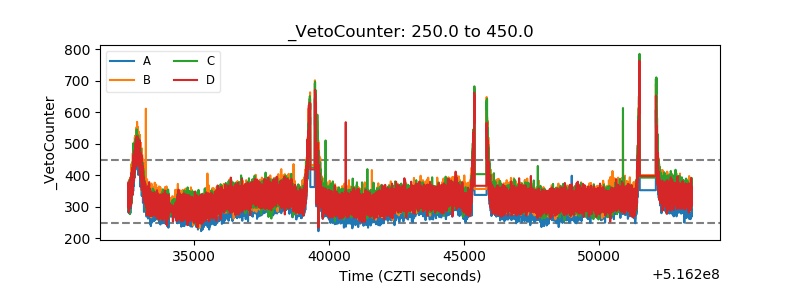 |