| Param | Original file | Final file |
|---|---|---|
| Filename | modeM0/AS1A14_113T09_9000006574_57464cztM0_level2.fits | modeM0/AS1A14_113T09_9000006574_57464cztM0_level2_quad_clean.evt |
| Size (bytes) | 467,066,880 | 94,164,480 |
| Size | 445.4 MB | 89.8 MB |
| Events in quadrant A | 2,798,524 | 633,811 |
| Events in quadrant B | 3,898,920 | 654,755 |
| Events in quadrant C | 6,132,564 | 549,040 |
| Events in quadrant D | 3,959,539 | 564,862 |
| Mode SS | |||
|---|---|---|---|
| Quadrant | BADHDUFLAG | Total packets | Discarded packets |
| A | 0 | 132 | 0 |
| B | 0 | 132 | 0 |
| C | 0 | 132 | 0 |
| D | 0 | 132 | 0 |
| Mode M9 | |||
|---|---|---|---|
| Quadrant | BADHDUFLAG | Total packets | Discarded packets |
| A | 0 | 10 | 0 |
| B | 0 | 10 | 0 |
| C | 0 | 10 | 0 |
| D | 0 | 10 | 0 |
| Mode M0 | |||
|---|---|---|---|
| Quadrant | BADHDUFLAG | Total packets | Discarded packets |
| A | 0 | 13066 | 1 |
| B | 0 | 15942 | 1 |
| C | 0 | 22562 | 1 |
| D | 0 | 16057 | 1 |
| Quadrant | Total seconds | Saturated seconds | Saturation percentage |
|---|---|---|---|
| A | 6427 | 42 | 0.653493% |
| B | 6428 | 354 | 5.507156% |
| C | 6428 | 805 | 12.523335% |
| D | 6428 | 207 | 3.220286% |
Noise dominated data is calculated using 1-second bins in cleaned event files. If a bin has >2000 counts, and if more than 50% of those come from <1% of pixels, then it is considered to be noise-dominated and hence unusable.
| Quadrant | # 1 sec bins | Bins with >0 counts | Bins with >2000 counts | High rate bins dominated by noise | Noise dominated (total time) | Noise dominated (detector-on time) | Marked lightcurve |
|---|---|---|---|---|---|---|---|
| A | 7482 | 6428 | 3 | 3 | 0.04% | 0.05% | 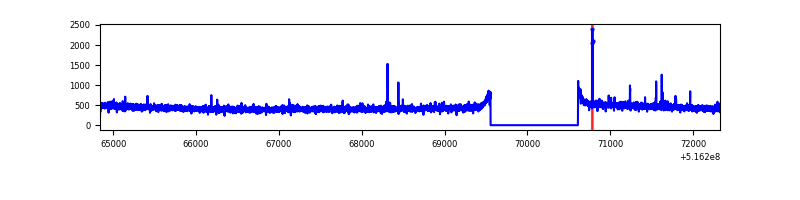 |
| B | 7482 | 6428 | 195 | 195 | 2.61% | 3.03% | 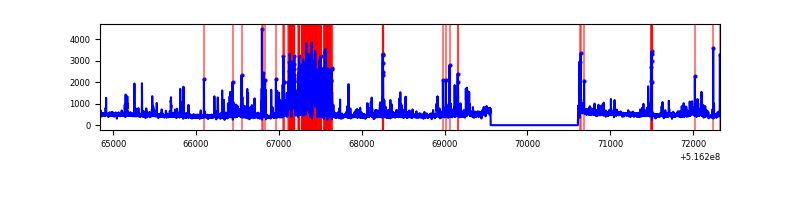 |
| C | 7483 | 6429 | 639 | 639 | 8.54% | 9.94% | 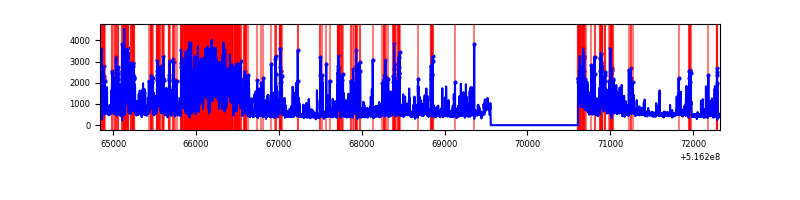 |
| D | 7483 | 6429 | 139 | 139 | 1.86% | 2.16% | 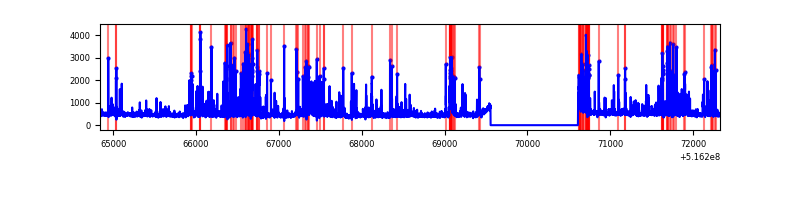 |
Top three noisy pixels from each quadrant. If the there are fewer than three noisy pixels in the level2.evt file, extra rows are filled as -1
| Pixel properties | Quadrant properties | ||||||
|---|---|---|---|---|---|---|---|
| Quadrant | DetID | PixID | Counts | Sigma | Mean | Median | Sigma |
| A | 8 | 9 | 16018 | 87.7 | 712 | 694 | 174.7 |
| A | 3 | 14 | 11044 | 59.24 | 712 | 694 | 174.7 |
| A | 4 | 3 | 9726 | 51.69 | 712 | 694 | 174.7 |
| B | 4 | 206 | 823867 | 5655.56 | 683 | 658 | 145.6 |
| B | 10 | 247 | 116026 | 792.59 | 683 | 658 | 145.6 |
| B | 5 | 185 | 66178 | 450.13 | 683 | 658 | 145.6 |
| C | 15 | 224 | 1772317 | 9877.43 | 659 | 653 | 179.4 |
| C | 6 | 13 | 1237753 | 6897.12 | 659 | 653 | 179.4 |
| C | 1 | 16 | 309048 | 1719.37 | 659 | 653 | 179.4 |
| D | 7 | 96 | 453800 | 2342.33 | 687 | 657 | 193.5 |
| D | 2 | 249 | 240633 | 1240.45 | 687 | 657 | 193.5 |
| D | 2 | 153 | 177293 | 913.04 | 687 | 657 | 193.5 |
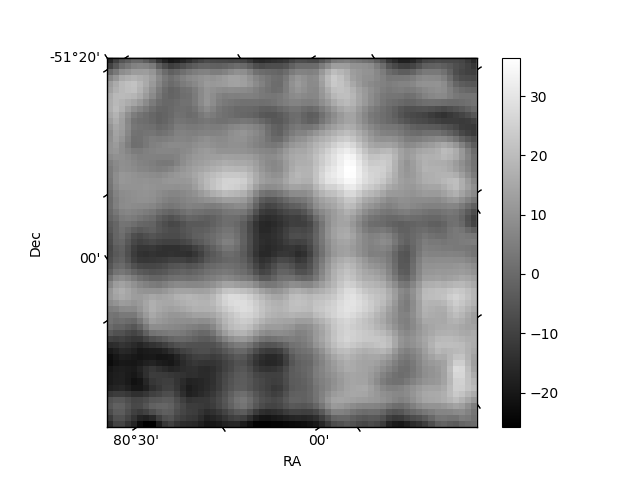
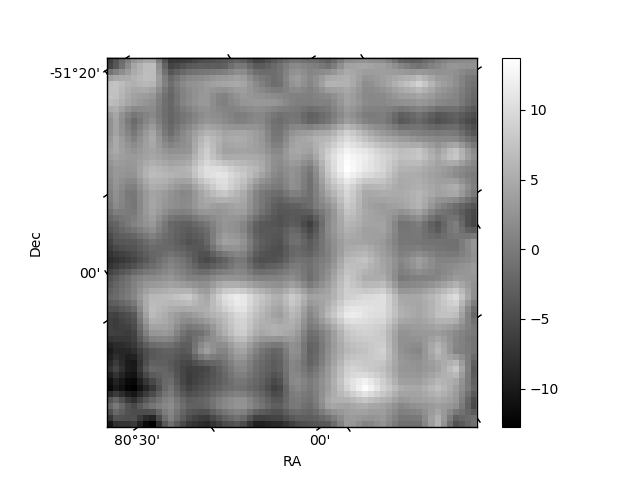
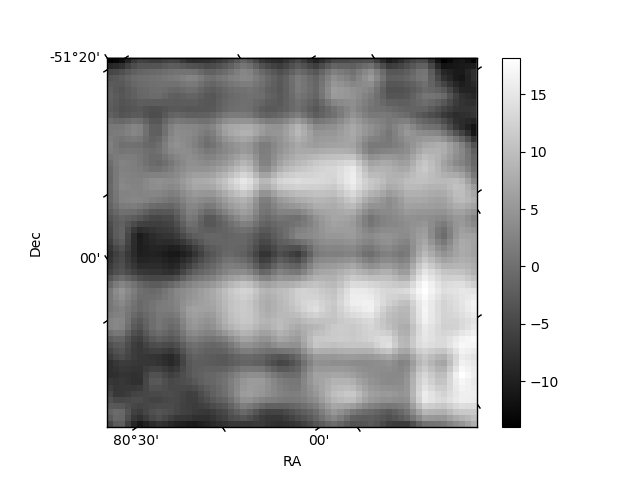
Histogram calculated using DETX and DETY for each event in the final _common_clean file
| Quadrant A | 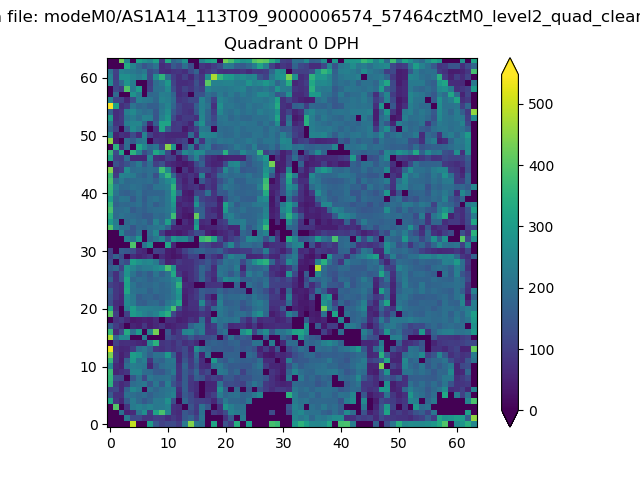 |
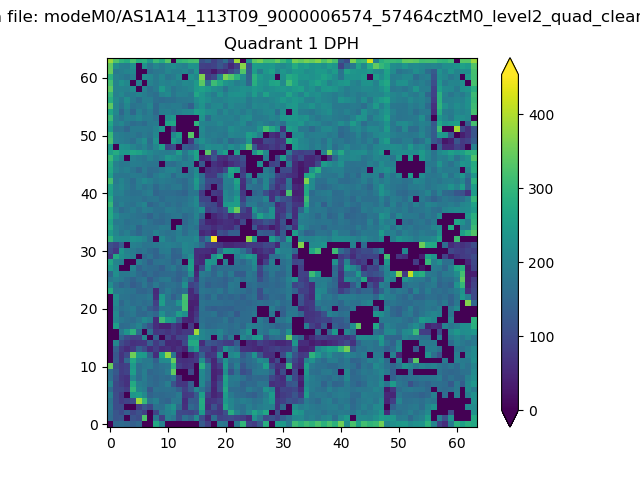 |
Quadrant B |
|---|---|---|---|
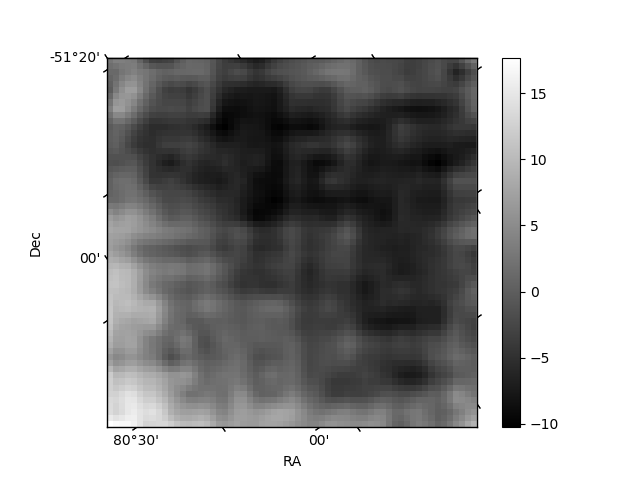
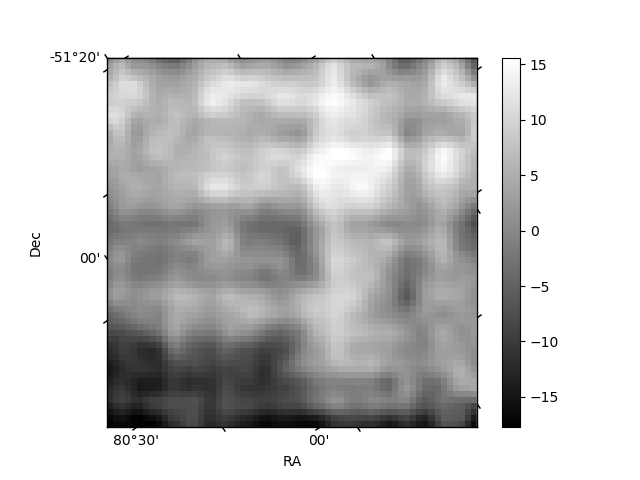
| Quadrant D | 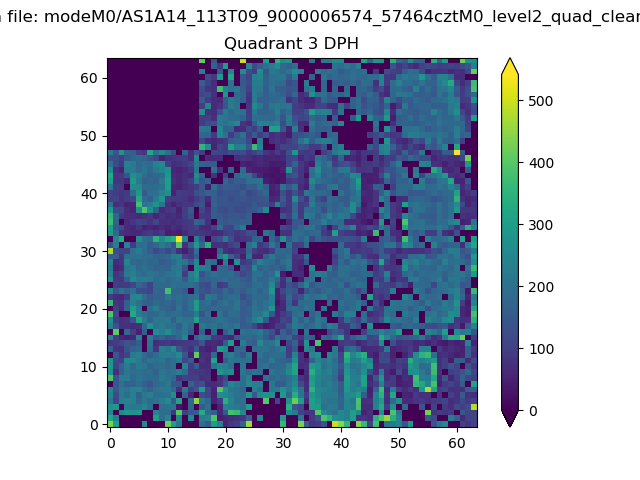 |
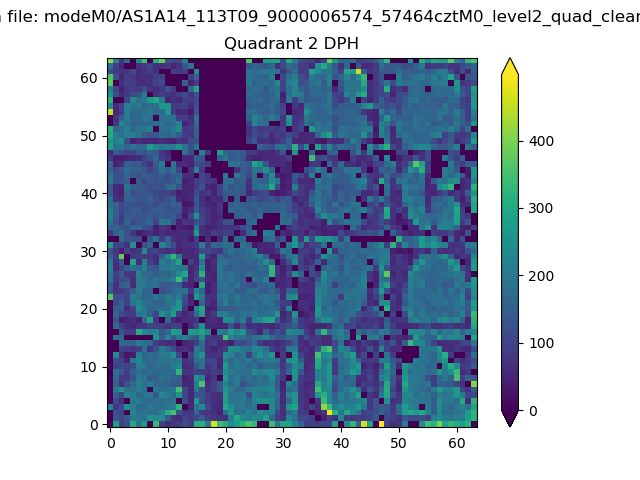 |
Quadrant C |
| Plot type | Count rate plots | Images |
|---|---|---|
| Comparison with Poisson distribution Blue bars denote a histogram of data divided into 1 sec bins. Red curve is a Poisson curve with rate = median count rate of data. |
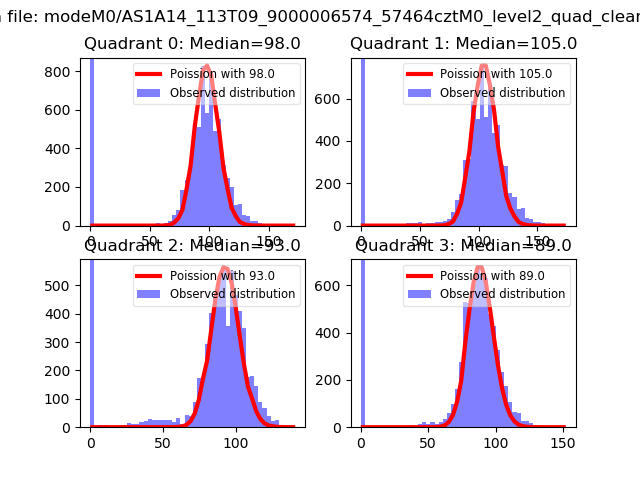 |
 |
| Quadrant-wise count rates Data is divided into 100 sec bins |
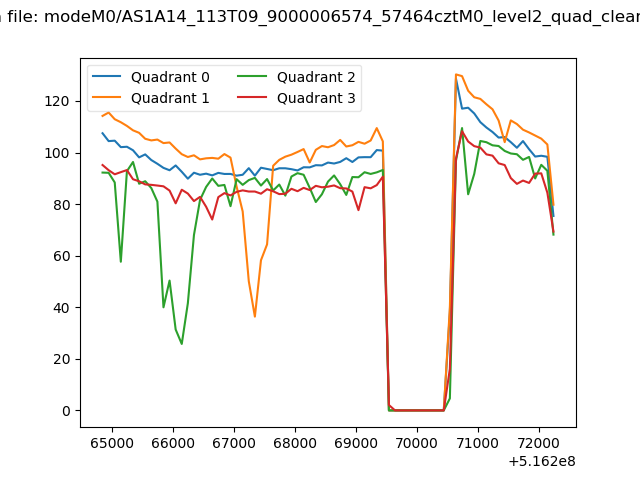 |
|
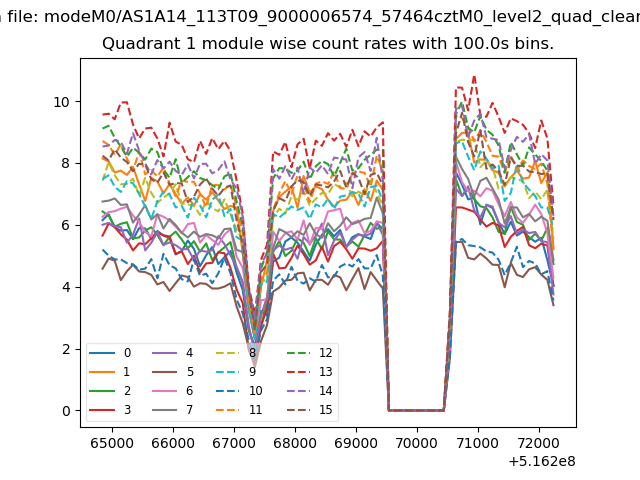
| Module-wise count rates for Quadrant A Data is divided into 100 sec bins |
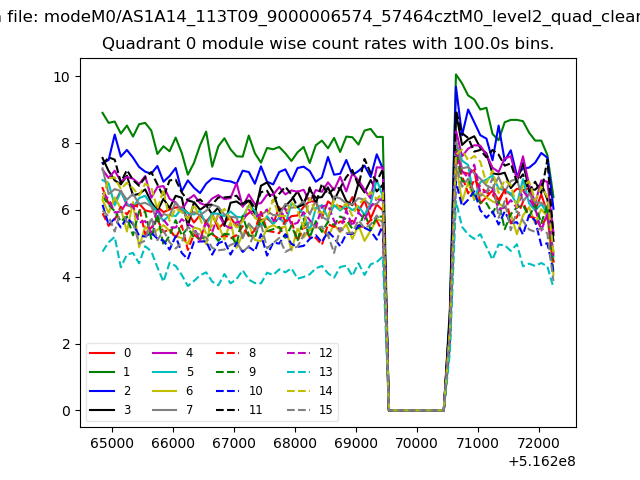 |
 |
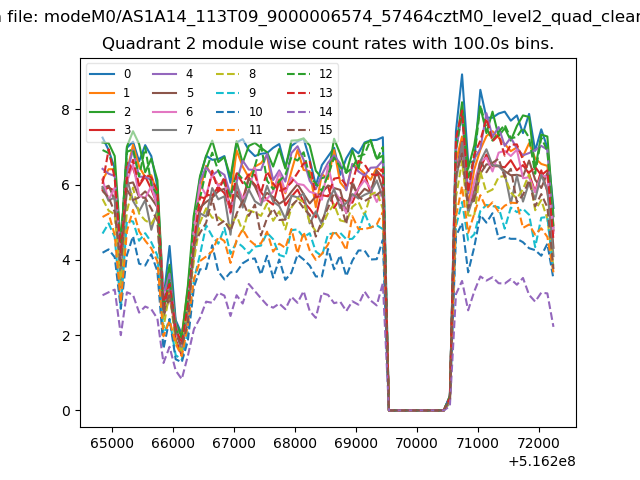
| Module-wise count rates for Quadrant B Data is divided into 100 sec bins |
 |
 |
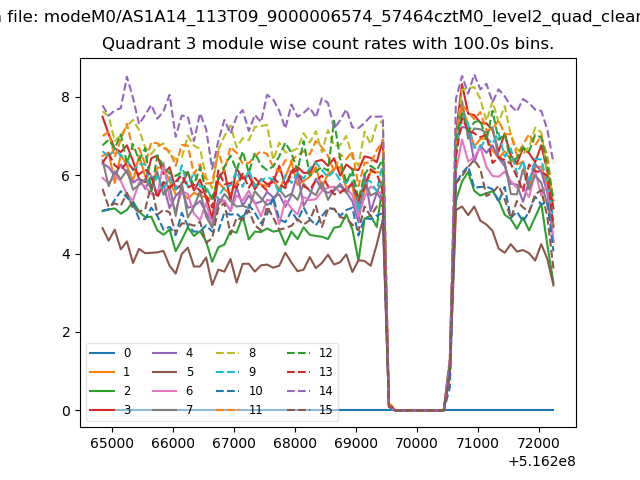
| Module-wise count rates for Quadrant C Data is divided into 100 sec bins |
 |
 |
| Module-wise count rates for Quadrant D Data is divided into 100 sec bins |
 |
 |
| Parameter | Plot |
|---|---|
| CZT HV Monitor | 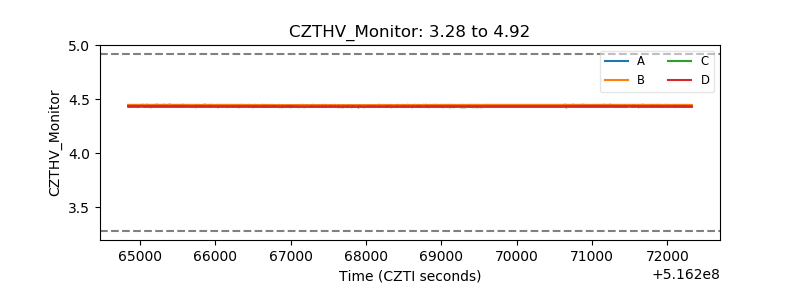 |
| D_VDD | 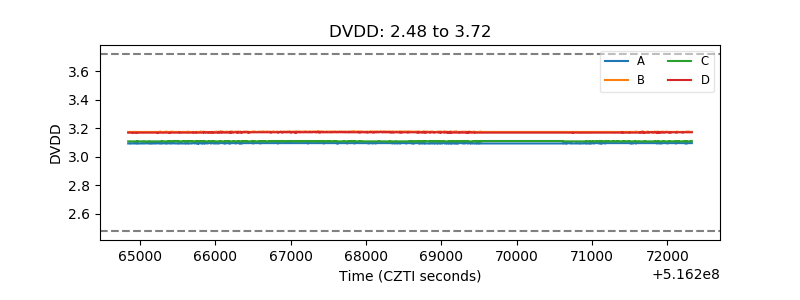 |
| Temperature 1 | 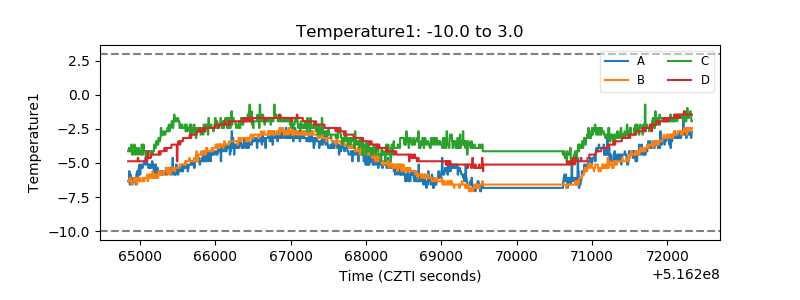 |
| Veto HV Monitor |  |
| Veto LLD | 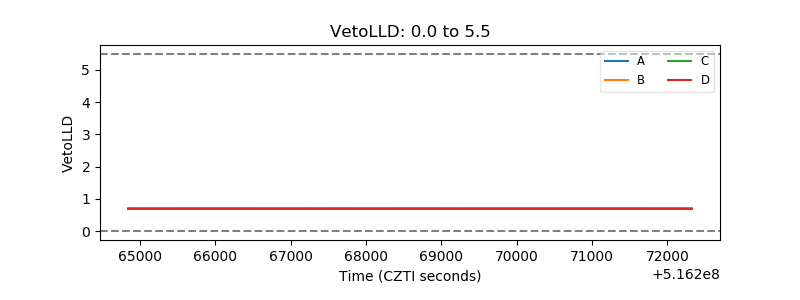 |
| Alpha Counter | 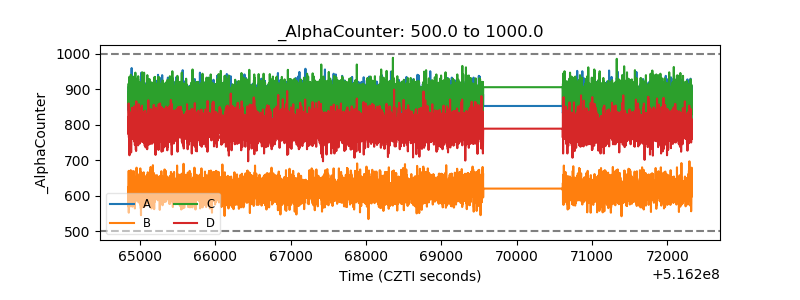 |
| _CPM_Rate | 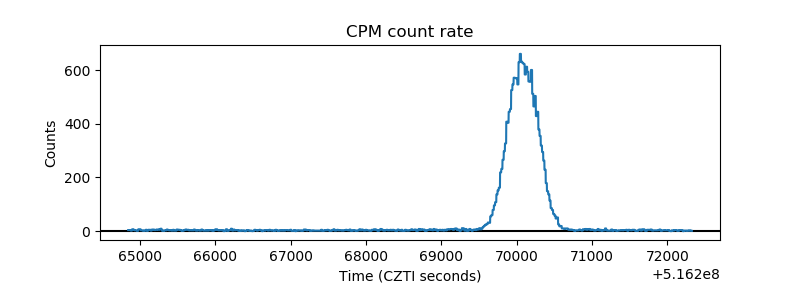 |
| CZT Counter | 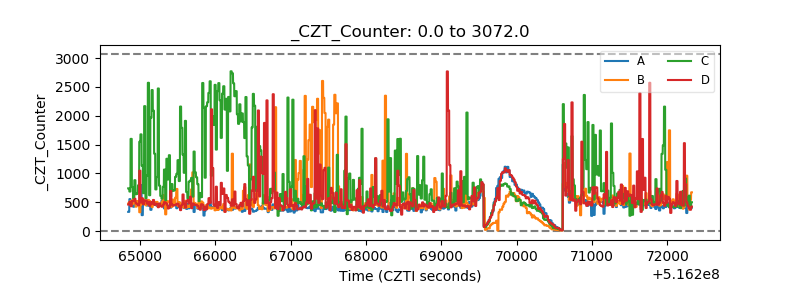 |
| +2.5 Volts monitor | 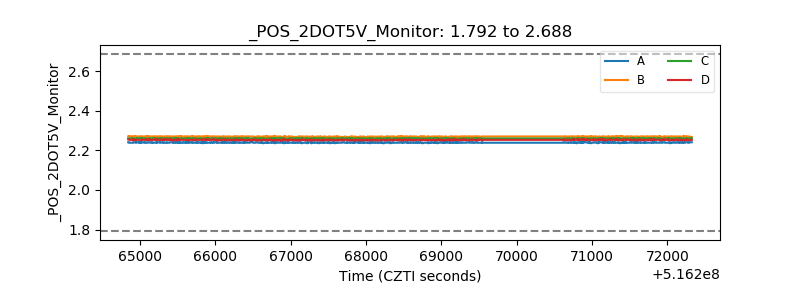 |
| +5 Volts monitor | 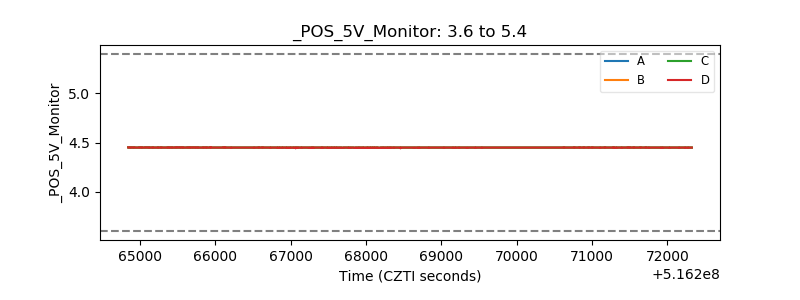 |
| _ROLL_ROT | 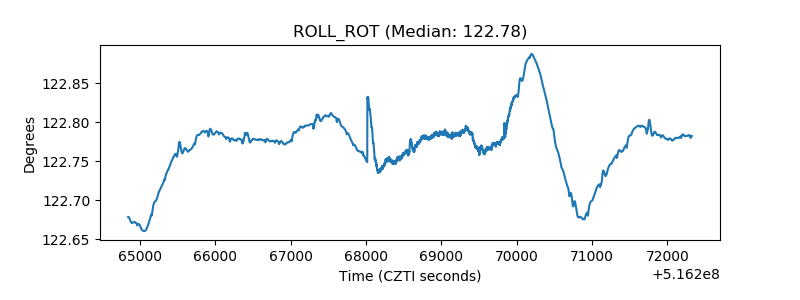 |
| _Roll_DEC | 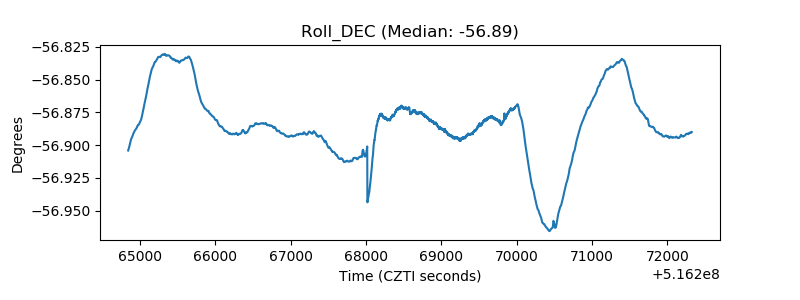 |
| _Roll_RA | 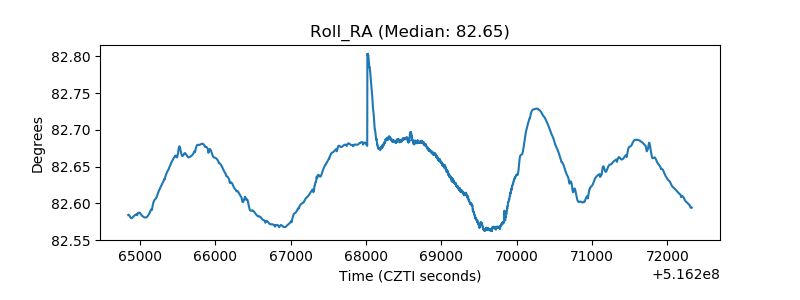 |
| Veto Counter | 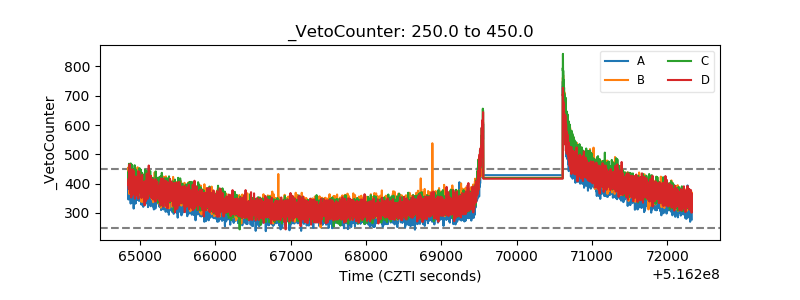 |