| Param | Original file | Final file |
|---|---|---|
| Filename | modeM0/AS1A14_113T09_9000006574_57465cztM0_level2.fits | modeM0/AS1A14_113T09_9000006574_57465cztM0_level2_quad_clean.evt |
| Size (bytes) | 486,005,760 | 96,281,280 |
| Size | 463.5 MB | 91.8 MB |
| Events in quadrant A | 2,924,981 | 655,870 |
| Events in quadrant B | 5,418,154 | 615,706 |
| Events in quadrant C | 4,930,403 | 601,940 |
| Events in quadrant D | 4,209,516 | 586,747 |
| Mode SS | |||
|---|---|---|---|
| Quadrant | BADHDUFLAG | Total packets | Discarded packets |
| A | 0 | 132 | 0 |
| B | 0 | 132 | 0 |
| C | 0 | 132 | 0 |
| D | 0 | 132 | 0 |
| Mode M9 | |||
|---|---|---|---|
| Quadrant | BADHDUFLAG | Total packets | Discarded packets |
| A | 0 | 11 | 0 |
| B | 0 | 11 | 0 |
| C | 0 | 11 | 0 |
| D | 0 | 11 | 0 |
| Mode M0 | |||
|---|---|---|---|
| Quadrant | BADHDUFLAG | Total packets | Discarded packets |
| A | 0 | 13381 | 1 |
| B | 0 | 20374 | 1 |
| C | 0 | 19068 | 1 |
| D | 0 | 16781 | 1 |
| Quadrant | Total seconds | Saturated seconds | Saturation percentage |
|---|---|---|---|
| A | 6526 | 89 | 1.363776% |
| B | 6526 | 1002 | 15.353969% |
| C | 6527 | 418 | 6.404167% |
| D | 6527 | 202 | 3.094837% |
Noise dominated data is calculated using 1-second bins in cleaned event files. If a bin has >2000 counts, and if more than 50% of those come from <1% of pixels, then it is considered to be noise-dominated and hence unusable.
| Quadrant | # 1 sec bins | Bins with >0 counts | Bins with >2000 counts | High rate bins dominated by noise | Noise dominated (total time) | Noise dominated (detector-on time) | Marked lightcurve |
|---|---|---|---|---|---|---|---|
| A | 7616 | 6526 | 4 | 4 | 0.05% | 0.06% | 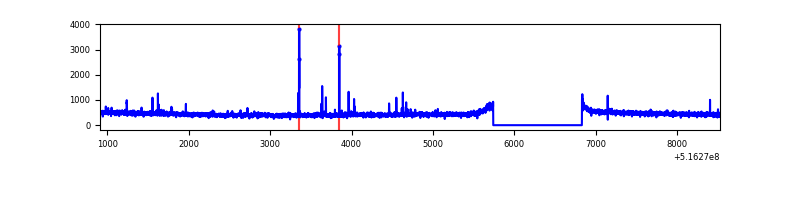 |
| B | 7616 | 6527 | 588 | 588 | 7.72% | 9.01% | 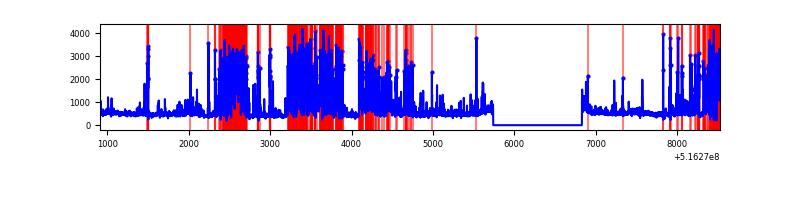 |
| C | 7617 | 6528 | 271 | 271 | 3.56% | 4.15% | 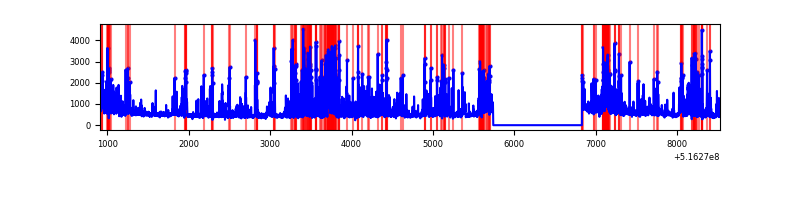 |
| D | 7617 | 6528 | 117 | 117 | 1.54% | 1.79% | 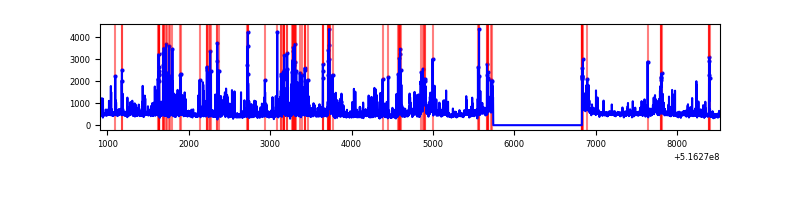 |
Top three noisy pixels from each quadrant. If the there are fewer than three noisy pixels in the level2.evt file, extra rows are filled as -1
| Pixel properties | Quadrant properties | ||||||
|---|---|---|---|---|---|---|---|
| Quadrant | DetID | PixID | Counts | Sigma | Mean | Median | Sigma |
| A | 8 | 9 | 37450 | 204.04 | 737 | 717 | 180.0 |
| A | 3 | 14 | 16970 | 90.28 | 737 | 717 | 180.0 |
| A | 4 | 3 | 11090 | 57.62 | 737 | 717 | 180.0 |
| B | 4 | 206 | 2413593 | 16646.17 | 677 | 652 | 145.0 |
| B | 10 | 247 | 64793 | 442.49 | 677 | 652 | 145.0 |
| B | 0 | 63 | 51069 | 347.81 | 677 | 652 | 145.0 |
| C | 15 | 224 | 1613440 | 8588.37 | 693 | 687 | 187.8 |
| C | 1 | 16 | 244427 | 1297.98 | 693 | 687 | 187.8 |
| C | 14 | 254 | 151266 | 801.88 | 693 | 687 | 187.8 |
| D | 7 | 96 | 473374 | 2347.37 | 709 | 678 | 201.4 |
| D | 15 | 142 | 291270 | 1443.06 | 709 | 678 | 201.4 |
| D | 3 | 12 | 105117 | 518.64 | 709 | 678 | 201.4 |
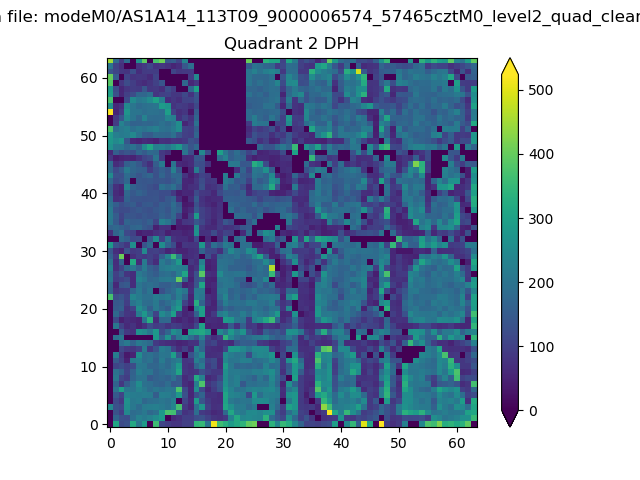
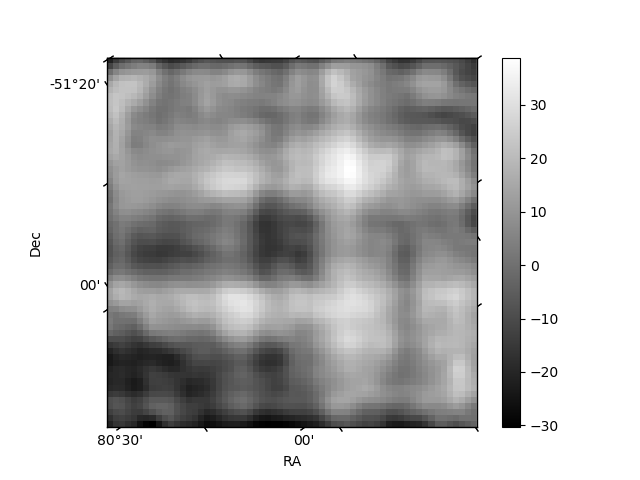
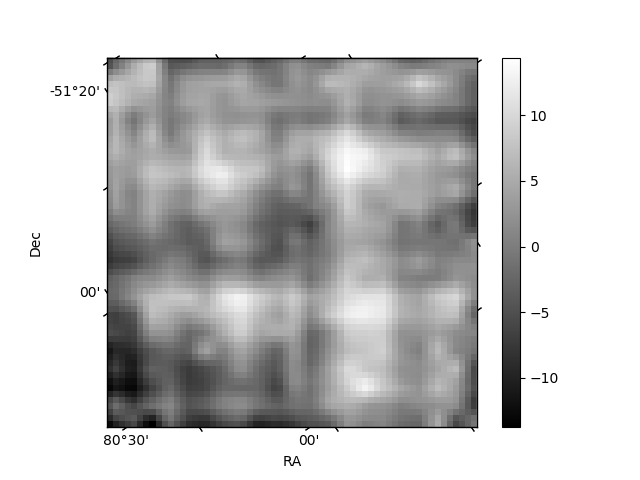
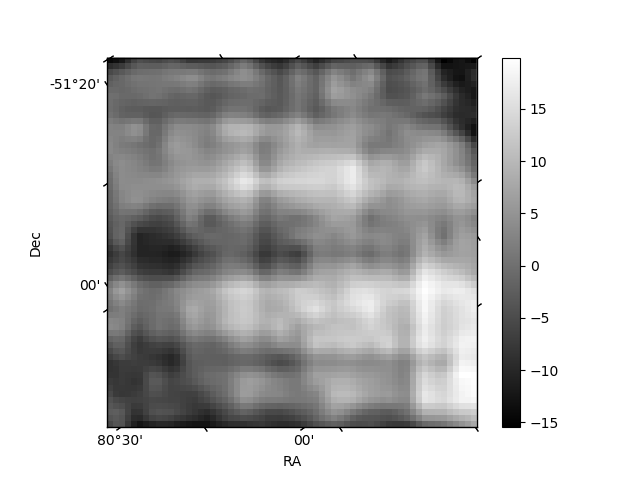
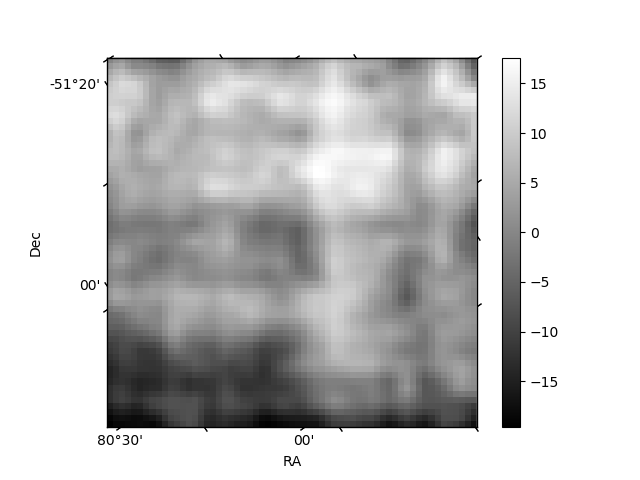
Histogram calculated using DETX and DETY for each event in the final _common_clean file
| Quadrant A | 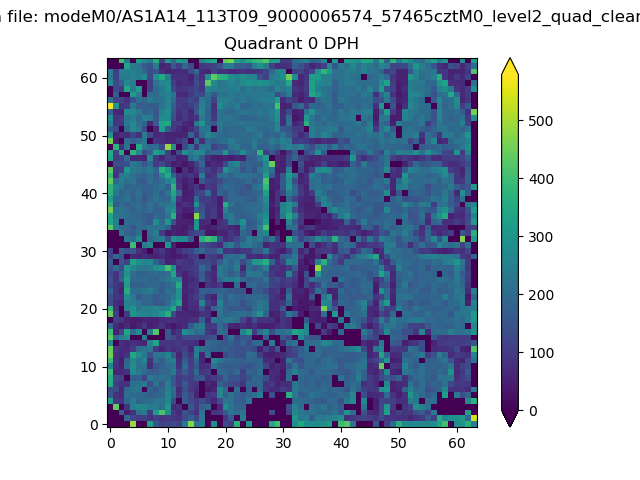 |
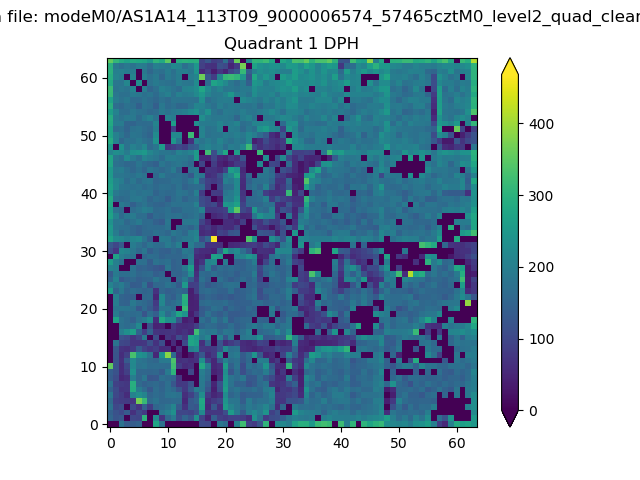 |
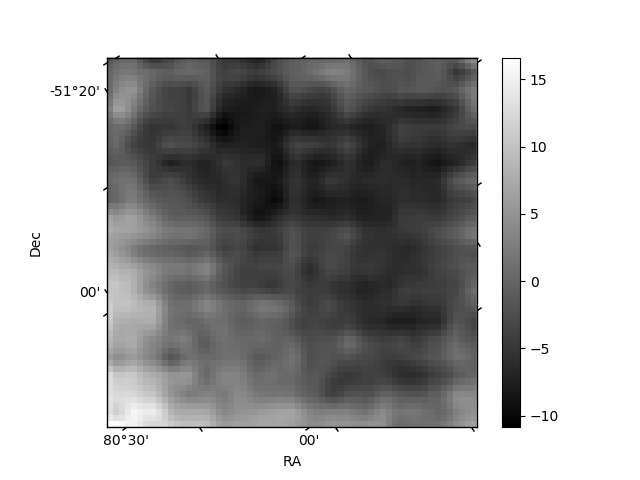
Quadrant B |
|---|---|---|---|
| Quadrant D | 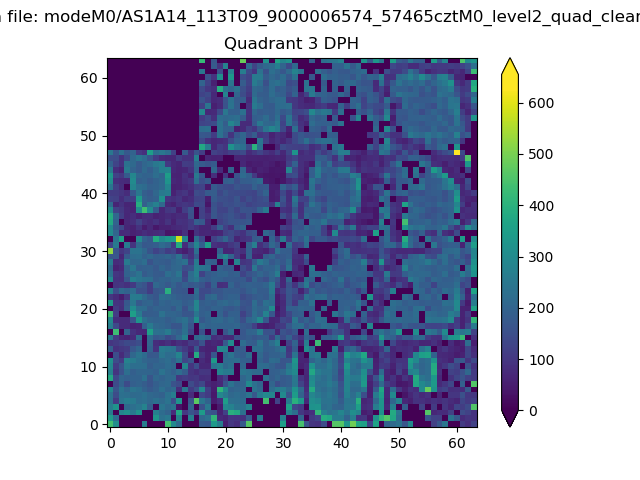 |
 |
Quadrant C |
| Plot type | Count rate plots | Images |
|---|---|---|
| Comparison with Poisson distribution Blue bars denote a histogram of data divided into 1 sec bins. Red curve is a Poisson curve with rate = median count rate of data. |
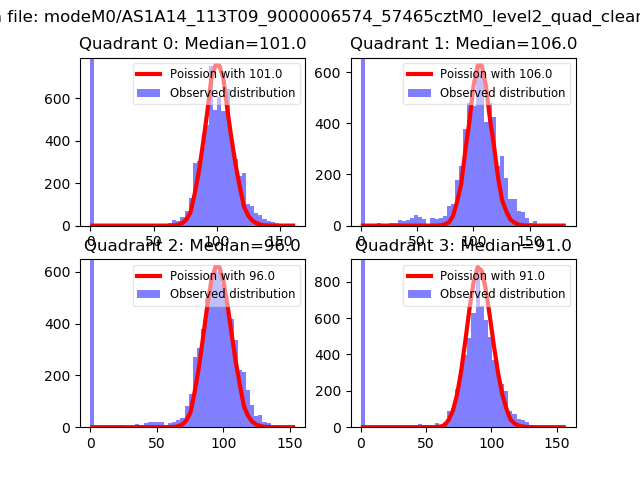 |
 |
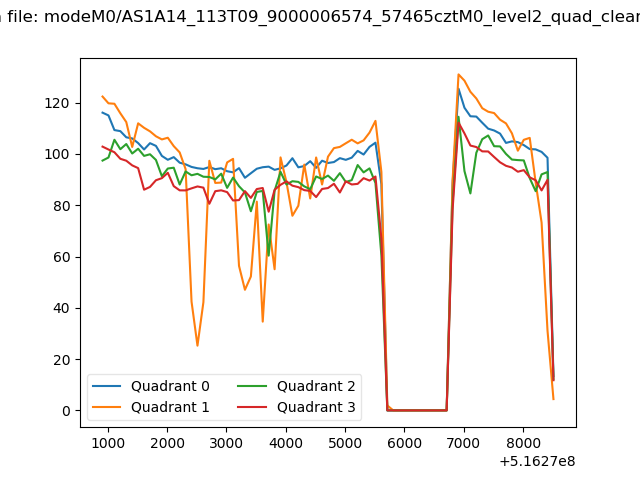
| Quadrant-wise count rates Data is divided into 100 sec bins |
 |
|
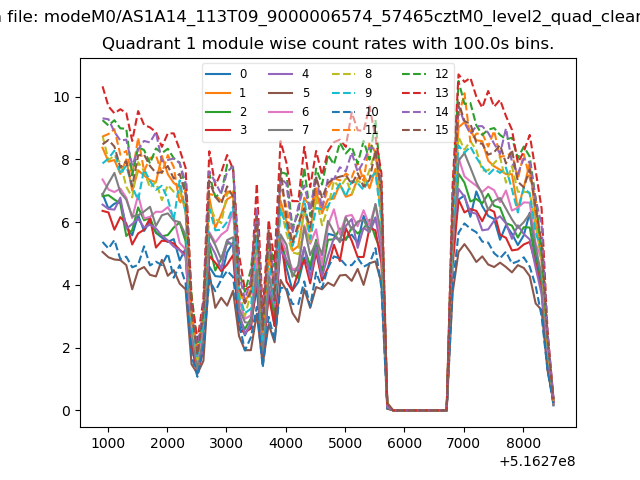
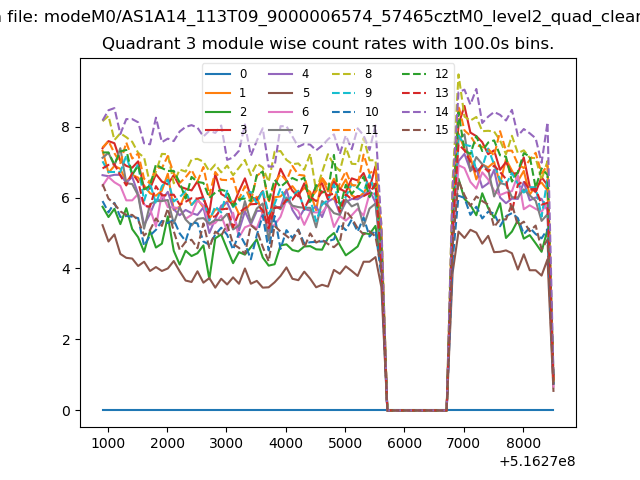
| Module-wise count rates for Quadrant A Data is divided into 100 sec bins |
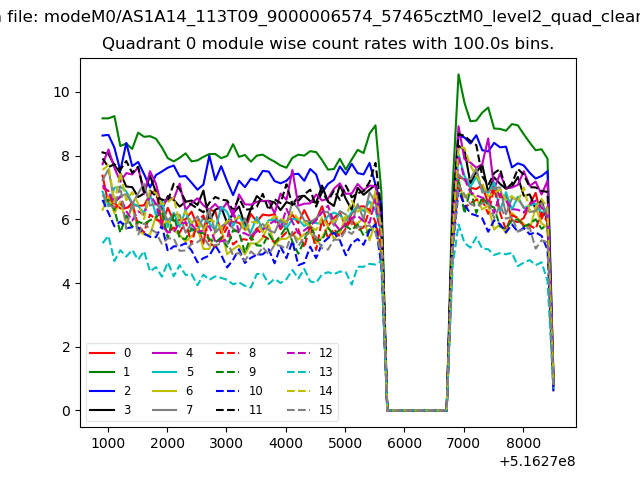 |
 |
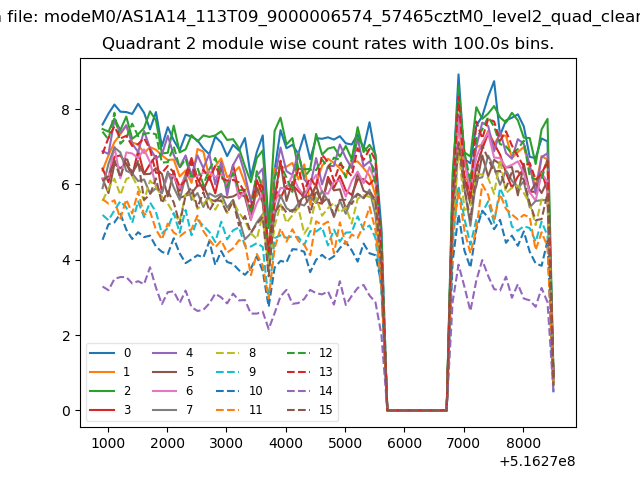
| Module-wise count rates for Quadrant B Data is divided into 100 sec bins |
 |
 |
| Module-wise count rates for Quadrant C Data is divided into 100 sec bins |
 |
 |
| Module-wise count rates for Quadrant D Data is divided into 100 sec bins |
 |
 |
| Parameter | Plot |
|---|---|
| CZT HV Monitor | 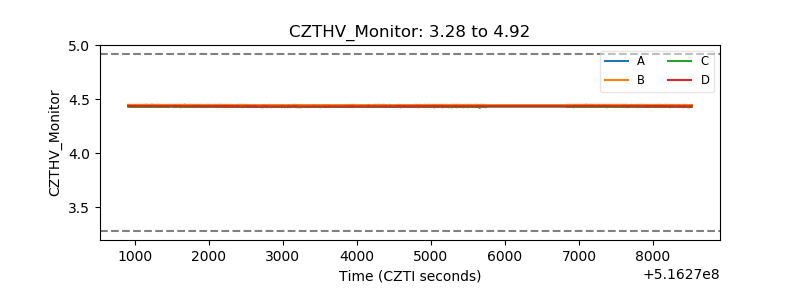 |
| D_VDD | 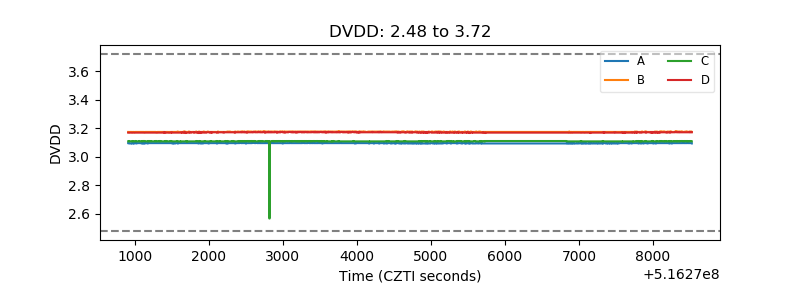 |
| Temperature 1 | 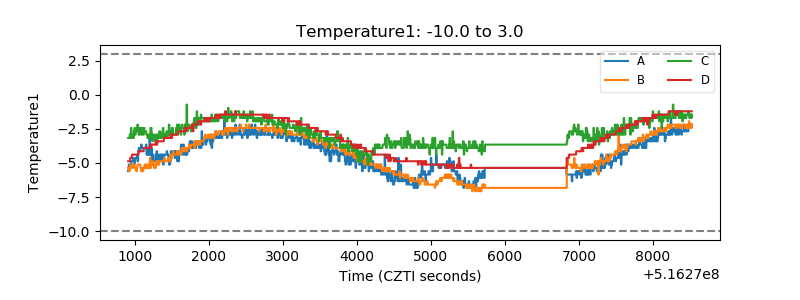 |
| Veto HV Monitor | 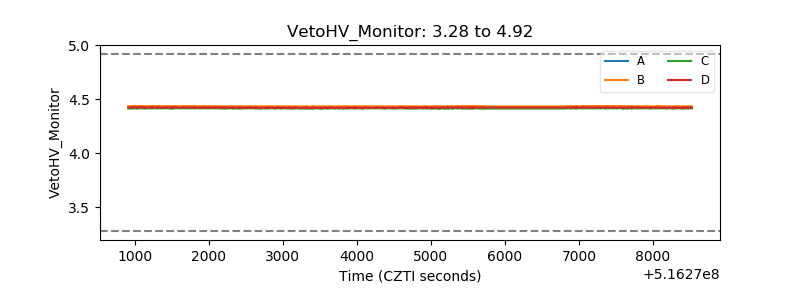 |
| Veto LLD | 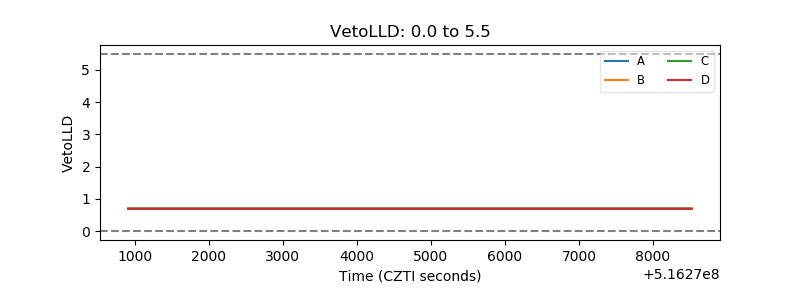 |
| Alpha Counter | 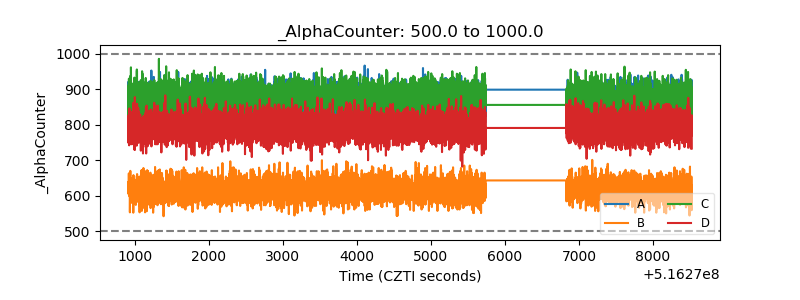 |
| _CPM_Rate | 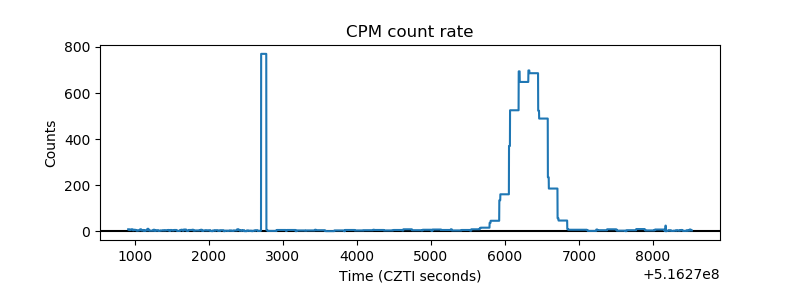 |
| CZT Counter | 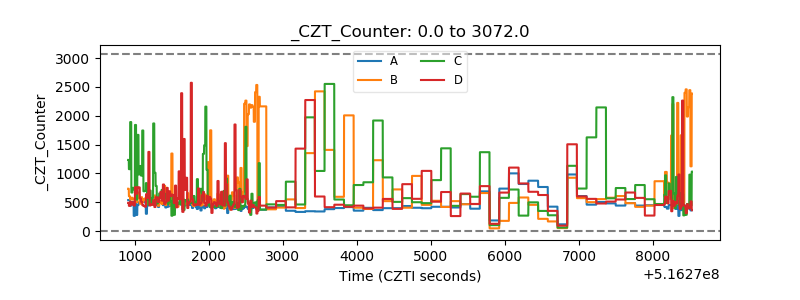 |
| +2.5 Volts monitor |  |
| +5 Volts monitor | 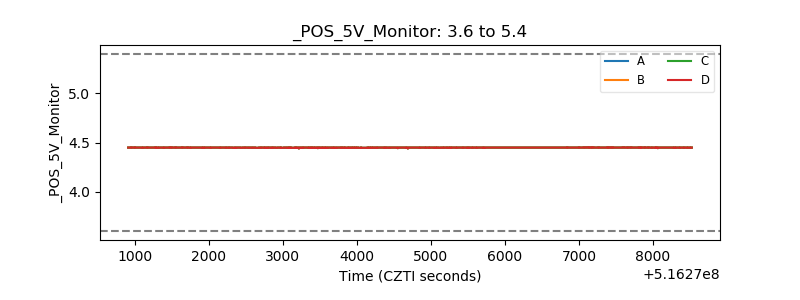 |
| _ROLL_ROT | 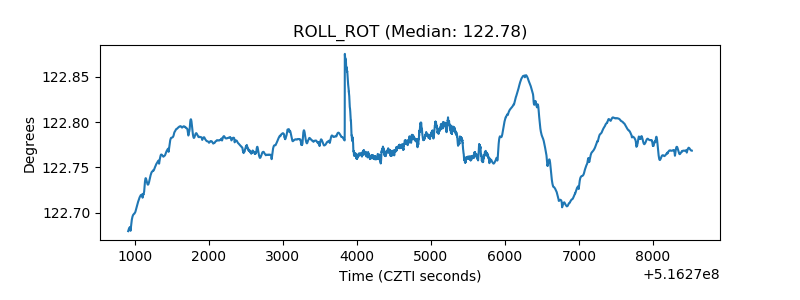 |
| _Roll_DEC | 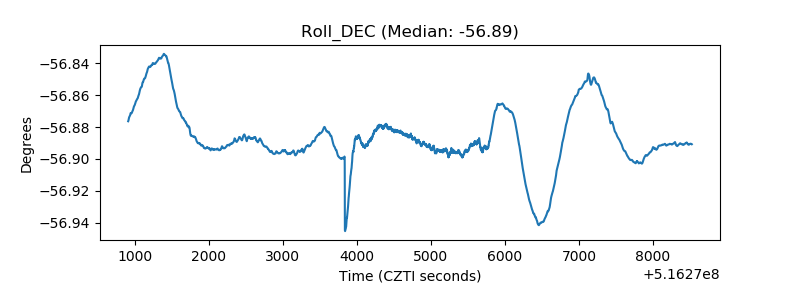 |
| _Roll_RA | 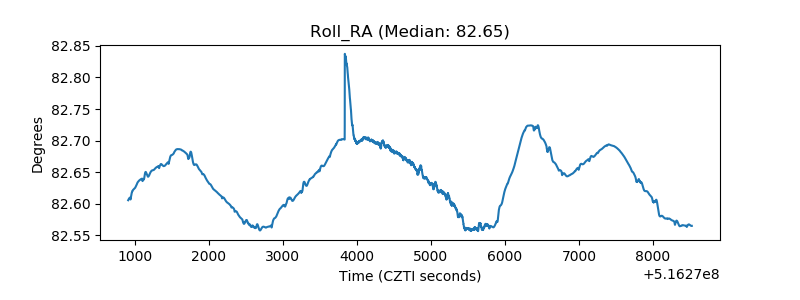 |
| Veto Counter | 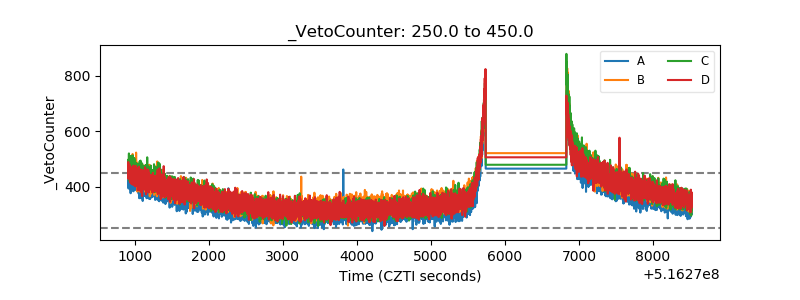 |