| Param | Original file | Final file |
|---|---|---|
| Filename | modeM0/AS1A14_113T09_9000006574_57469cztM0_level2.fits | modeM0/AS1A14_113T09_9000006574_57469cztM0_level2_quad_clean.evt |
| Size (bytes) | 611,625,600 | 87,552,000 |
| Size | 583.3 MB | 83.5 MB |
| Events in quadrant A | 2,799,668 | 633,810 |
| Events in quadrant B | 7,697,932 | 491,136 |
| Events in quadrant C | 6,897,498 | 516,681 |
| Events in quadrant D | 4,731,432 | 548,263 |
| Mode SS | |||
|---|---|---|---|
| Quadrant | BADHDUFLAG | Total packets | Discarded packets |
| A | 0 | 132 | 0 |
| B | 0 | 132 | 0 |
| C | 0 | 132 | 0 |
| D | 0 | 132 | 0 |
| Mode M9 | |||
|---|---|---|---|
| Quadrant | BADHDUFLAG | Total packets | Discarded packets |
| A | 0 | 7 | 0 |
| B | 0 | 7 | 0 |
| C | 0 | 7 | 0 |
| D | 0 | 7 | 0 |
| Mode M0 | |||
|---|---|---|---|
| Quadrant | BADHDUFLAG | Total packets | Discarded packets |
| A | 0 | 13387 | 1 |
| B | 0 | 27524 | 1 |
| C | 0 | 25186 | 1 |
| D | 0 | 18556 | 1 |
| Quadrant | Total seconds | Saturated seconds | Saturation percentage |
|---|---|---|---|
| A | 6615 | 15 | 0.226757% |
| B | 6616 | 1998 | 30.199516% |
| C | 6616 | 1138 | 17.200726% |
| D | 6616 | 355 | 5.365780% |
Noise dominated data is calculated using 1-second bins in cleaned event files. If a bin has >2000 counts, and if more than 50% of those come from <1% of pixels, then it is considered to be noise-dominated and hence unusable.
| Quadrant | # 1 sec bins | Bins with >0 counts | Bins with >2000 counts | High rate bins dominated by noise | Noise dominated (total time) | Noise dominated (detector-on time) | Marked lightcurve |
|---|---|---|---|---|---|---|---|
| A | 7250 | 6616 | 0 | 0 | 0.00% | 0.00% | 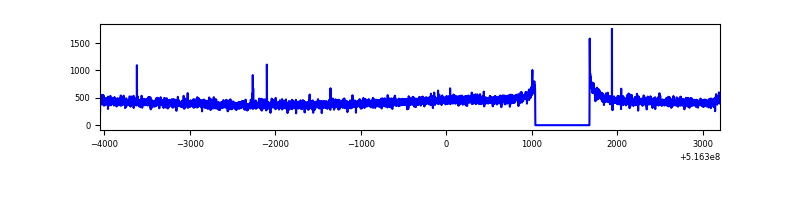 |
| B | 7251 | 6617 | 1449 | 1449 | 19.98% | 21.90% | 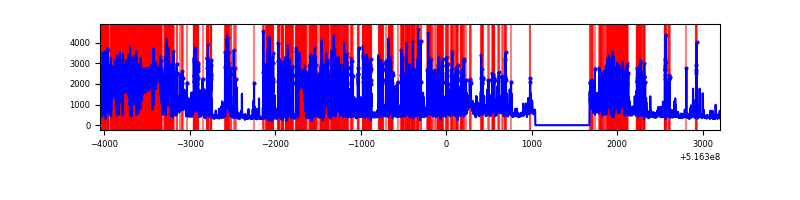 |
| C | 7251 | 6617 | 834 | 834 | 11.50% | 12.60% | 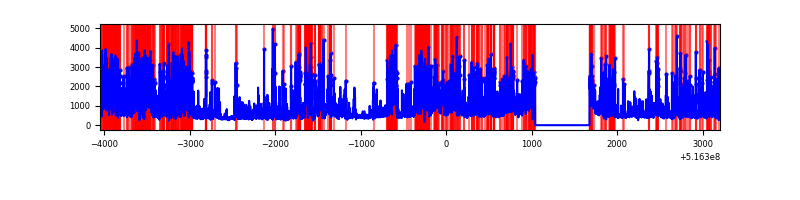 |
| D | 7251 | 6617 | 320 | 320 | 4.41% | 4.84% | 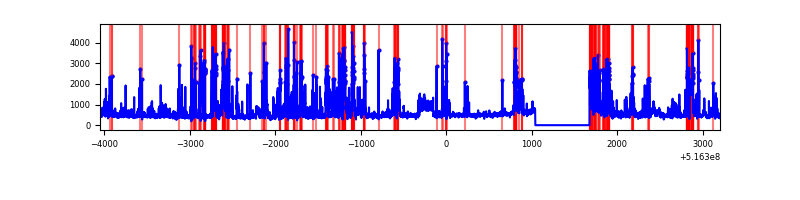 |
Top three noisy pixels from each quadrant. If the there are fewer than three noisy pixels in the level2.evt file, extra rows are filled as -1
| Pixel properties | Quadrant properties | ||||||
|---|---|---|---|---|---|---|---|
| Quadrant | DetID | PixID | Counts | Sigma | Mean | Median | Sigma |
| A | 4 | 3 | 18172 | 99.45 | 709 | 691 | 175.8 |
| A | 3 | 14 | 15137 | 82.19 | 709 | 691 | 175.8 |
| A | 0 | 12 | 11326 | 60.51 | 709 | 691 | 175.8 |
| B | 4 | 206 | 5015083 | 39555.19 | 586 | 562 | 126.8 |
| B | 10 | 247 | 96736 | 758.63 | 586 | 562 | 126.8 |
| B | 0 | 245 | 52711 | 411.36 | 586 | 562 | 126.8 |
| C | 12 | 254 | 2403464 | 13903.09 | 629 | 622 | 172.8 |
| C | 15 | 224 | 1608051 | 9300.75 | 629 | 622 | 172.8 |
| C | 14 | 254 | 290538 | 1677.48 | 629 | 622 | 172.8 |
| D | 7 | 96 | 687611 | 3672.43 | 664 | 634 | 187.1 |
| D | 2 | 249 | 386785 | 2064.28 | 664 | 634 | 187.1 |
| D | 15 | 142 | 346452 | 1848.67 | 664 | 634 | 187.1 |
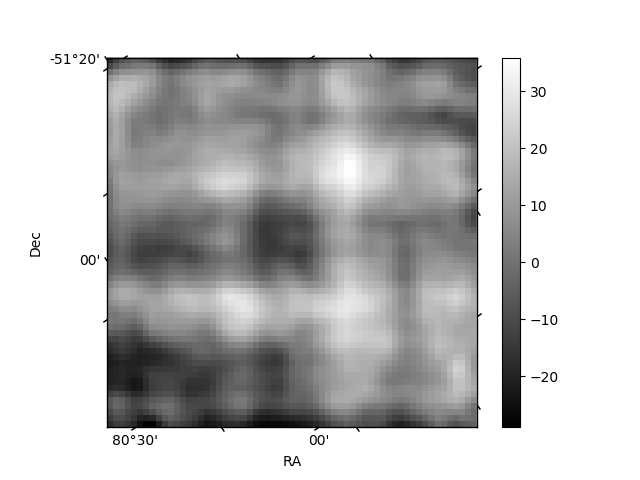
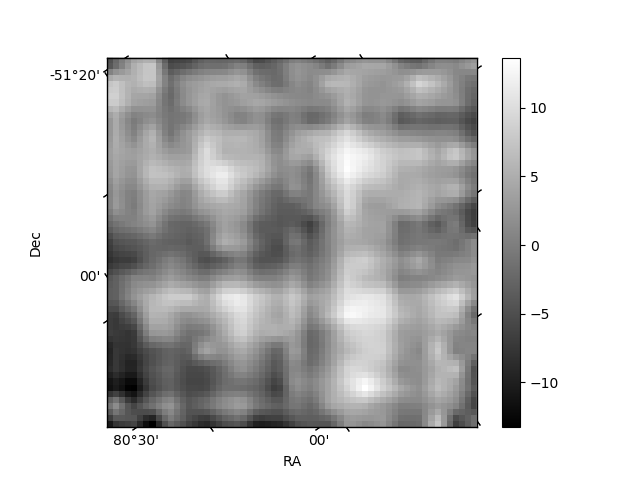
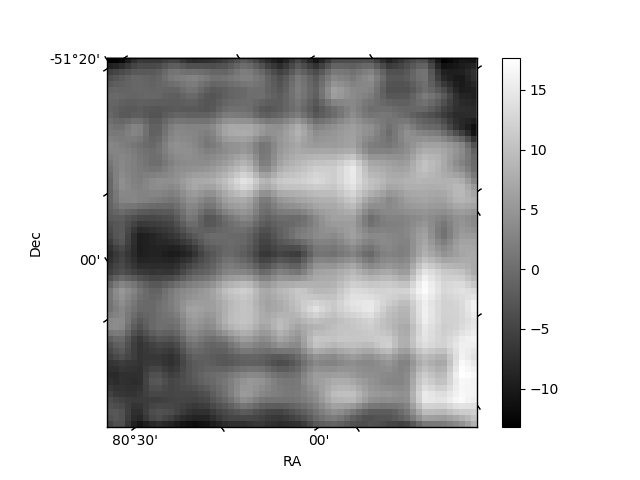
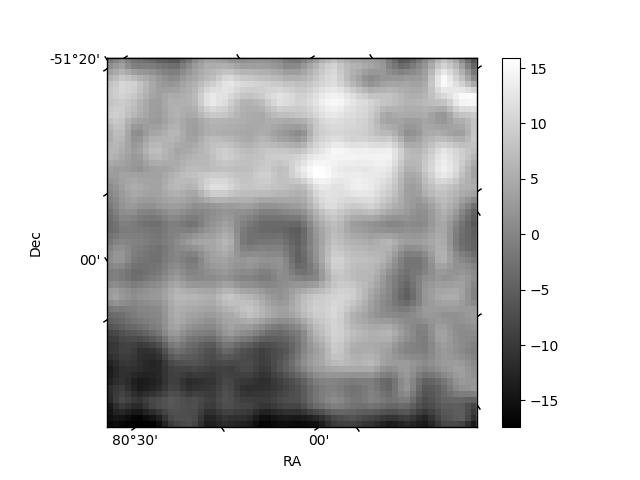
Histogram calculated using DETX and DETY for each event in the final _common_clean file
| Quadrant A | 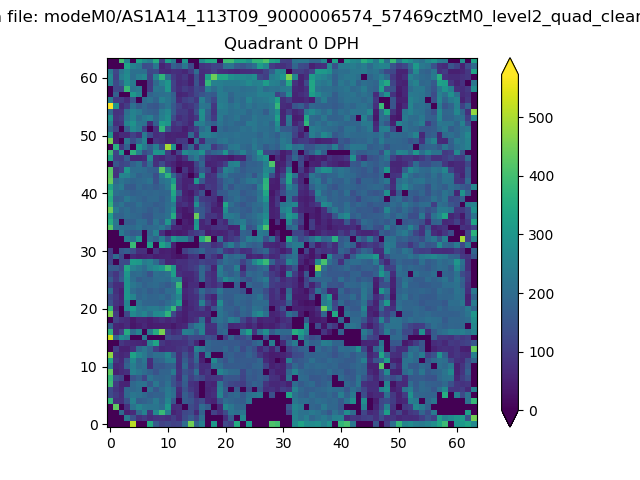 |
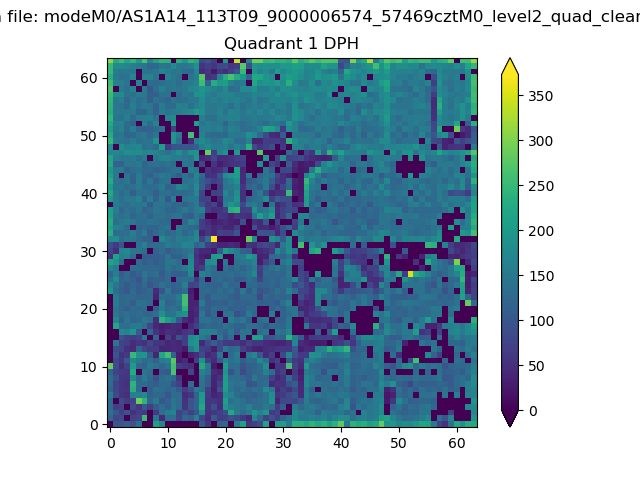 |
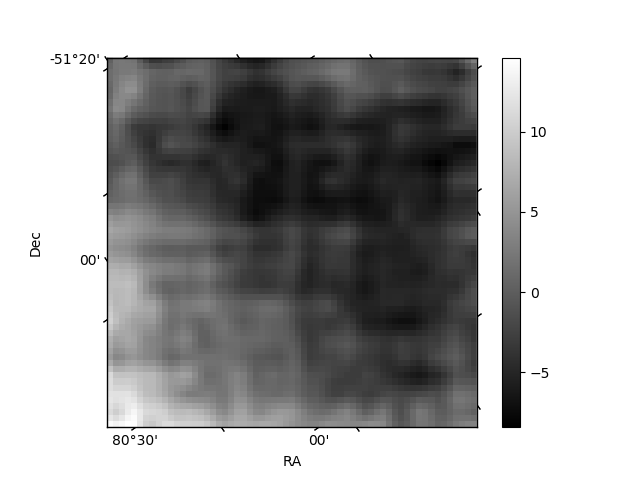
Quadrant B |
|---|---|---|---|
| Quadrant D | 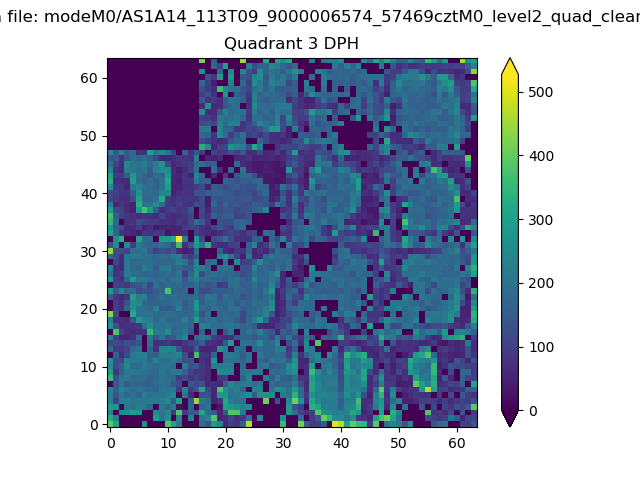 |
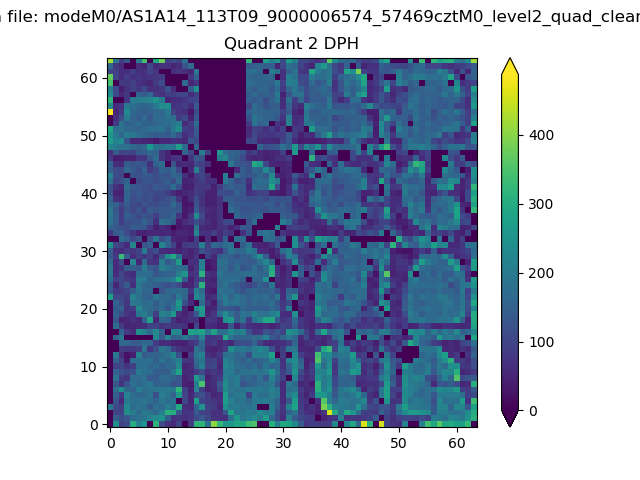 |
Quadrant C |
| Plot type | Count rate plots | Images |
|---|---|---|
| Comparison with Poisson distribution Blue bars denote a histogram of data divided into 1 sec bins. Red curve is a Poisson curve with rate = median count rate of data. |
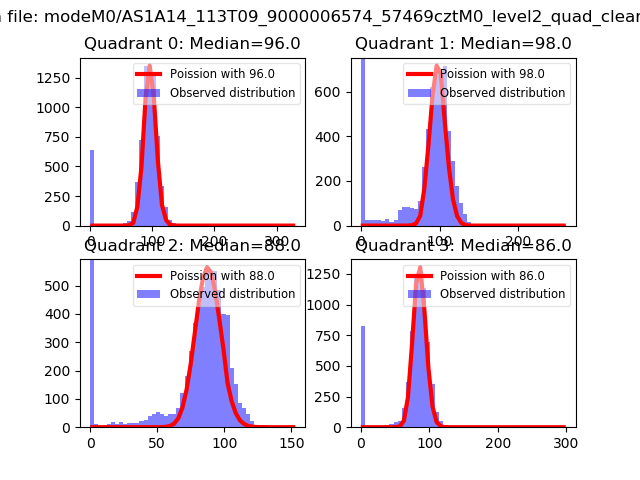 |
 |
| Quadrant-wise count rates Data is divided into 100 sec bins |
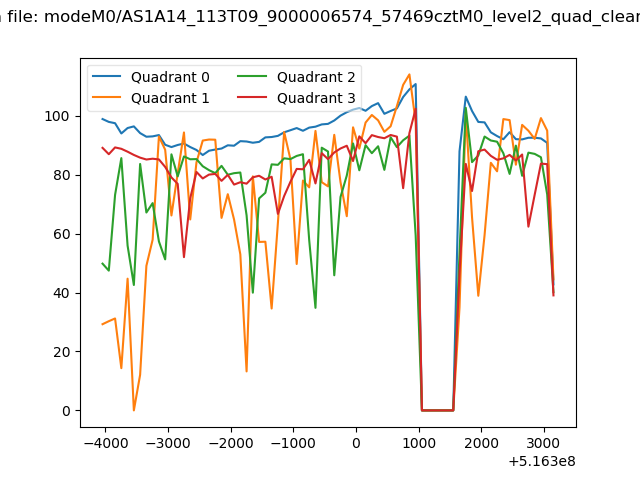 |
|
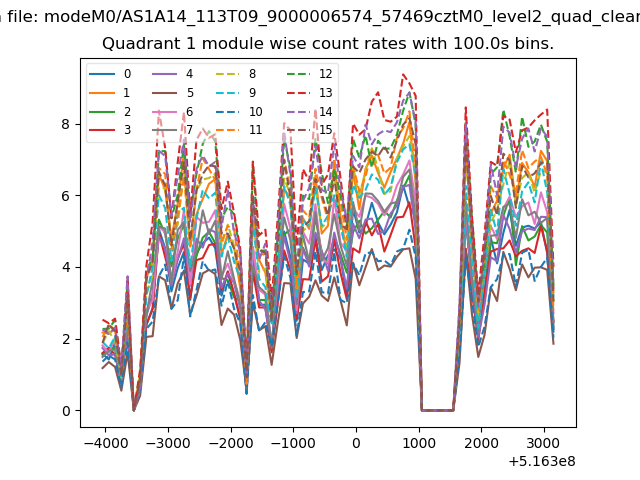
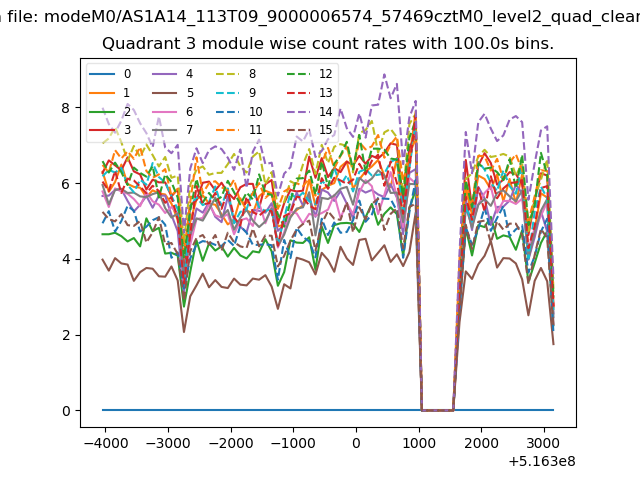
| Module-wise count rates for Quadrant A Data is divided into 100 sec bins |
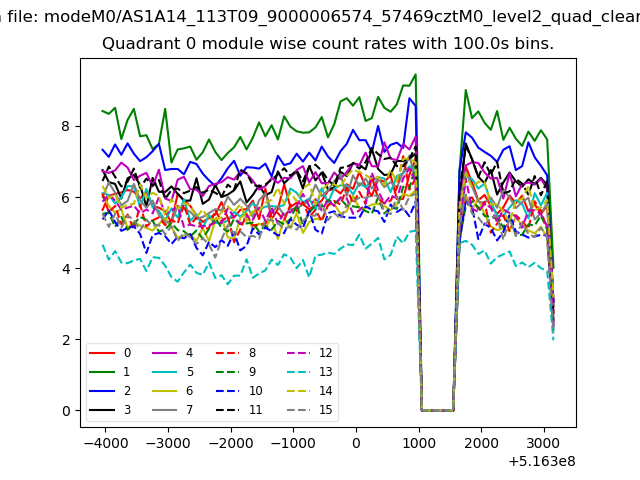 |
 |
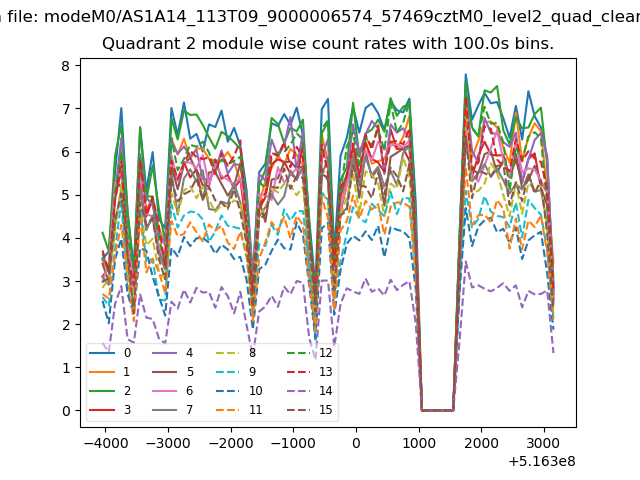
| Module-wise count rates for Quadrant B Data is divided into 100 sec bins |
 |
 |
| Module-wise count rates for Quadrant C Data is divided into 100 sec bins |
 |
 |
| Module-wise count rates for Quadrant D Data is divided into 100 sec bins |
 |
 |
| Parameter | Plot |
|---|---|
| CZT HV Monitor | 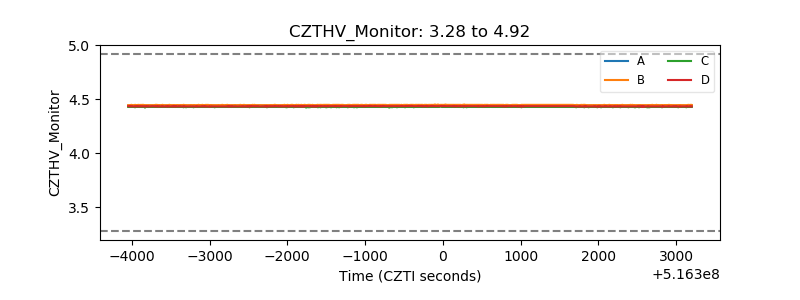 |
| D_VDD | 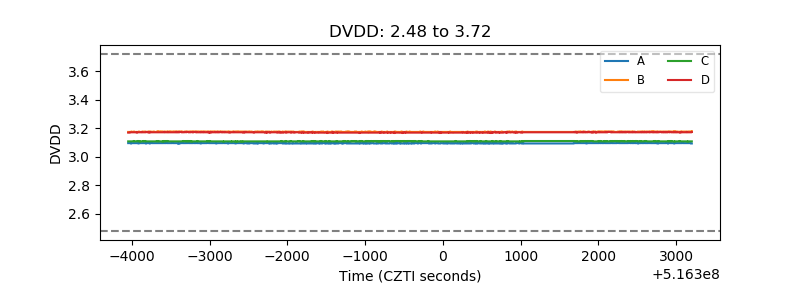 |
| Temperature 1 | 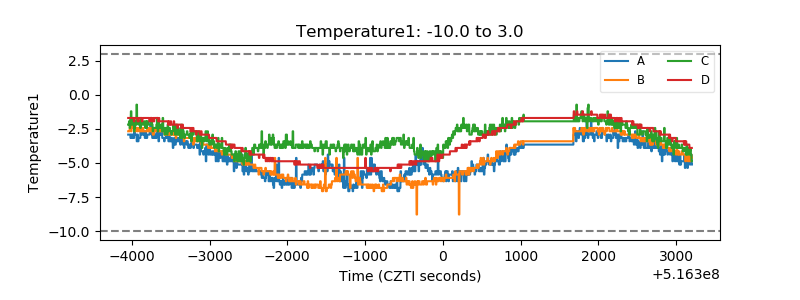 |
| Veto HV Monitor |  |
| Veto LLD | 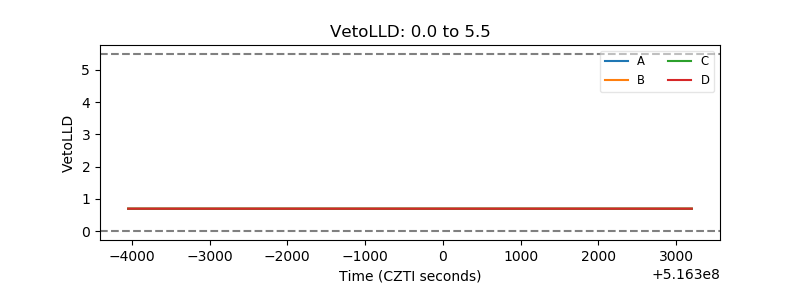 |
| Alpha Counter | 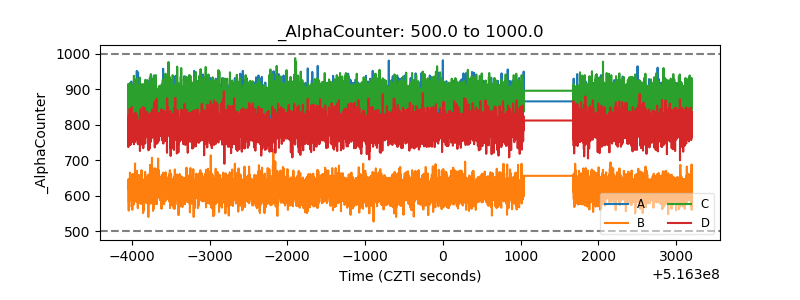 |
| _CPM_Rate | 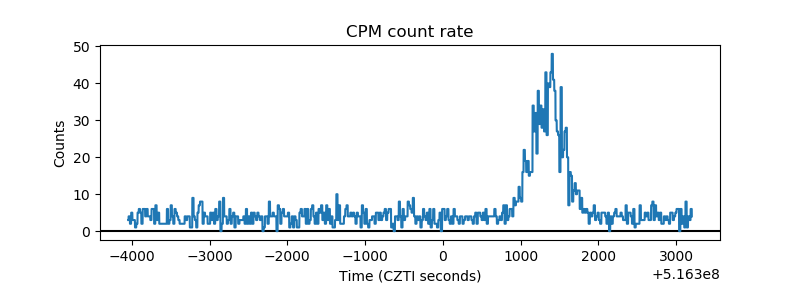 |
| CZT Counter | 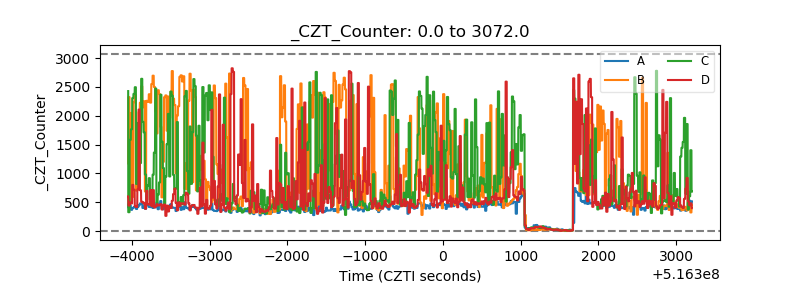 |
| +2.5 Volts monitor |  |
| +5 Volts monitor | 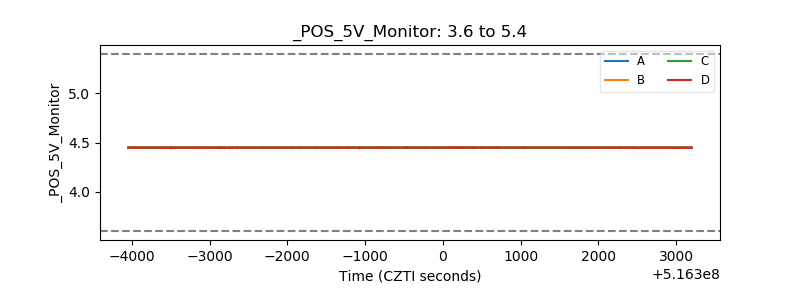 |
| _ROLL_ROT | 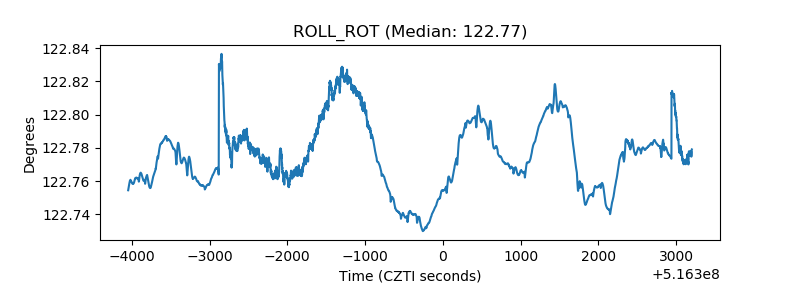 |
| _Roll_DEC | 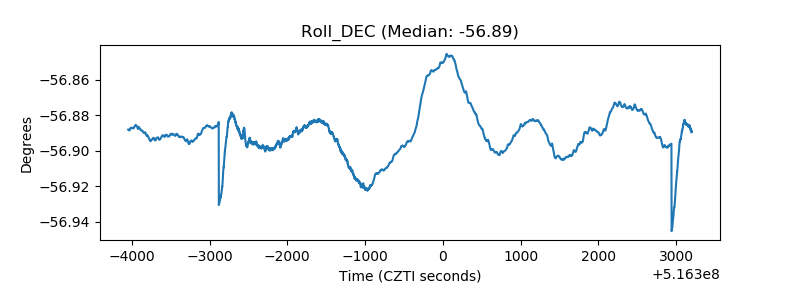 |
| _Roll_RA | 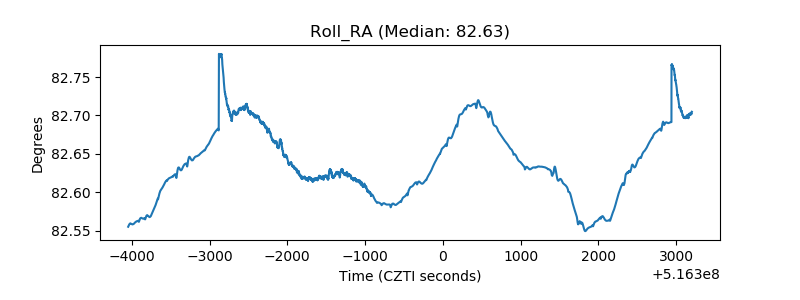 |
| Veto Counter | 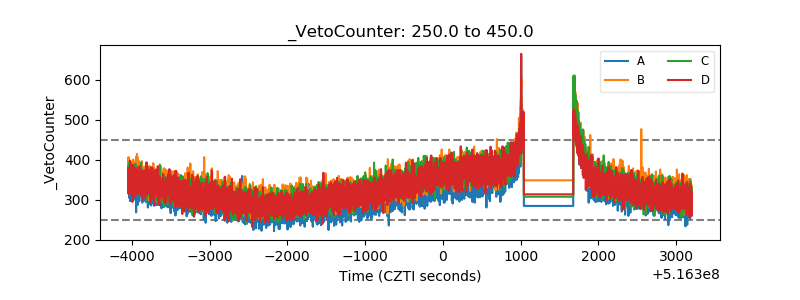 |