| Param | Original file | Final file |
|---|---|---|
| Filename | modeM0/AS1A14_113T09_9000006574_57470cztM0_level2.fits | modeM0/AS1A14_113T09_9000006574_57470cztM0_level2_quad_clean.evt |
| Size (bytes) | 557,614,080 | 98,637,120 |
| Size | 531.8 MB | 94.1 MB |
| Events in quadrant A | 3,473,213 | 661,058 |
| Events in quadrant B | 5,335,937 | 669,705 |
| Events in quadrant C | 6,943,595 | 536,020 |
| Events in quadrant D | 4,287,861 | 581,818 |
| Mode SS | |||
|---|---|---|---|
| Quadrant | BADHDUFLAG | Total packets | Discarded packets |
| A | 0 | 154 | 0 |
| B | 0 | 154 | 0 |
| C | 0 | 154 | 0 |
| D | 0 | 154 | 0 |
| Mode M0 | |||
|---|---|---|---|
| Quadrant | BADHDUFLAG | Total packets | Discarded packets |
| A | 0 | 16149 | 2 |
| B | 0 | 21323 | 4 |
| C | 0 | 25969 | 2 |
| D | 0 | 18220 | 2 |
| Quadrant | Total seconds | Saturated seconds | Saturation percentage |
|---|---|---|---|
| A | 7732 | 81 | 1.047594% |
| B | 7732 | 745 | 9.635282% |
| C | 7732 | 748 | 9.674082% |
| D | 7732 | 170 | 2.198655% |
Noise dominated data is calculated using 1-second bins in cleaned event files. If a bin has >2000 counts, and if more than 50% of those come from <1% of pixels, then it is considered to be noise-dominated and hence unusable.
| Quadrant | # 1 sec bins | Bins with >0 counts | Bins with >2000 counts | High rate bins dominated by noise | Noise dominated (total time) | Noise dominated (detector-on time) | Marked lightcurve |
|---|---|---|---|---|---|---|---|
| A | 8021 | 8007 | 3 | 3 | 0.04% | 0.04% | 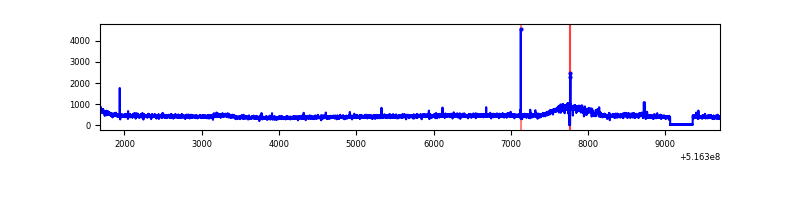 |
| B | 8021 | 8006 | 323 | 323 | 4.03% | 4.03% | 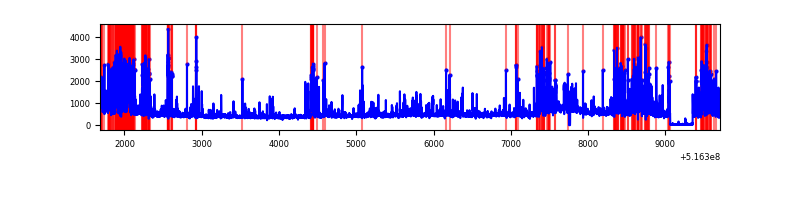 |
| C | 8021 | 7947 | 591 | 591 | 7.37% | 7.44% | 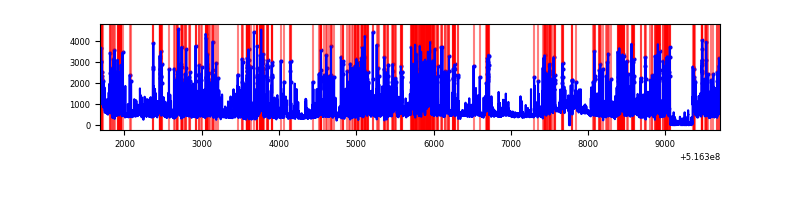 |
| D | 8021 | 8007 | 121 | 121 | 1.51% | 1.51% | 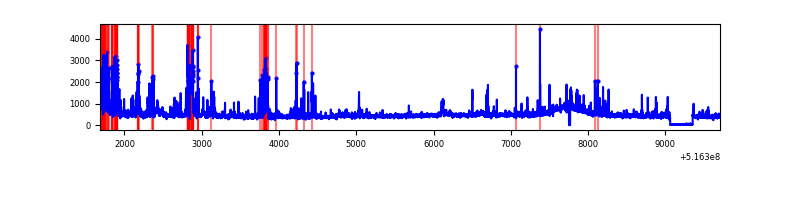 |
Top three noisy pixels from each quadrant. If the there are fewer than three noisy pixels in the level2.evt file, extra rows are filled as -1
| Pixel properties | Quadrant properties | ||||||
|---|---|---|---|---|---|---|---|
| Quadrant | DetID | PixID | Counts | Sigma | Mean | Median | Sigma |
| A | 0 | 12 | 77156 | 363.13 | 859 | 837 | 210.2 |
| A | 13 | 153 | 28599 | 132.09 | 859 | 837 | 210.2 |
| A | 3 | 14 | 17192 | 77.82 | 859 | 837 | 210.2 |
| B | 4 | 206 | 1464002 | 8347.06 | 814 | 779 | 175.3 |
| B | 0 | 63 | 101885 | 576.76 | 814 | 779 | 175.3 |
| B | 5 | 172 | 99255 | 561.76 | 814 | 779 | 175.3 |
| C | 15 | 224 | 1737553 | 8074.01 | 794 | 785 | 215.1 |
| C | 12 | 254 | 1468149 | 6821.59 | 794 | 785 | 215.1 |
| C | 14 | 254 | 400937 | 1860.25 | 794 | 785 | 215.1 |
| D | 7 | 96 | 277755 | 1210.9 | 821 | 784 | 228.7 |
| D | 8 | 240 | 203538 | 886.43 | 821 | 784 | 228.7 |
| D | 15 | 142 | 125367 | 544.67 | 821 | 784 | 228.7 |
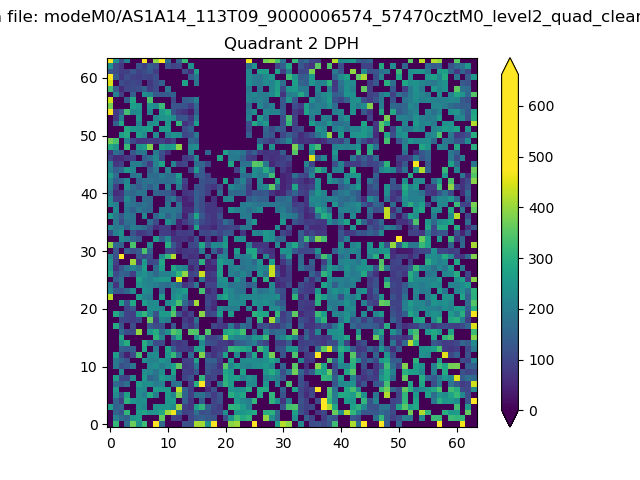
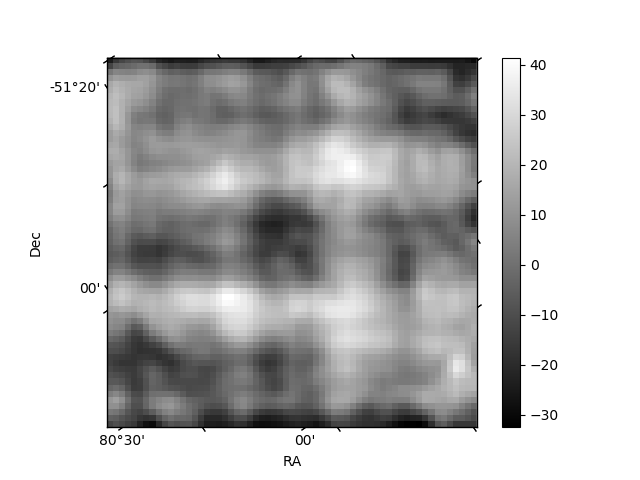
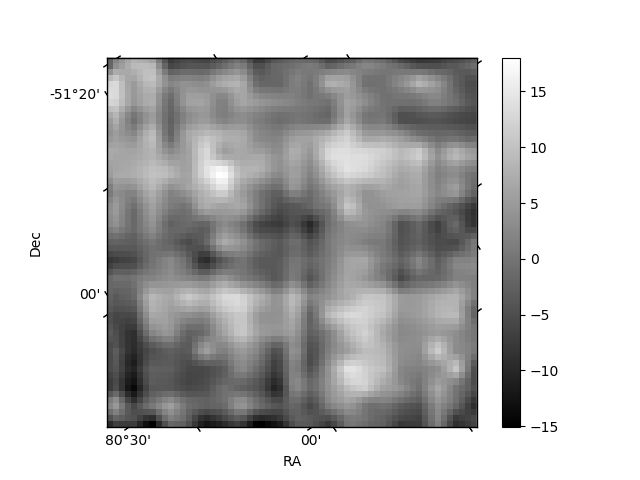
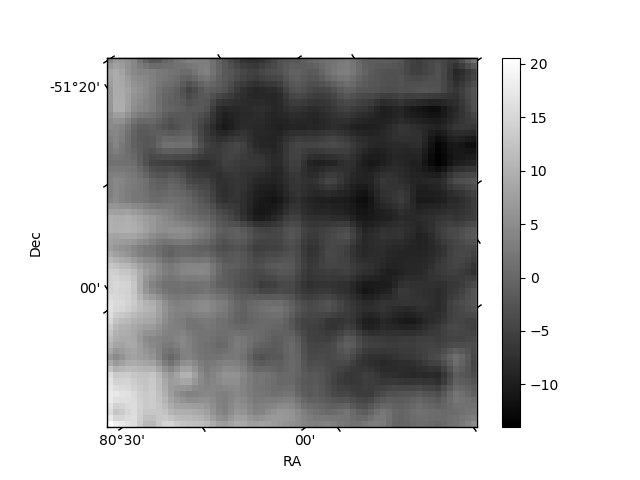
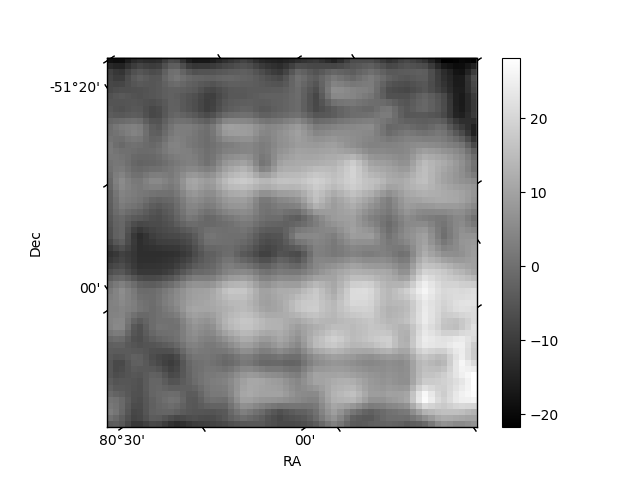
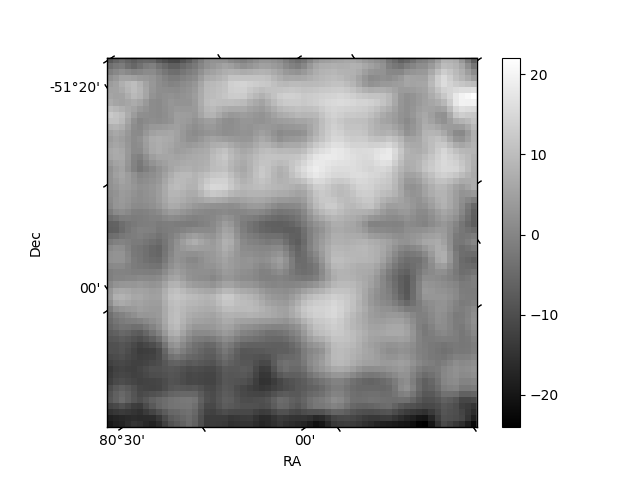
Histogram calculated using DETX and DETY for each event in the final _common_clean file
| Quadrant A | 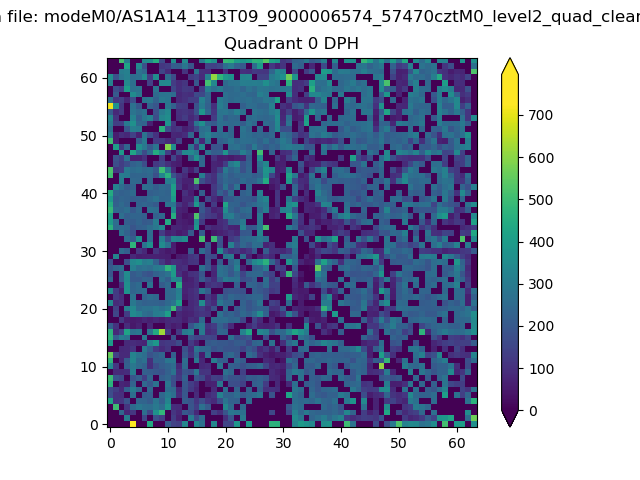 |
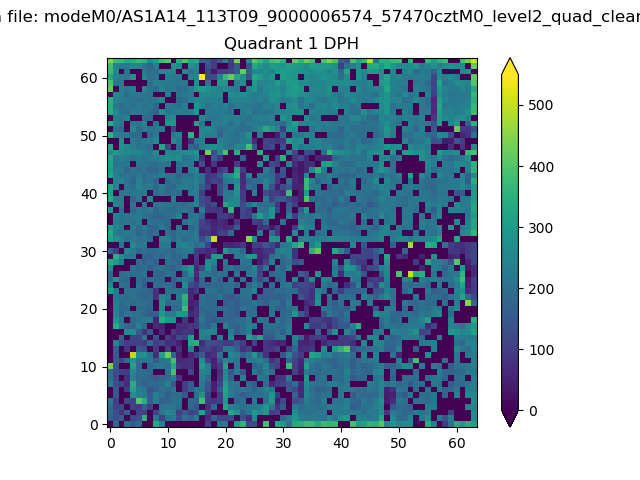 |
Quadrant B |
|---|---|---|---|
| Quadrant D | 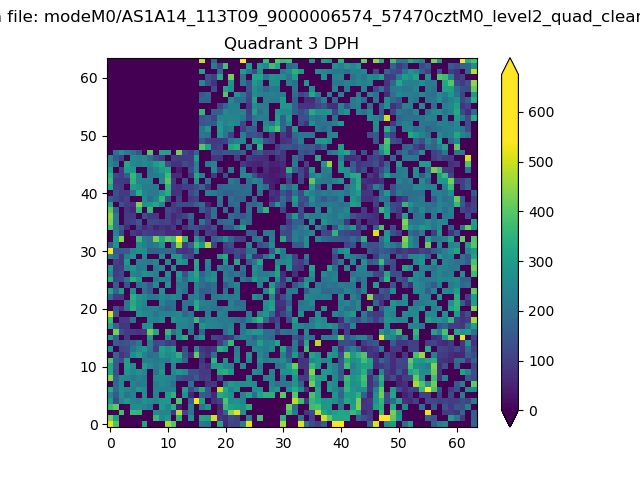 |
 |
Quadrant C |
| Plot type | Count rate plots | Images |
|---|---|---|
| Comparison with Poisson distribution Blue bars denote a histogram of data divided into 1 sec bins. Red curve is a Poisson curve with rate = median count rate of data. |
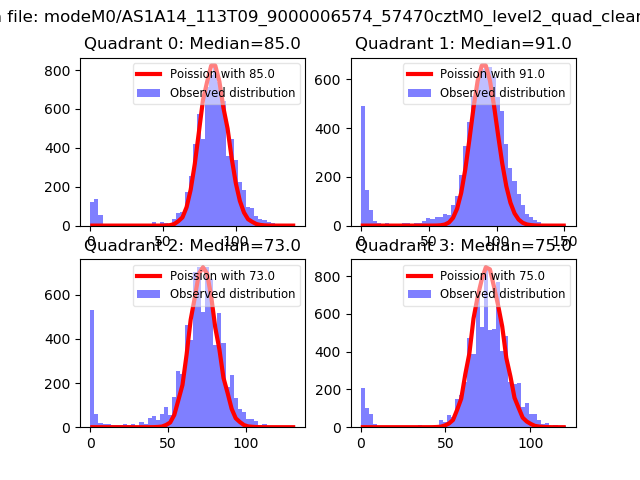 |
 |
| Quadrant-wise count rates Data is divided into 100 sec bins |
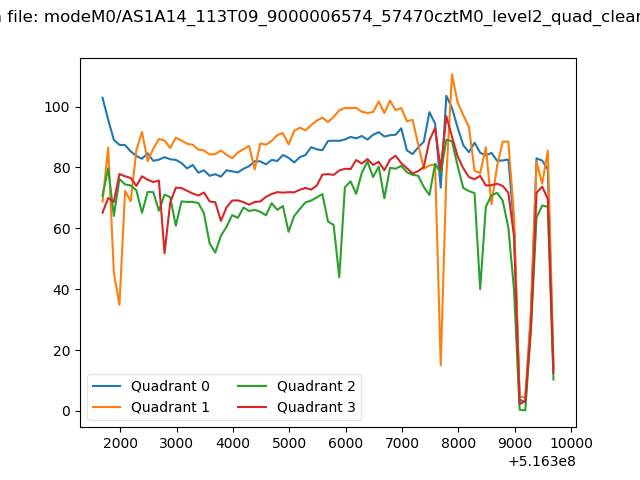 |
|
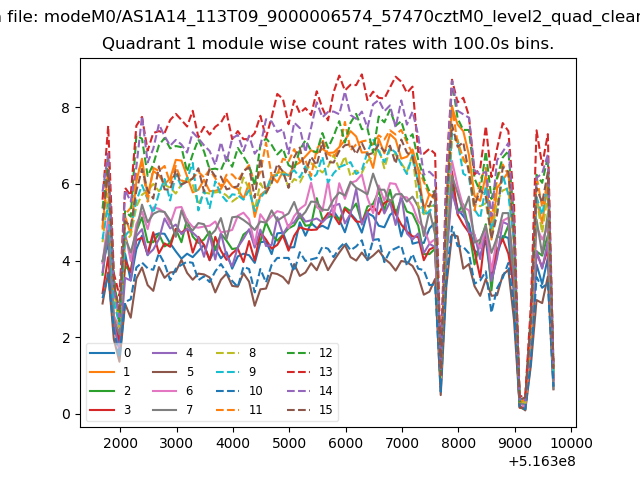
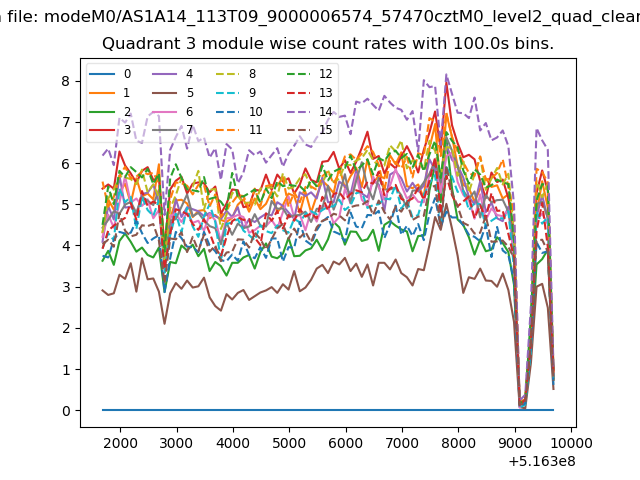
| Module-wise count rates for Quadrant A Data is divided into 100 sec bins |
 |
 |
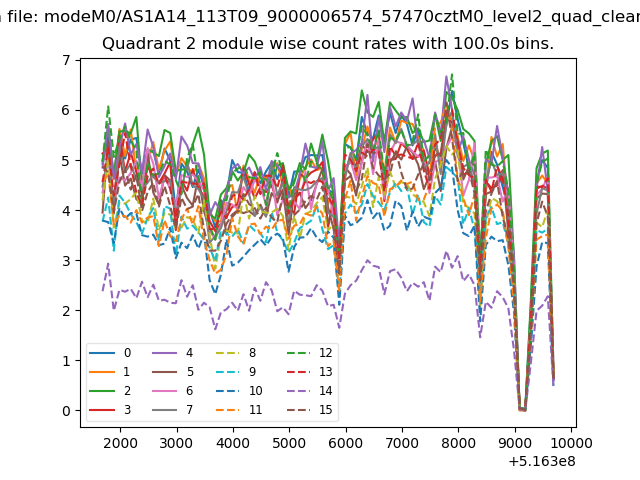
| Module-wise count rates for Quadrant B Data is divided into 100 sec bins |
 |
 |
| Module-wise count rates for Quadrant C Data is divided into 100 sec bins |
 |
 |
| Module-wise count rates for Quadrant D Data is divided into 100 sec bins |
 |
 |
| Parameter | Plot |
|---|---|
| CZT HV Monitor | 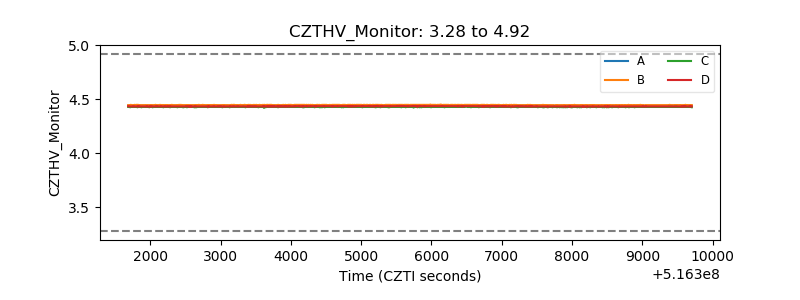 |
| D_VDD | 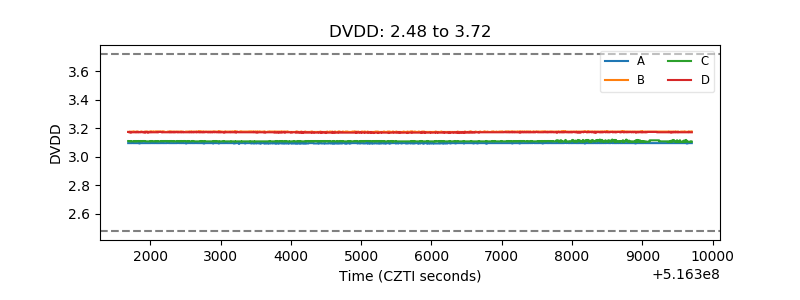 |
| Temperature 1 | 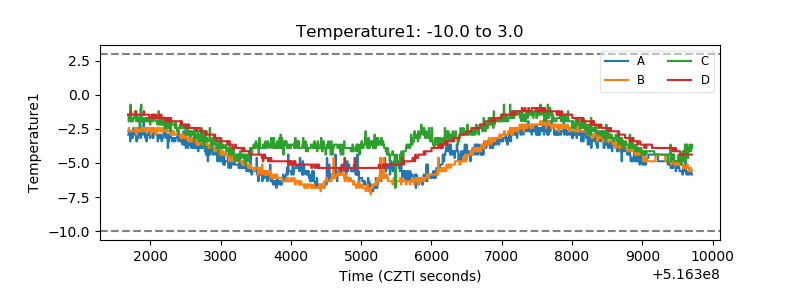 |
| Veto HV Monitor | 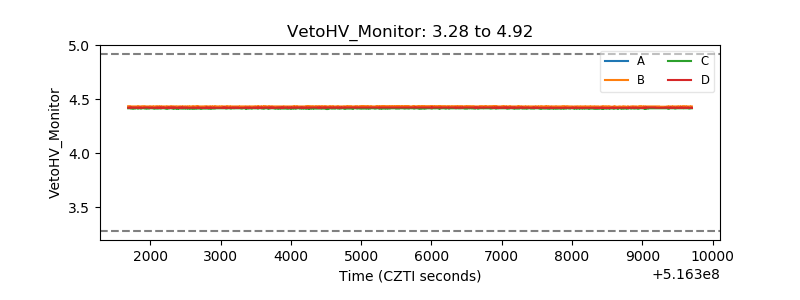 |
| Veto LLD | 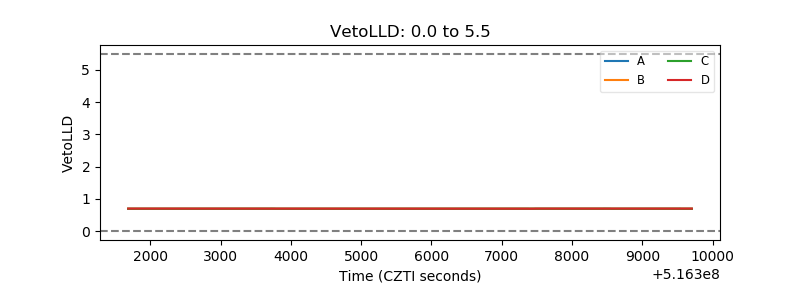 |
| Alpha Counter | 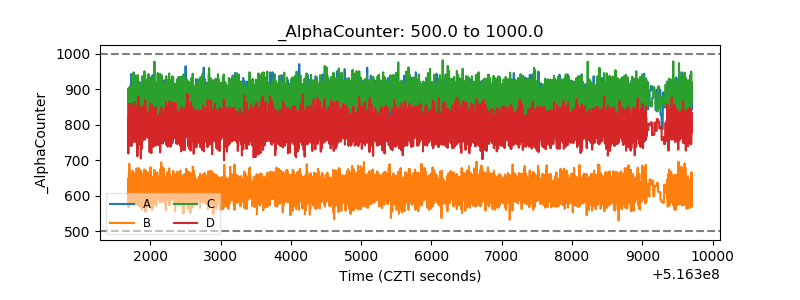 |
| _CPM_Rate | 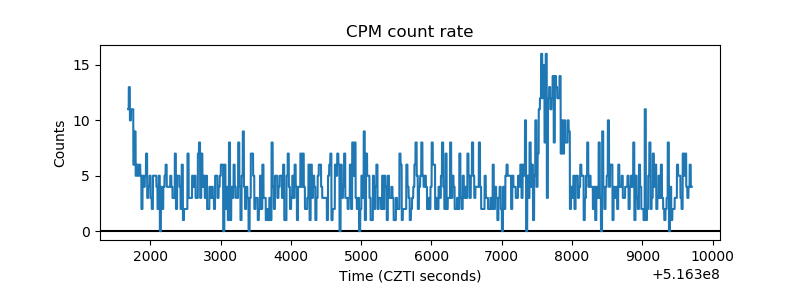 |
| CZT Counter | 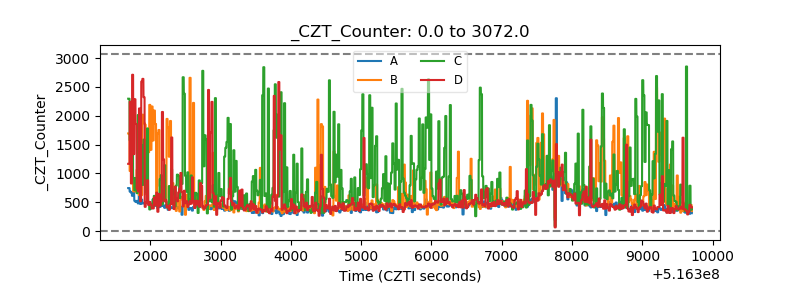 |
| +2.5 Volts monitor | 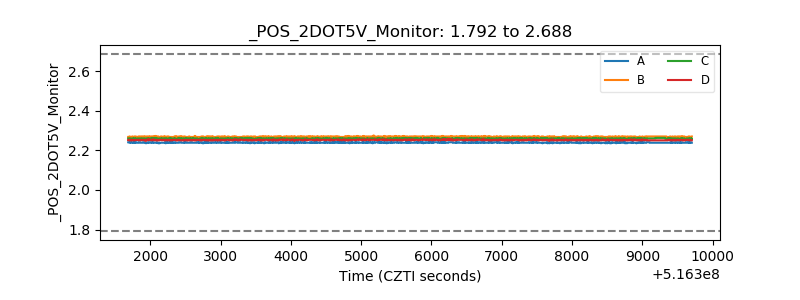 |
| +5 Volts monitor |  |
| _ROLL_ROT | 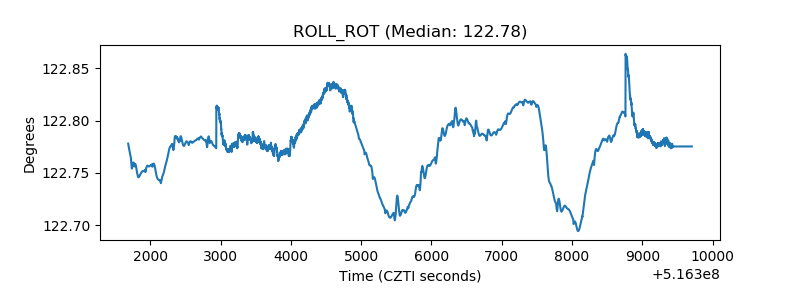 |
| _Roll_DEC | 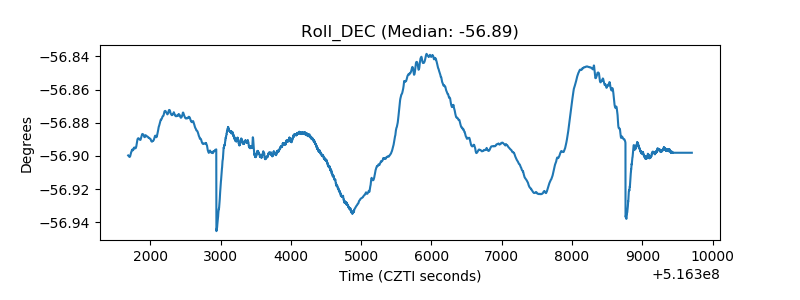 |
| _Roll_RA | 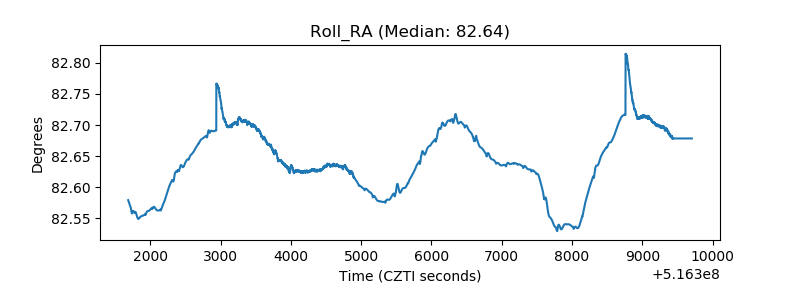 |
| Veto Counter | 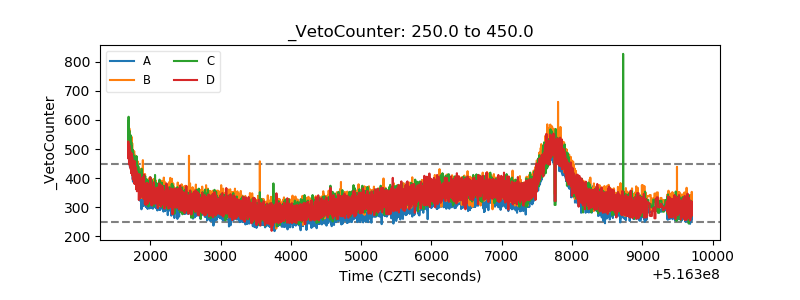 |