| Param | Original file | Final file |
|---|---|---|
| Filename | modeM0/AS1A14_113T09_9000006574_57475cztM0_level2.fits | modeM0/AS1A14_113T09_9000006574_57475cztM0_level2_quad_clean.evt |
| Size (bytes) | 2,032,761,600 | 335,571,840 |
| Size | 1.9 GB | 320.0 MB |
| Events in quadrant A | 12,064,682 | 2,287,151 |
| Events in quadrant B | 15,191,500 | 2,368,058 |
| Events in quadrant C | 22,430,995 | 1,972,243 |
| Events in quadrant D | 23,641,257 | 1,824,756 |
| Mode SS | |||
|---|---|---|---|
| Quadrant | BADHDUFLAG | Total packets | Discarded packets |
| A | 0 | 502 | 0 |
| B | 0 | 502 | 0 |
| C | 0 | 502 | 0 |
| D | 0 | 502 | 0 |
| Mode M9 | |||
|---|---|---|---|
| Quadrant | BADHDUFLAG | Total packets | Discarded packets |
| A | 0 | 18 | 0 |
| B | 0 | 18 | 0 |
| C | 0 | 18 | 0 |
| D | 0 | 18 | 0 |
| Mode M0 | |||
|---|---|---|---|
| Quadrant | BADHDUFLAG | Total packets | Discarded packets |
| A | 0 | 54279 | 4 |
| B | 0 | 62470 | 4 |
| C | 0 | 84045 | 4 |
| D | 0 | 87411 | 6 |
| Quadrant | Total seconds | Saturated seconds | Saturation percentage |
|---|---|---|---|
| A | 24824 | 378 | 1.522720% |
| B | 24825 | 1412 | 5.687815% |
| C | 24825 | 3018 | 12.157100% |
| D | 24824 | 3482 | 14.026748% |
Noise dominated data is calculated using 1-second bins in cleaned event files. If a bin has >2000 counts, and if more than 50% of those come from <1% of pixels, then it is considered to be noise-dominated and hence unusable.
| Quadrant | # 1 sec bins | Bins with >0 counts | Bins with >2000 counts | High rate bins dominated by noise | Noise dominated (total time) | Noise dominated (detector-on time) | Marked lightcurve |
|---|---|---|---|---|---|---|---|
| A | 26852 | 25112 | 174 | 174 | 0.65% | 0.69% | 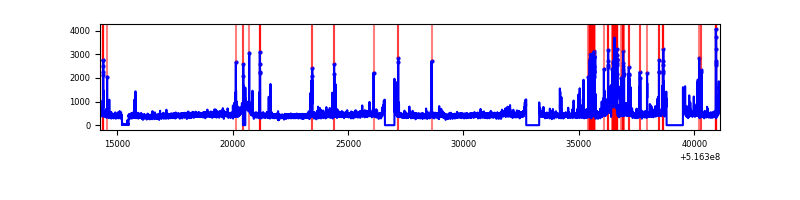 |
| B | 26853 | 25110 | 577 | 577 | 2.15% | 2.30% | 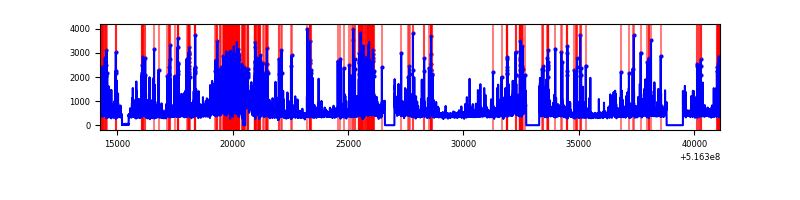 |
| C | 26853 | 25110 | 2488 | 2488 | 9.27% | 9.91% | 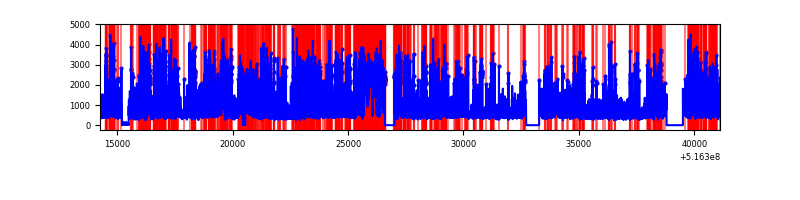 |
| D | 26852 | 25101 | 3288 | 3288 | 12.24% | 13.10% | 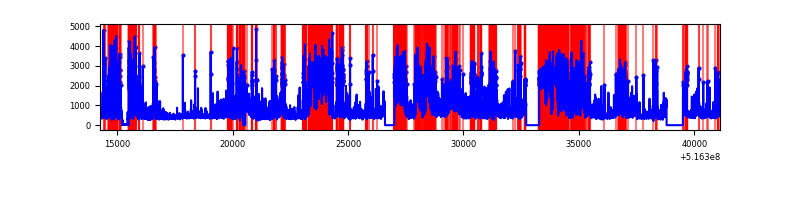 |
Top three noisy pixels from each quadrant. If the there are fewer than three noisy pixels in the level2.evt file, extra rows are filled as -1
| Pixel properties | Quadrant properties | ||||||
|---|---|---|---|---|---|---|---|
| Quadrant | DetID | PixID | Counts | Sigma | Mean | Median | Sigma |
| A | 10 | 251 | 793317 | 1197.8 | 2689 | 2623 | 660.1 |
| A | 7 | 64 | 563803 | 850.11 | 2689 | 2623 | 660.1 |
| A | 3 | 245 | 94448 | 139.1 | 2689 | 2623 | 660.1 |
| B | 4 | 206 | 3243599 | 5888.96 | 2605 | 2500 | 550.4 |
| B | 8 | 234 | 319748 | 576.43 | 2605 | 2500 | 550.4 |
| B | 5 | 185 | 302875 | 545.77 | 2605 | 2500 | 550.4 |
| C | 15 | 224 | 10334321 | 15459.38 | 2469 | 2444 | 668.3 |
| C | 12 | 254 | 920858 | 1374.2 | 2469 | 2444 | 668.3 |
| C | 14 | 254 | 627631 | 935.45 | 2469 | 2444 | 668.3 |
| D | 15 | 142 | 11415597 | 16672.37 | 2441 | 2331 | 684.6 |
| D | 2 | 249 | 830708 | 1210.08 | 2441 | 2331 | 684.6 |
| D | 7 | 96 | 495059 | 719.77 | 2441 | 2331 | 684.6 |
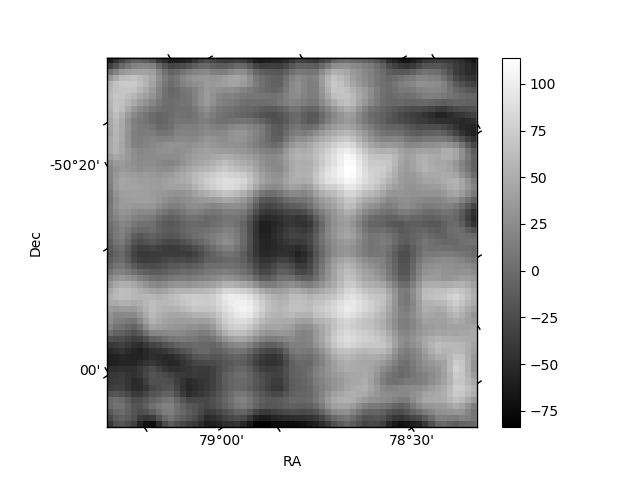
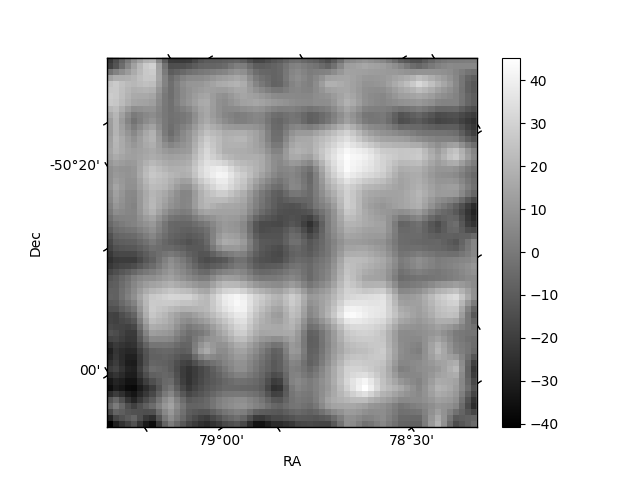
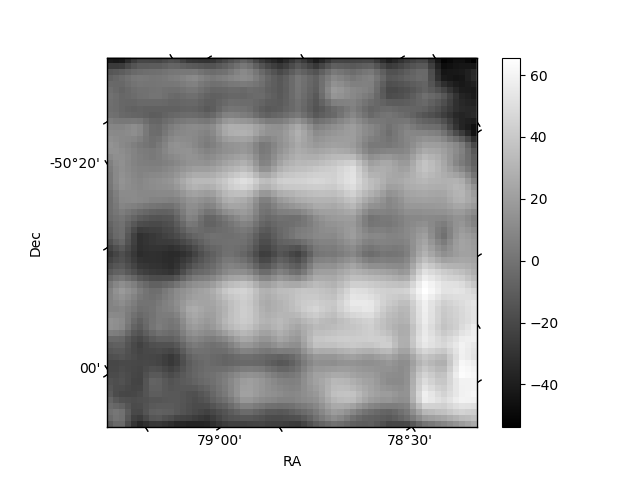
Histogram calculated using DETX and DETY for each event in the final _common_clean file
| Quadrant A | 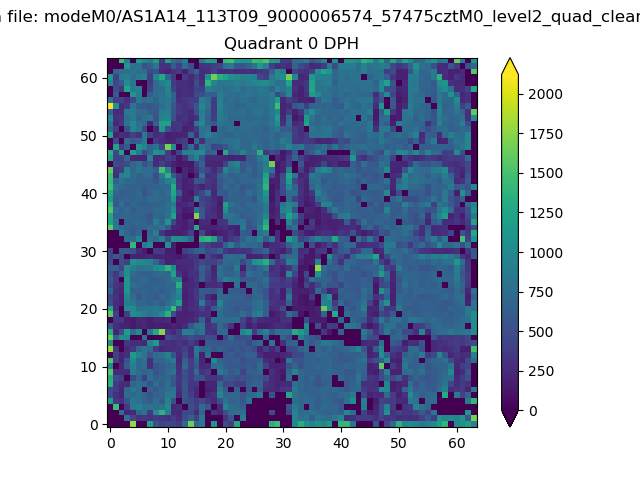 |
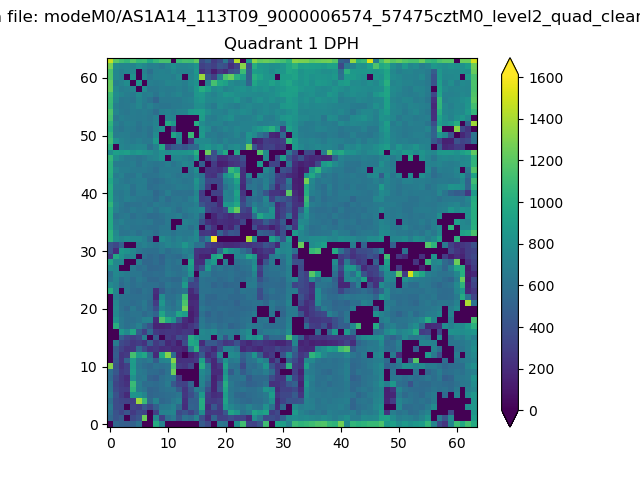 |
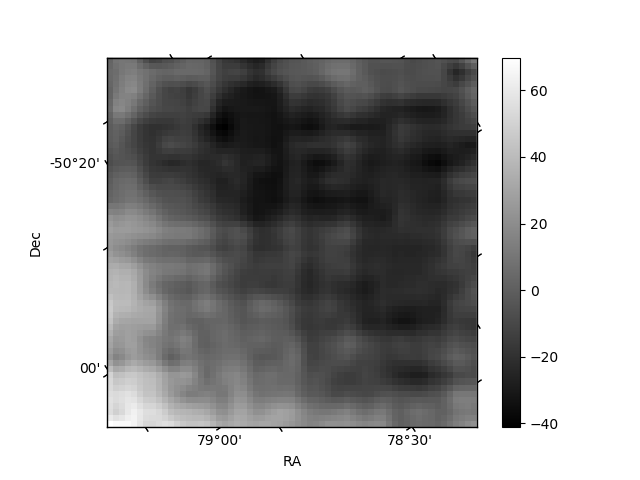
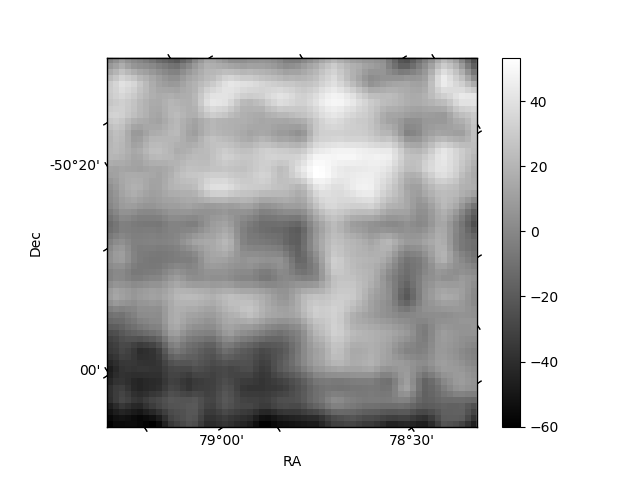
Quadrant B |
|---|---|---|---|
| Quadrant D | 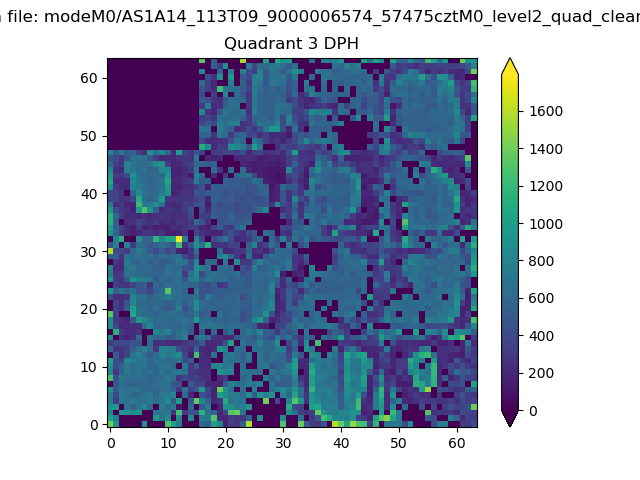 |
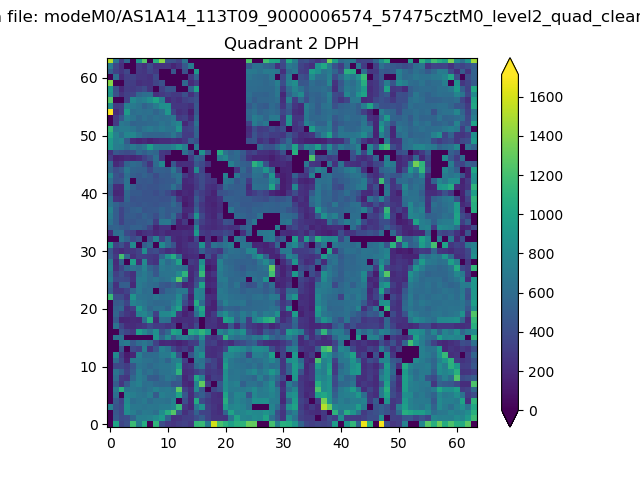 |
Quadrant C |
| Plot type | Count rate plots | Images |
|---|---|---|
| Comparison with Poisson distribution Blue bars denote a histogram of data divided into 1 sec bins. Red curve is a Poisson curve with rate = median count rate of data. |
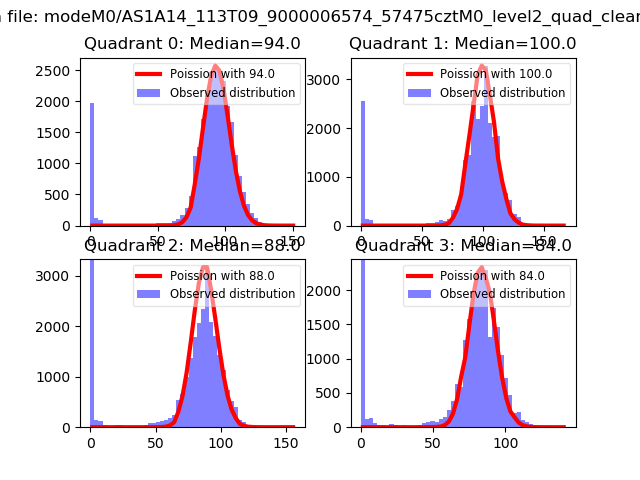 |
 |
| Quadrant-wise count rates Data is divided into 100 sec bins |
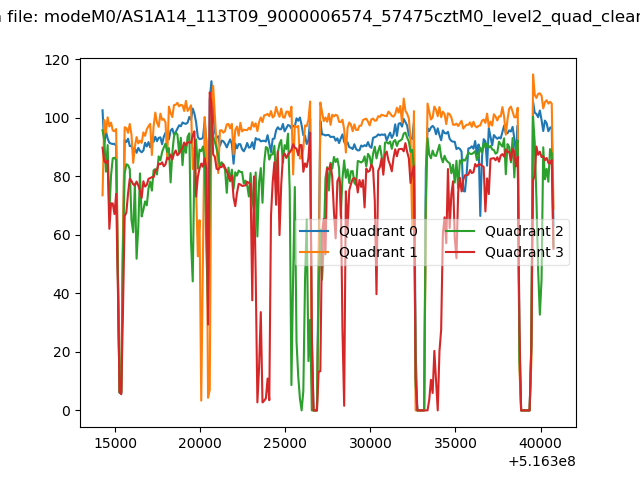 |
|
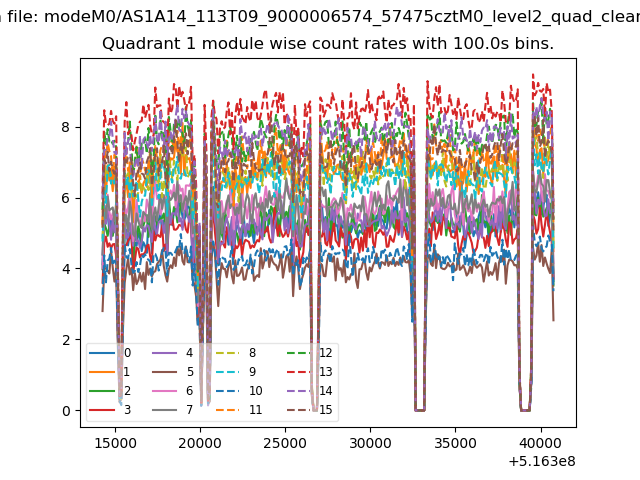
| Module-wise count rates for Quadrant A Data is divided into 100 sec bins |
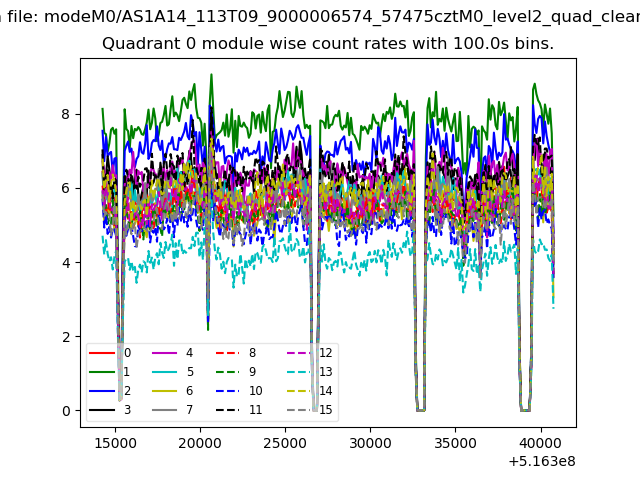 |
 |
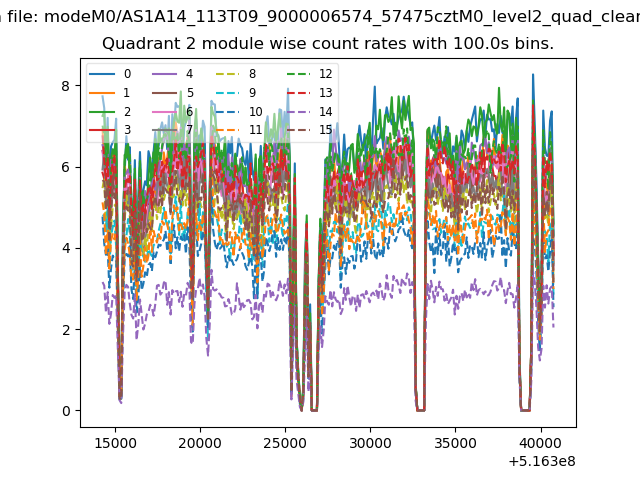
| Module-wise count rates for Quadrant B Data is divided into 100 sec bins |
 |
 |
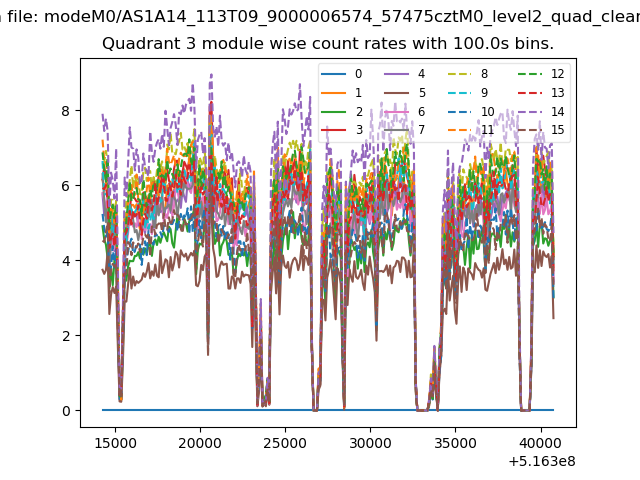
| Module-wise count rates for Quadrant C Data is divided into 100 sec bins |
 |
 |
| Module-wise count rates for Quadrant D Data is divided into 100 sec bins |
 |
 |
| Parameter | Plot |
|---|---|
| CZT HV Monitor | 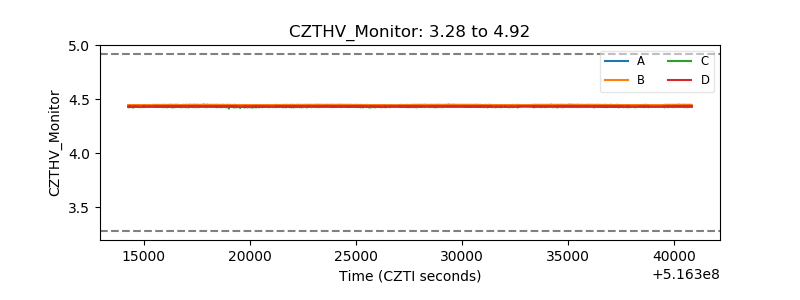 |
| D_VDD | 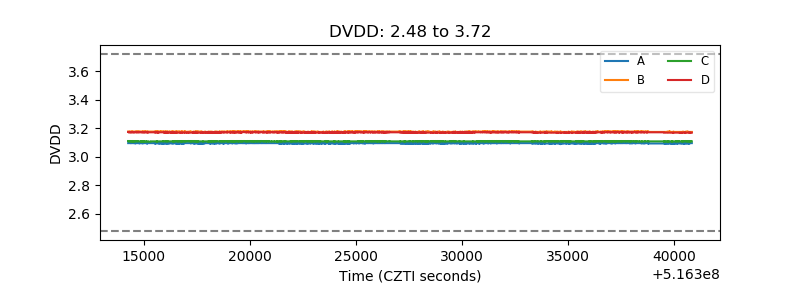 |
| Temperature 1 | 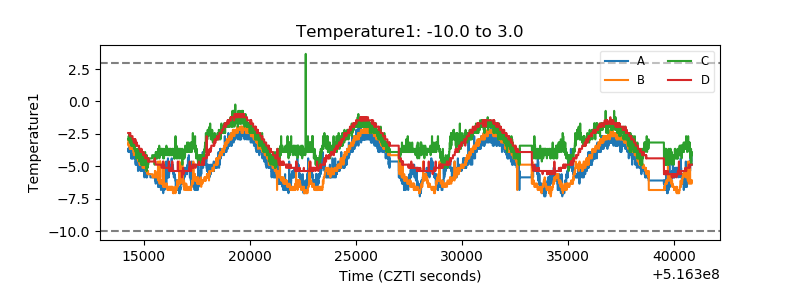 |
| Veto HV Monitor | 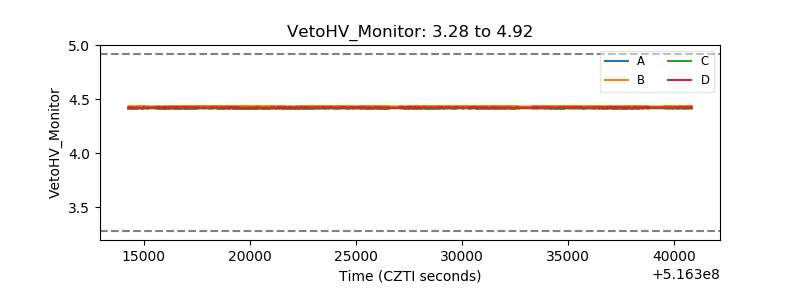 |
| Veto LLD | 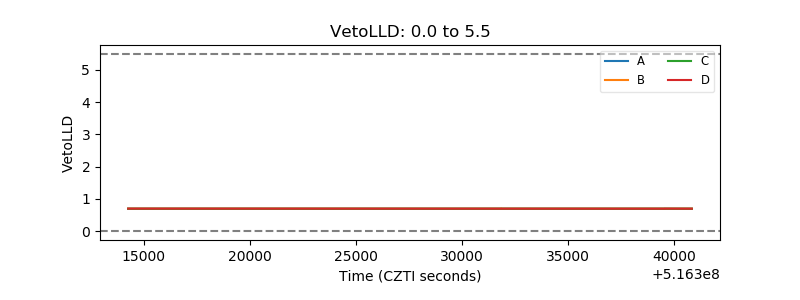 |
| Alpha Counter | 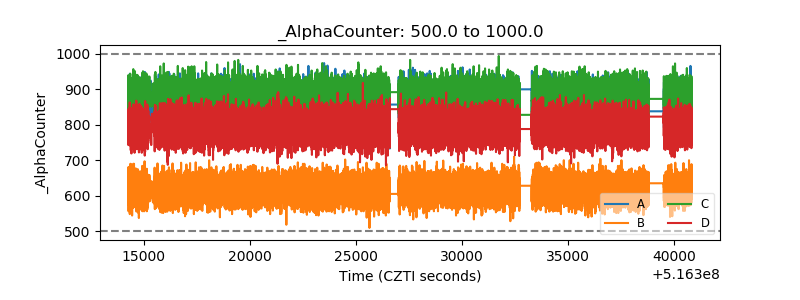 |
| _CPM_Rate | 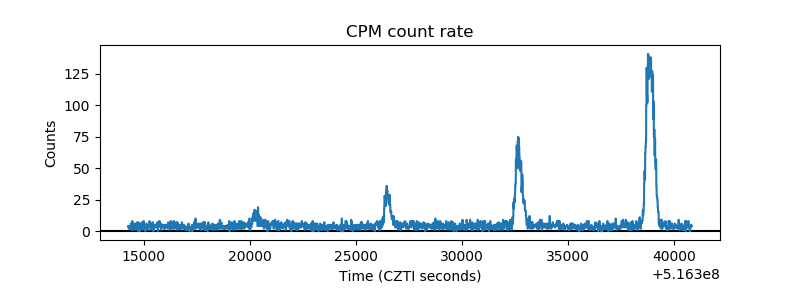 |
| CZT Counter | 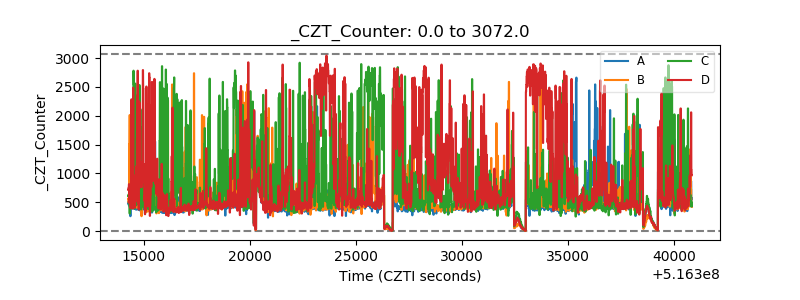 |
| +2.5 Volts monitor | 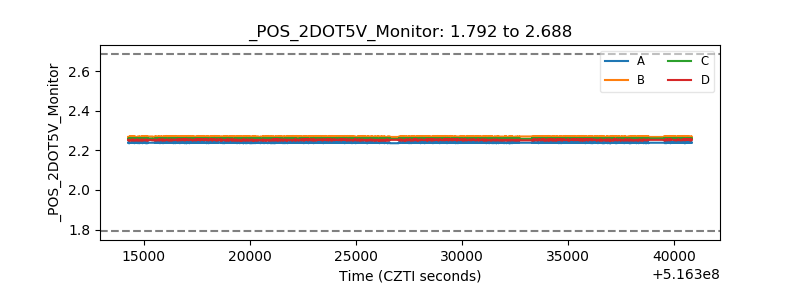 |
| +5 Volts monitor | 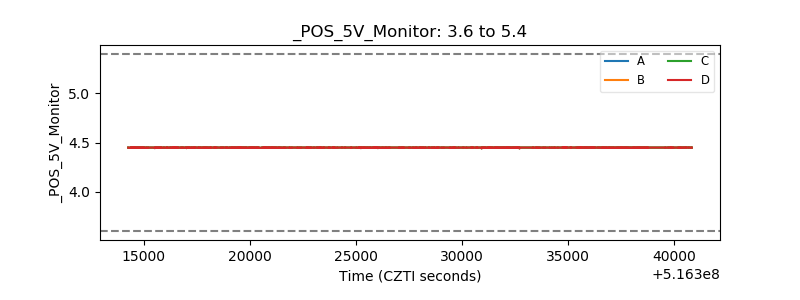 |
| _ROLL_ROT | 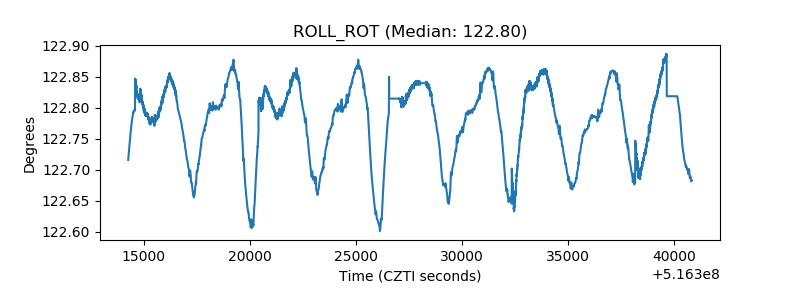 |
| _Roll_DEC | 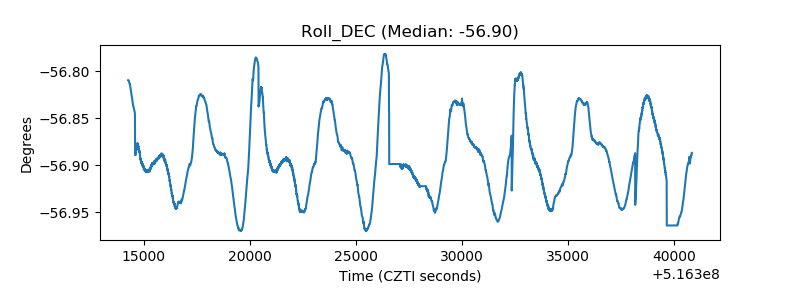 |
| _Roll_RA | 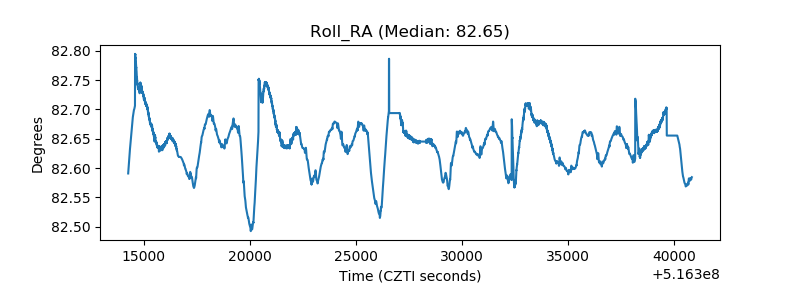 |
| Veto Counter | 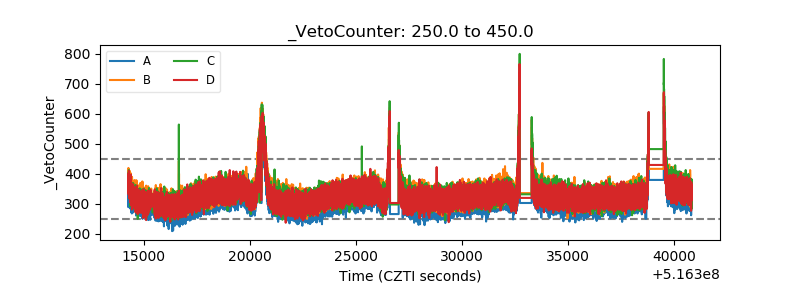 |