| Param | Original file | Final file |
|---|---|---|
| Filename | modeM0/AS1A14_113T09_9000006574_57476cztM0_level2.fits | modeM0/AS1A14_113T09_9000006574_57476cztM0_level2_quad_clean.evt |
| Size (bytes) | 542,419,200 | 97,899,840 |
| Size | 517.3 MB | 93.4 MB |
| Events in quadrant A | 3,633,811 | 657,999 |
| Events in quadrant B | 4,213,354 | 688,233 |
| Events in quadrant C | 5,720,991 | 584,836 |
| Events in quadrant D | 5,972,153 | 549,787 |
| Mode SS | |||
|---|---|---|---|
| Quadrant | BADHDUFLAG | Total packets | Discarded packets |
| A | 0 | 142 | 0 |
| B | 0 | 142 | 0 |
| C | 0 | 142 | 0 |
| D | 0 | 142 | 0 |
| Mode M9 | |||
|---|---|---|---|
| Quadrant | BADHDUFLAG | Total packets | Discarded packets |
| A | 0 | 9 | 0 |
| B | 0 | 10 | 0 |
| C | 0 | 10 | 0 |
| D | 0 | 10 | 0 |
| Mode M0 | |||
|---|---|---|---|
| Quadrant | BADHDUFLAG | Total packets | Discarded packets |
| A | 0 | 15439 | 2 |
| B | 0 | 17198 | 2 |
| C | 0 | 21852 | 2 |
| D | 0 | 22438 | 2 |
| Quadrant | Total seconds | Saturated seconds | Saturation percentage |
|---|---|---|---|
| A | 6933 | 127 | 1.831819% |
| B | 6933 | 376 | 5.423338% |
| C | 6933 | 685 | 9.880283% |
| D | 6933 | 677 | 9.764893% |
Noise dominated data is calculated using 1-second bins in cleaned event files. If a bin has >2000 counts, and if more than 50% of those come from <1% of pixels, then it is considered to be noise-dominated and hence unusable.
| Quadrant | # 1 sec bins | Bins with >0 counts | Bins with >2000 counts | High rate bins dominated by noise | Noise dominated (total time) | Noise dominated (detector-on time) | Marked lightcurve |
|---|---|---|---|---|---|---|---|
| A | 7798 | 6933 | 21 | 21 | 0.27% | 0.30% | 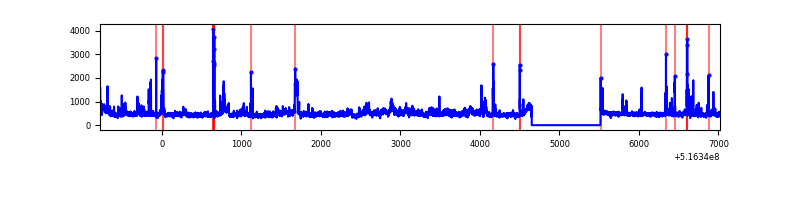 |
| B | 7798 | 6933 | 178 | 178 | 2.28% | 2.57% | 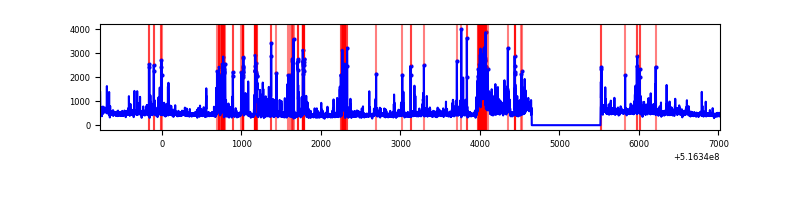 |
| C | 7798 | 6933 | 522 | 522 | 6.69% | 7.53% | 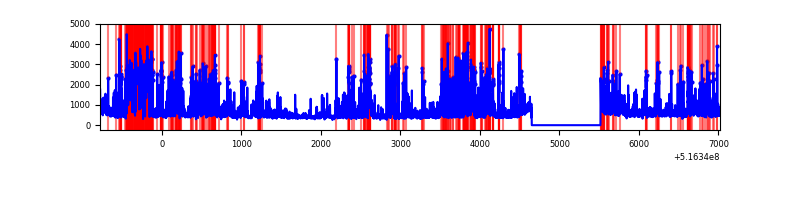 |
| D | 7798 | 6933 | 593 | 593 | 7.60% | 8.55% | 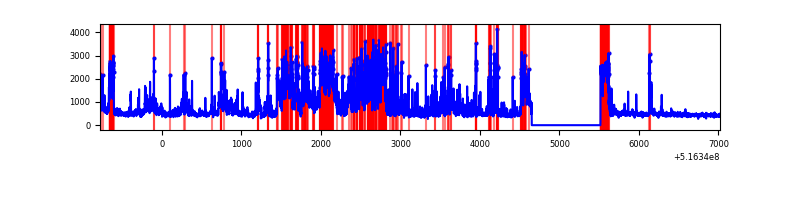 |
Top three noisy pixels from each quadrant. If the there are fewer than three noisy pixels in the level2.evt file, extra rows are filled as -1
| Pixel properties | Quadrant properties | ||||||
|---|---|---|---|---|---|---|---|
| Quadrant | DetID | PixID | Counts | Sigma | Mean | Median | Sigma |
| A | 10 | 251 | 401600 | 2145.13 | 760 | 742 | 186.9 |
| A | 8 | 9 | 230703 | 1230.6 | 760 | 742 | 186.9 |
| A | 3 | 128 | 15597 | 79.49 | 760 | 742 | 186.9 |
| B | 4 | 206 | 444151 | 2783.67 | 743 | 715 | 159.3 |
| B | 2 | 249 | 256847 | 1607.87 | 743 | 715 | 159.3 |
| B | 10 | 246 | 135157 | 843.96 | 743 | 715 | 159.3 |
| C | 15 | 224 | 2333836 | 12013.06 | 718 | 712 | 194.2 |
| C | 12 | 254 | 245248 | 1259.1 | 718 | 712 | 194.2 |
| C | 14 | 254 | 145317 | 744.56 | 718 | 712 | 194.2 |
| D | 15 | 142 | 2306608 | 11564.95 | 715 | 683 | 199.4 |
| D | 2 | 249 | 574611 | 2878.43 | 715 | 683 | 199.4 |
| D | 3 | 12 | 94193 | 468.98 | 715 | 683 | 199.4 |
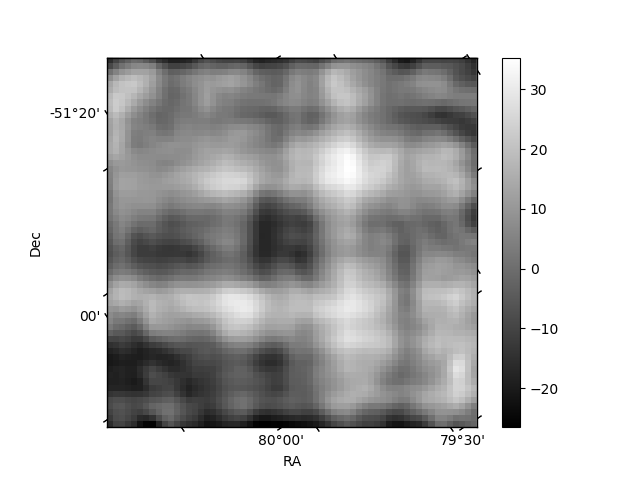
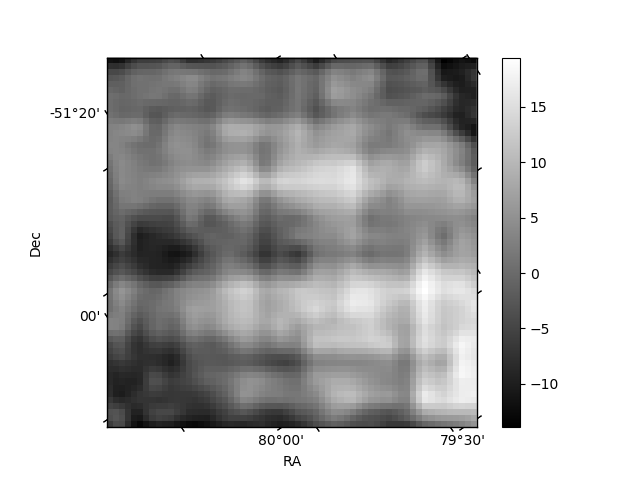
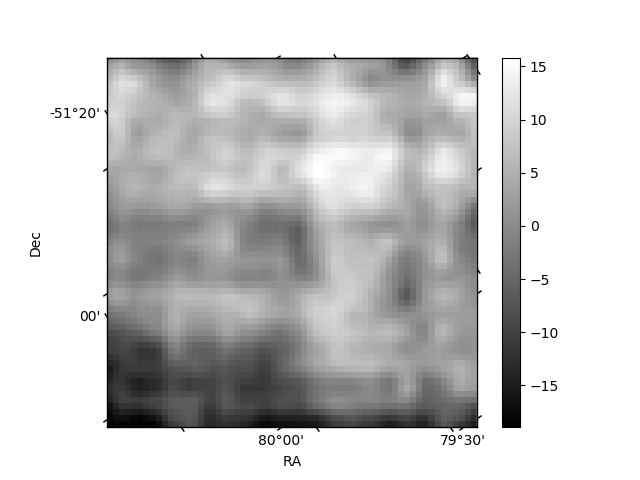
Histogram calculated using DETX and DETY for each event in the final _common_clean file
| Quadrant A | 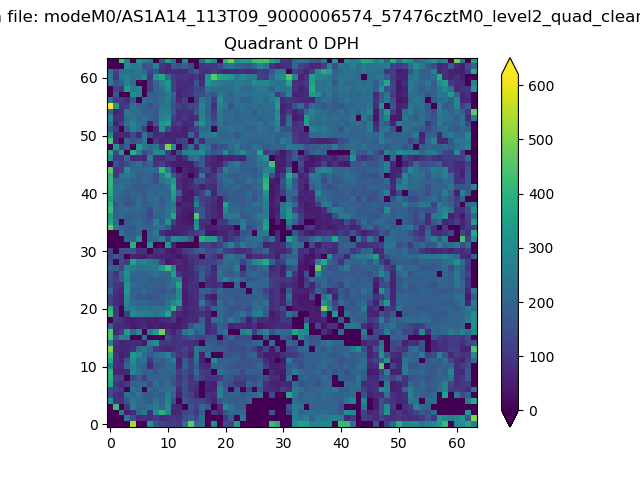 |
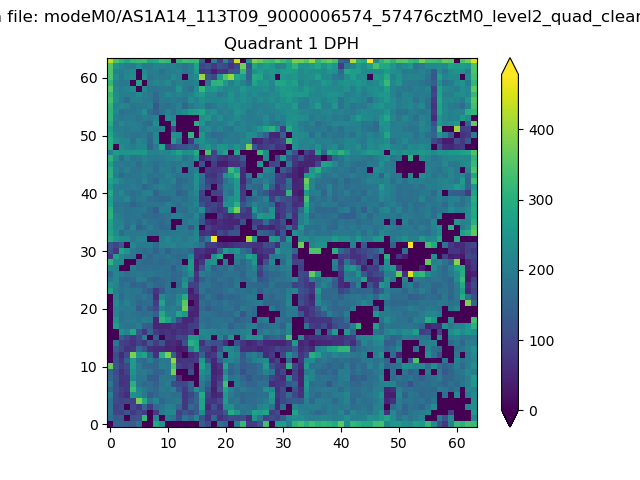 |
Quadrant B |
|---|---|---|---|
| Quadrant D | 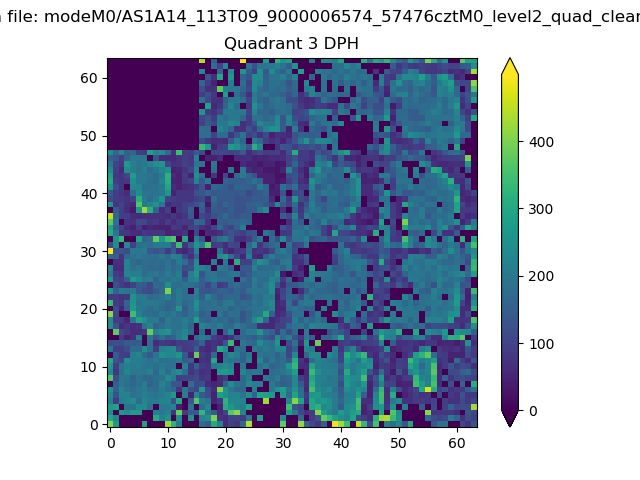 |
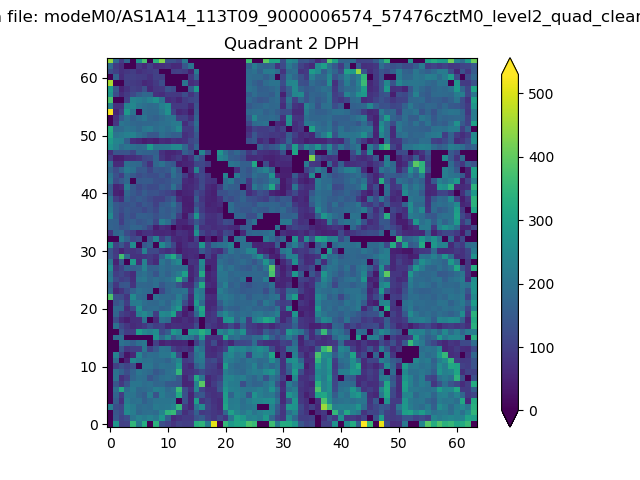 |
Quadrant C |
| Plot type | Count rate plots | Images |
|---|---|---|
| Comparison with Poisson distribution Blue bars denote a histogram of data divided into 1 sec bins. Red curve is a Poisson curve with rate = median count rate of data. |
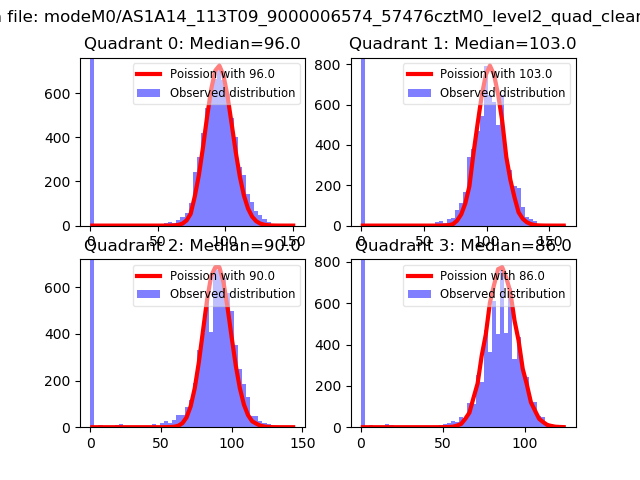 |
 |
| Quadrant-wise count rates Data is divided into 100 sec bins |
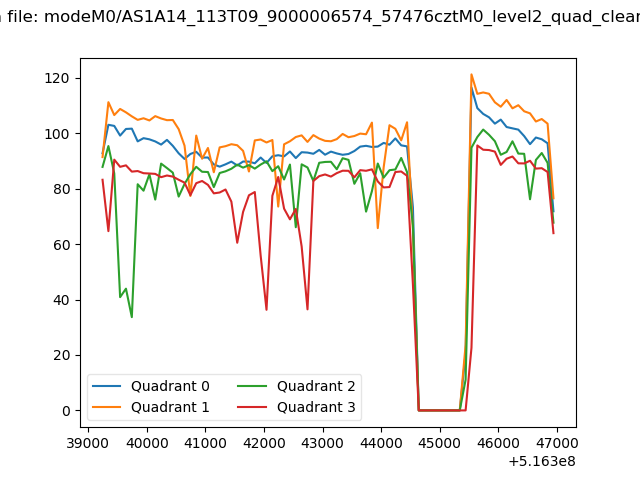 |
|
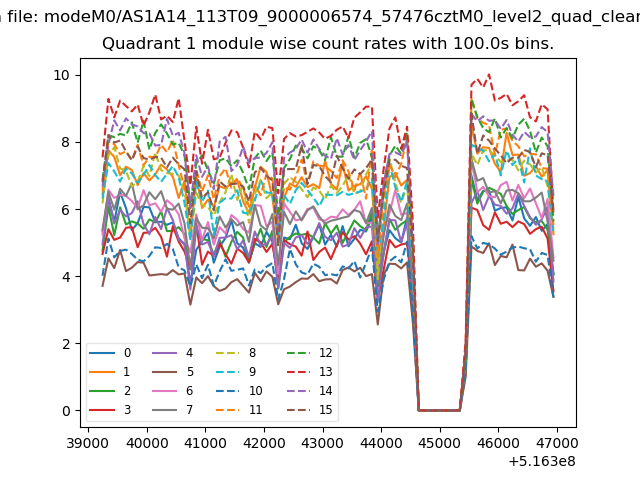
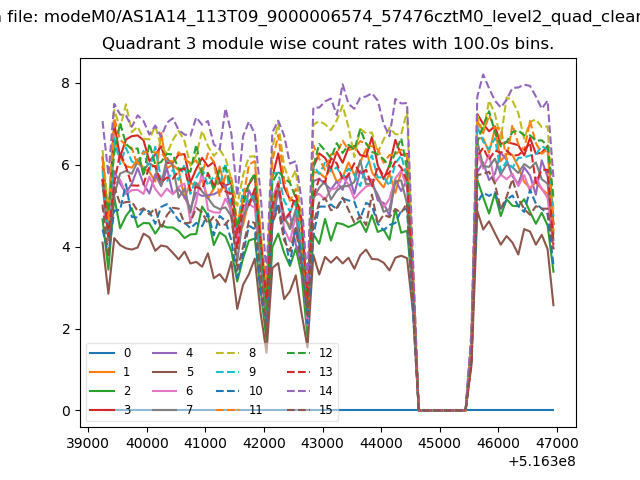
| Module-wise count rates for Quadrant A Data is divided into 100 sec bins |
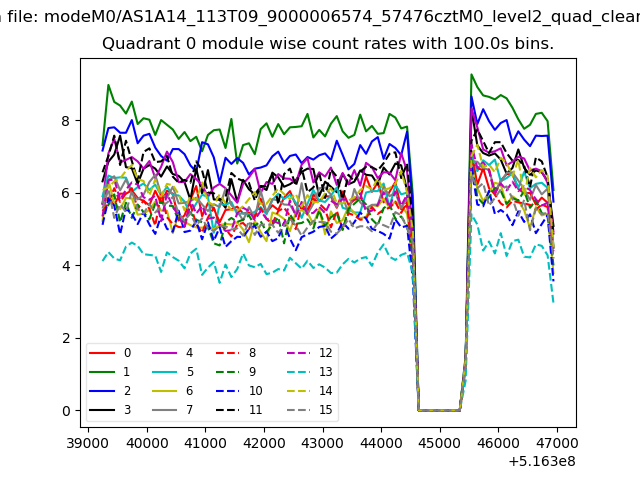 |
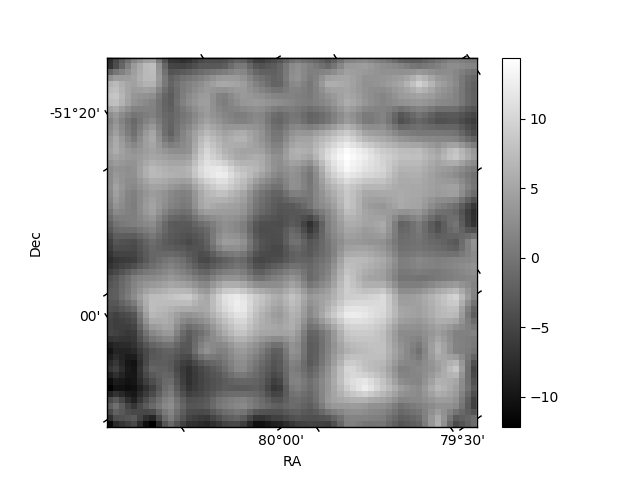 |
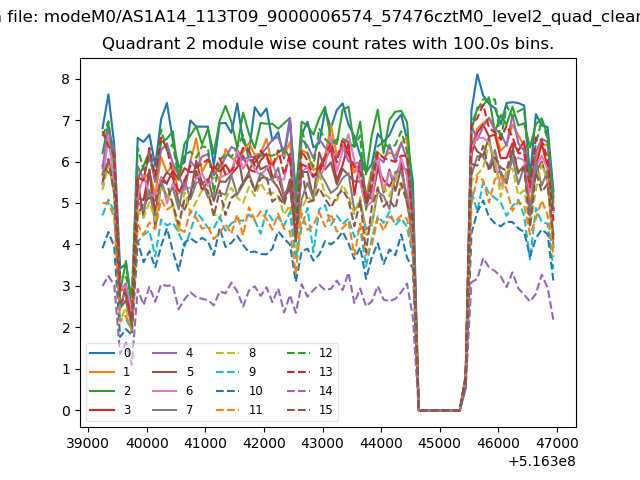
| Module-wise count rates for Quadrant B Data is divided into 100 sec bins |
 |
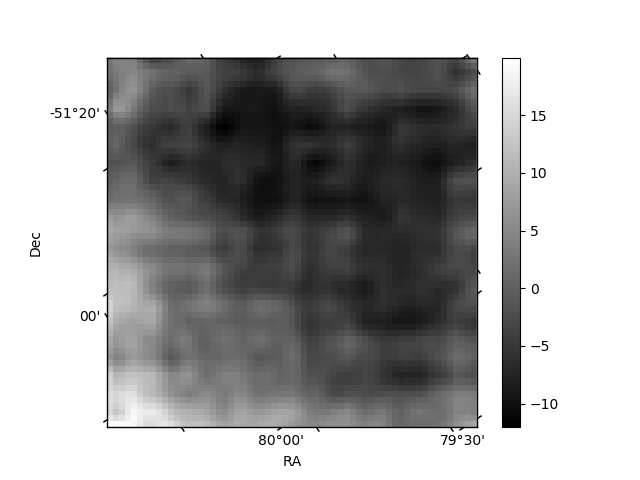 |
| Module-wise count rates for Quadrant C Data is divided into 100 sec bins |
 |
 |
| Module-wise count rates for Quadrant D Data is divided into 100 sec bins |
 |
 |
| Parameter | Plot |
|---|---|
| CZT HV Monitor | 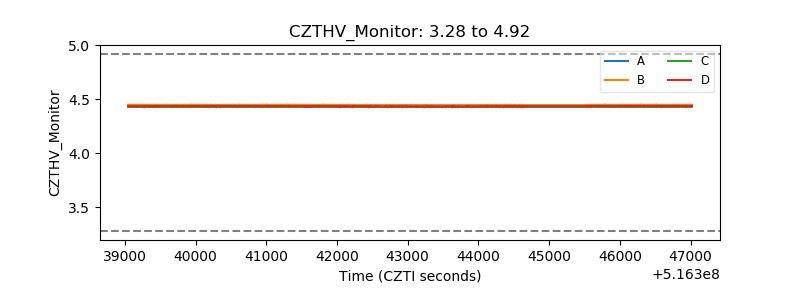 |
| D_VDD | 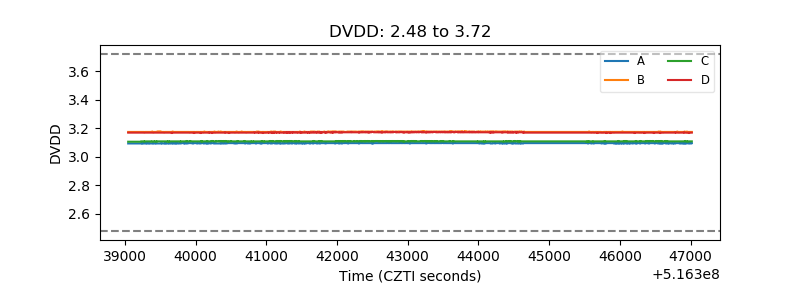 |
| Temperature 1 | 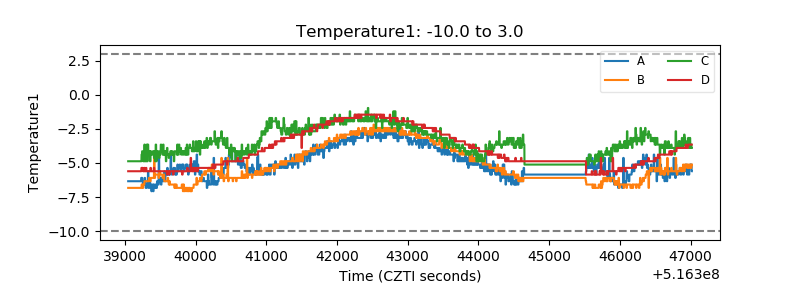 |
| Veto HV Monitor | 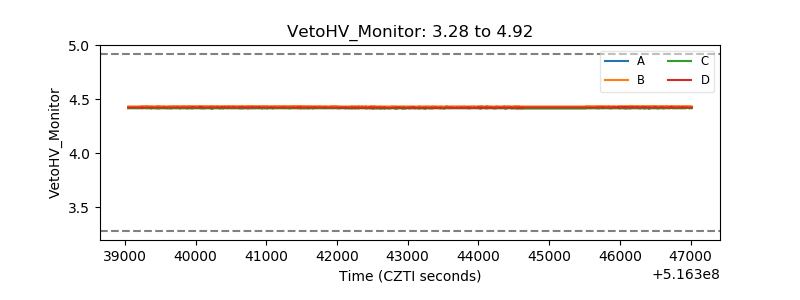 |
| Veto LLD | 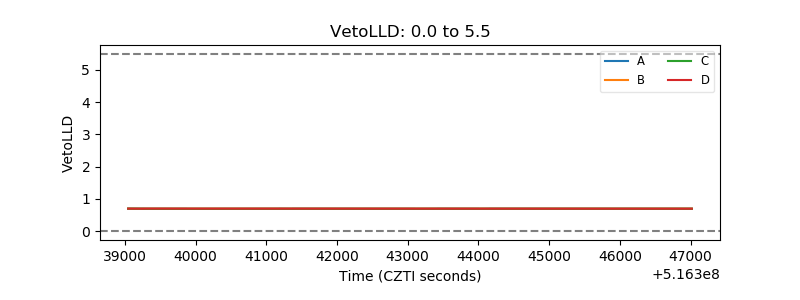 |
| Alpha Counter |  |
| _CPM_Rate | 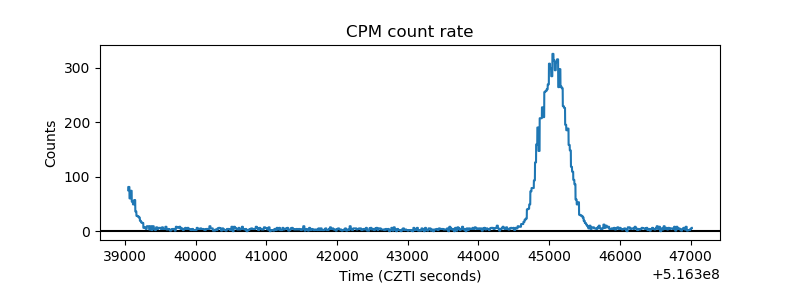 |
| CZT Counter | 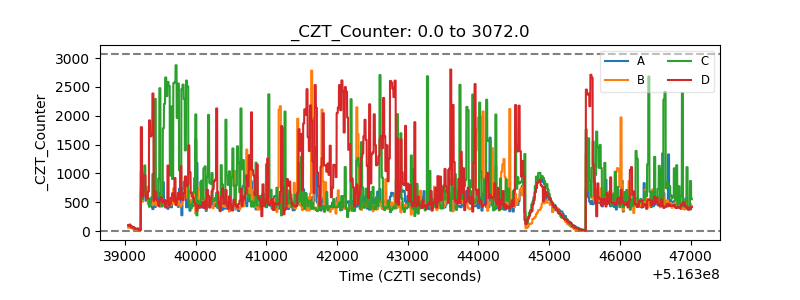 |
| +2.5 Volts monitor | 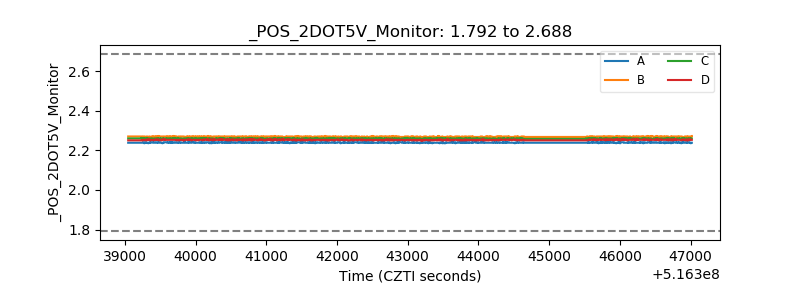 |
| +5 Volts monitor | 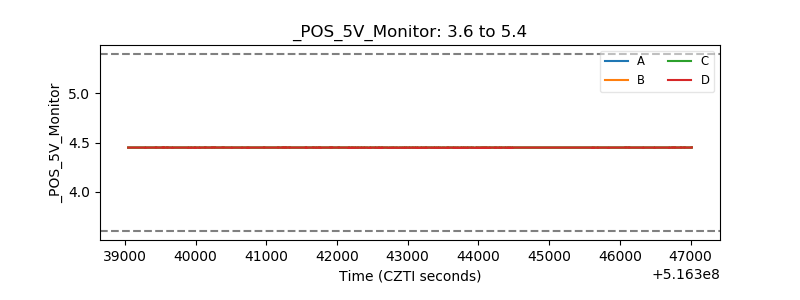 |
| _ROLL_ROT | 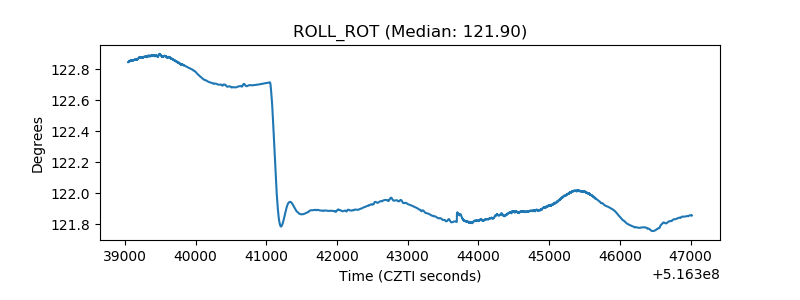 |
| _Roll_DEC | 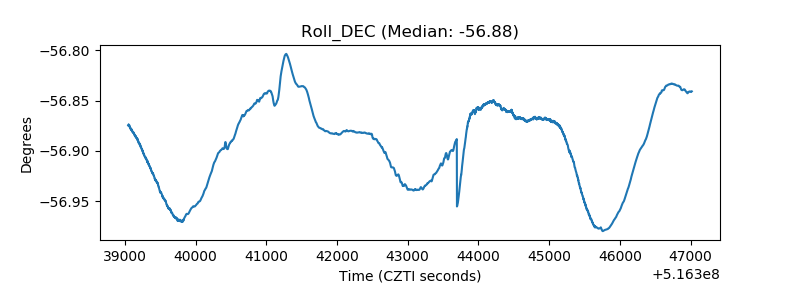 |
| _Roll_RA | 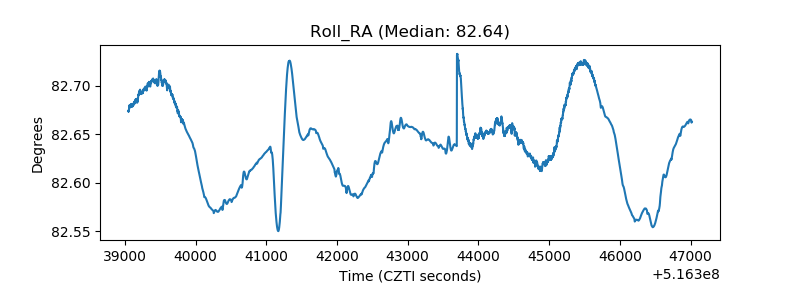 |
| Veto Counter | 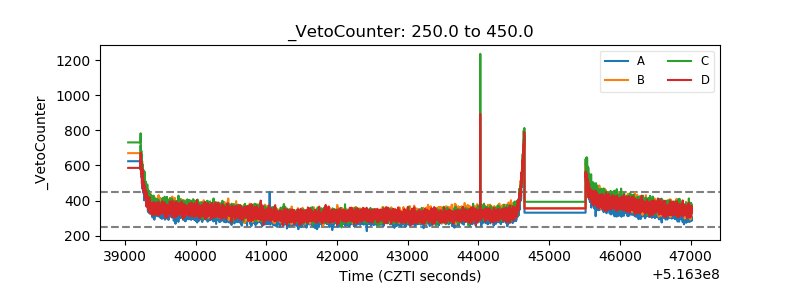 |