| Param | Original file | Final file |
|---|---|---|
| Filename | modeM0/AS1A14_113T09_9000006574_57478cztM0_level2.fits | modeM0/AS1A14_113T09_9000006574_57478cztM0_level2_quad_clean.evt |
| Size (bytes) | 449,003,520 | 85,089,600 |
| Size | 428.2 MB | 81.1 MB |
| Events in quadrant A | 3,435,888 | 555,560 |
| Events in quadrant B | 3,909,216 | 599,298 |
| Events in quadrant C | 4,283,893 | 538,015 |
| Events in quadrant D | 4,526,197 | 465,773 |
| Mode SS | |||
|---|---|---|---|
| Quadrant | BADHDUFLAG | Total packets | Discarded packets |
| A | 0 | 122 | 0 |
| B | 0 | 122 | 0 |
| C | 0 | 122 | 0 |
| D | 0 | 122 | 0 |
| Mode M9 | |||
|---|---|---|---|
| Quadrant | BADHDUFLAG | Total packets | Discarded packets |
| A | 0 | 10 | 0 |
| B | 0 | 10 | 0 |
| C | 0 | 10 | 0 |
| D | 0 | 10 | 0 |
| Mode M0 | |||
|---|---|---|---|
| Quadrant | BADHDUFLAG | Total packets | Discarded packets |
| A | 0 | 14438 | 1 |
| B | 0 | 15742 | 7 |
| C | 0 | 16944 | 1 |
| D | 0 | 17655 | 1 |
| Quadrant | Total seconds | Saturated seconds | Saturation percentage |
|---|---|---|---|
| A | 5980 | 335 | 5.602007% |
| B | 5979 | 367 | 6.138150% |
| C | 5980 | 318 | 5.317726% |
| D | 5980 | 694 | 11.605351% |
Noise dominated data is calculated using 1-second bins in cleaned event files. If a bin has >2000 counts, and if more than 50% of those come from <1% of pixels, then it is considered to be noise-dominated and hence unusable.
| Quadrant | # 1 sec bins | Bins with >0 counts | Bins with >2000 counts | High rate bins dominated by noise | Noise dominated (total time) | Noise dominated (detector-on time) | Marked lightcurve |
|---|---|---|---|---|---|---|---|
| A | 6965 | 5980 | 254 | 254 | 3.65% | 4.25% | 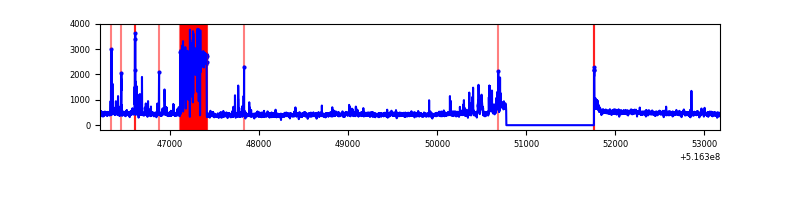 |
| B | 6964 | 5979 | 201 | 201 | 2.89% | 3.36% | 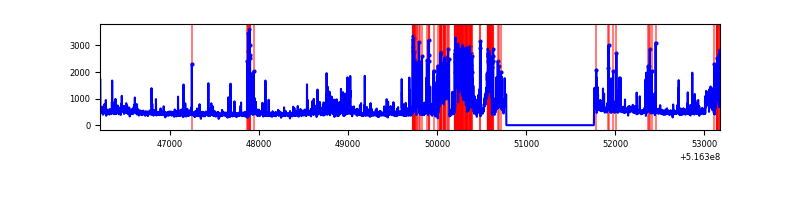 |
| C | 6965 | 5980 | 239 | 239 | 3.43% | 4.00% | 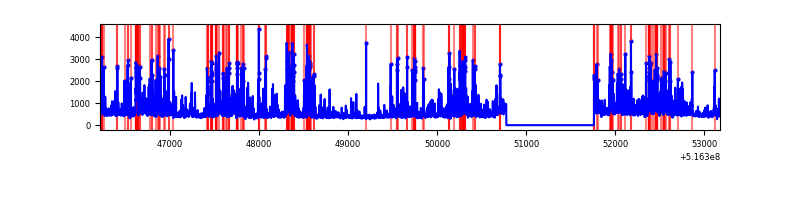 |
| D | 6965 | 5980 | 609 | 609 | 8.74% | 10.18% | 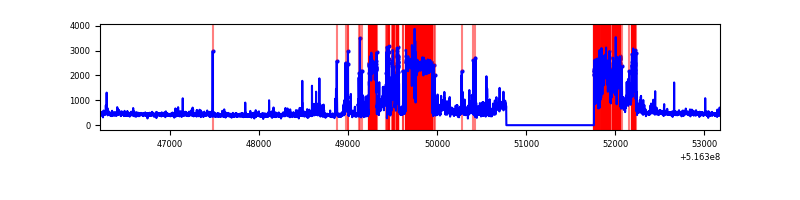 |
Top three noisy pixels from each quadrant. If the there are fewer than three noisy pixels in the level2.evt file, extra rows are filled as -1
| Pixel properties | Quadrant properties | ||||||
|---|---|---|---|---|---|---|---|
| Quadrant | DetID | PixID | Counts | Sigma | Mean | Median | Sigma |
| A | 10 | 251 | 899844 | 5659.8 | 643 | 626 | 158.9 |
| A | 3 | 128 | 32075 | 197.94 | 643 | 626 | 158.9 |
| A | 4 | 3 | 21811 | 133.34 | 643 | 626 | 158.9 |
| B | 2 | 249 | 680516 | 5012.05 | 635 | 612 | 135.7 |
| B | 4 | 206 | 305164 | 2245.07 | 635 | 612 | 135.7 |
| B | 7 | 252 | 94127 | 689.36 | 635 | 612 | 135.7 |
| C | 15 | 224 | 1293096 | 7491.21 | 630 | 624 | 172.5 |
| C | 14 | 254 | 290915 | 1682.54 | 630 | 624 | 172.5 |
| C | 14 | 245 | 71717 | 412.06 | 630 | 624 | 172.5 |
| D | 2 | 249 | 1249928 | 7369.06 | 601 | 573 | 169.5 |
| D | 15 | 142 | 723119 | 4261.79 | 601 | 573 | 169.5 |
| D | 3 | 12 | 55569 | 324.38 | 601 | 573 | 169.5 |
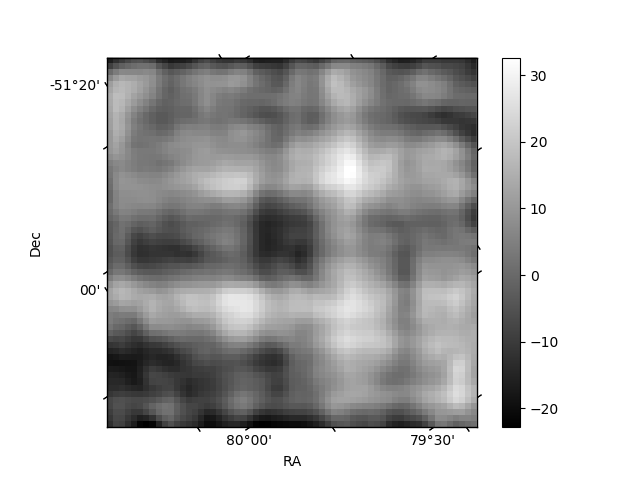
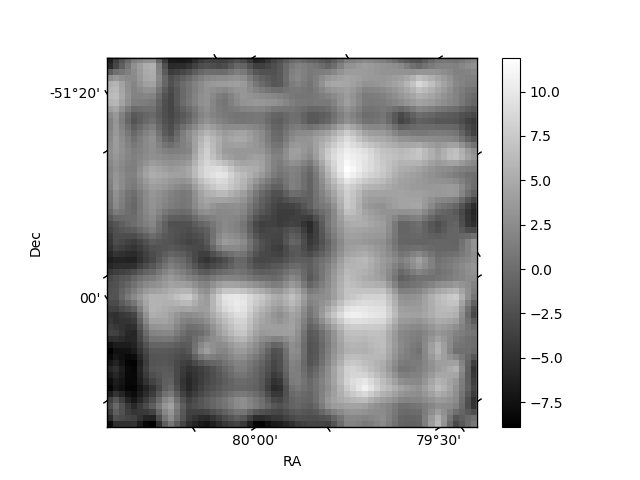
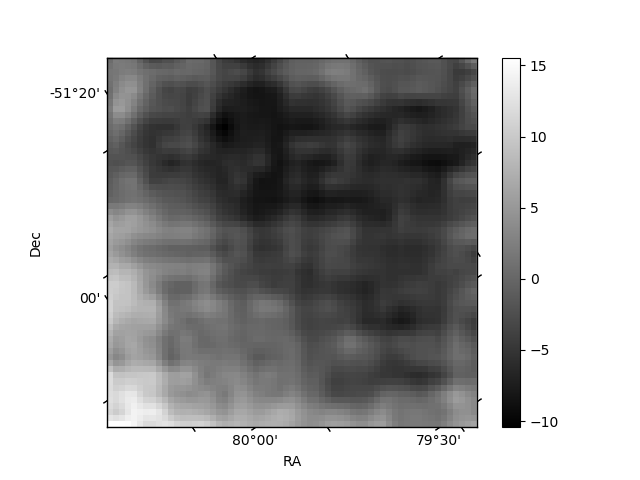
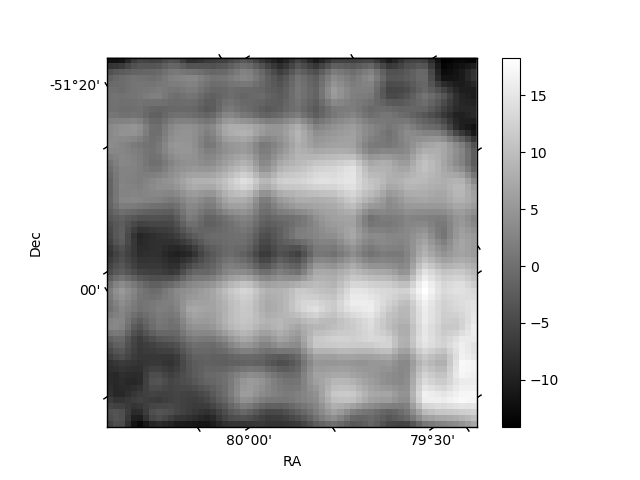
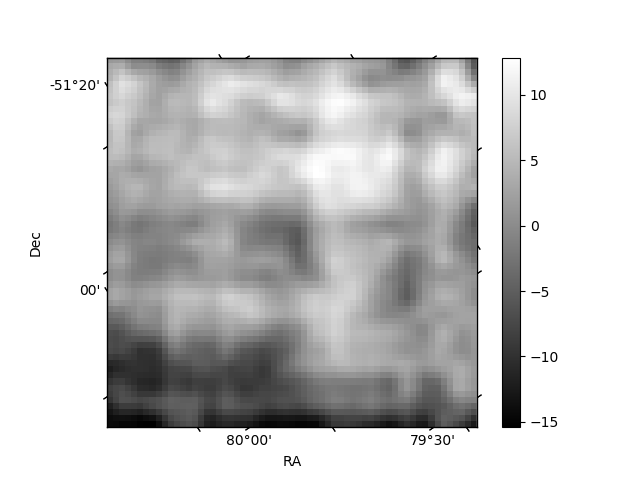
Histogram calculated using DETX and DETY for each event in the final _common_clean file
| Quadrant A | 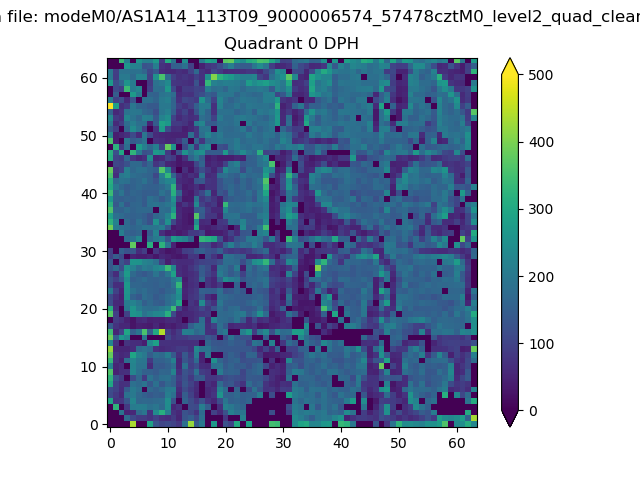 |
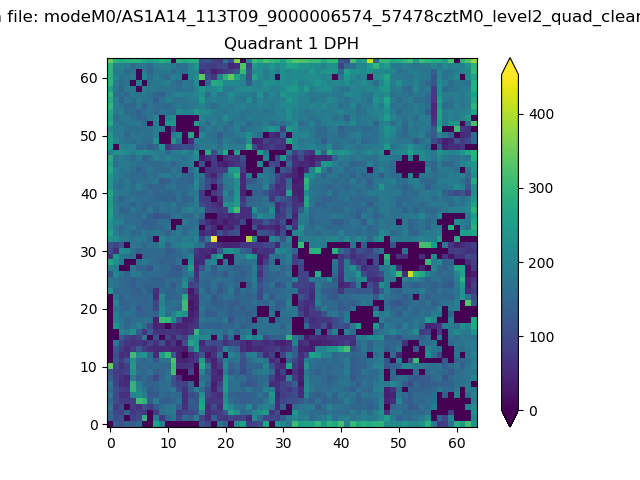 |
Quadrant B |
|---|---|---|---|
| Quadrant D | 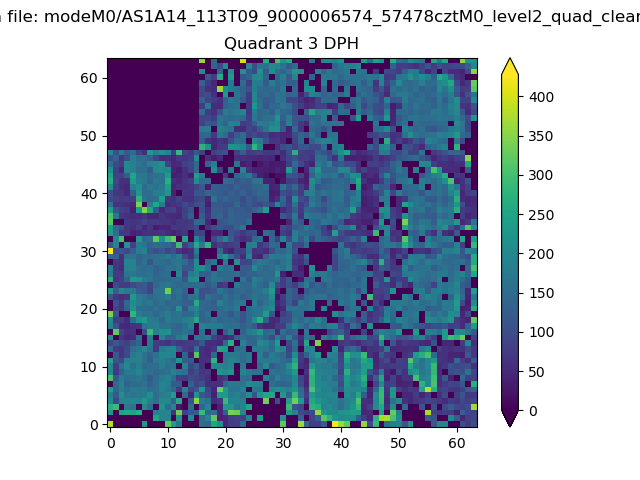 |
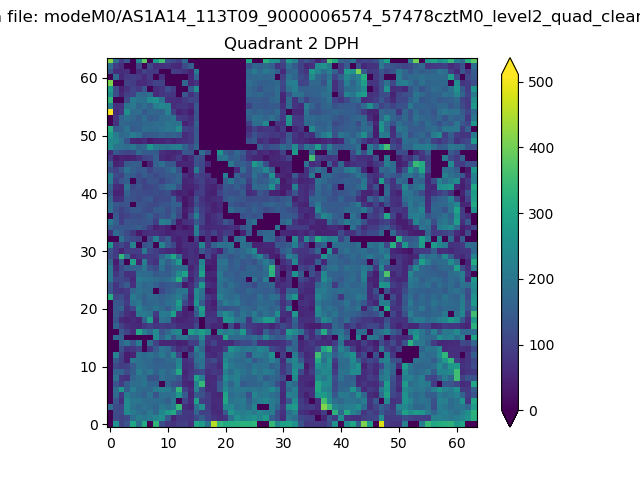 |
Quadrant C |
| Plot type | Count rate plots | Images |
|---|---|---|
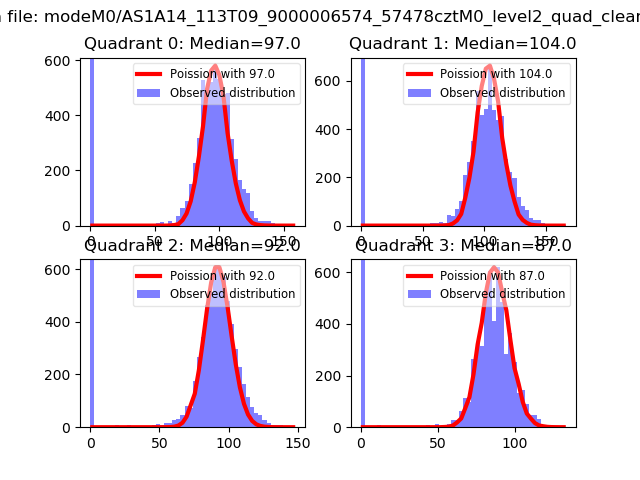
| Comparison with Poisson distribution Blue bars denote a histogram of data divided into 1 sec bins. Red curve is a Poisson curve with rate = median count rate of data. |
 |
 |
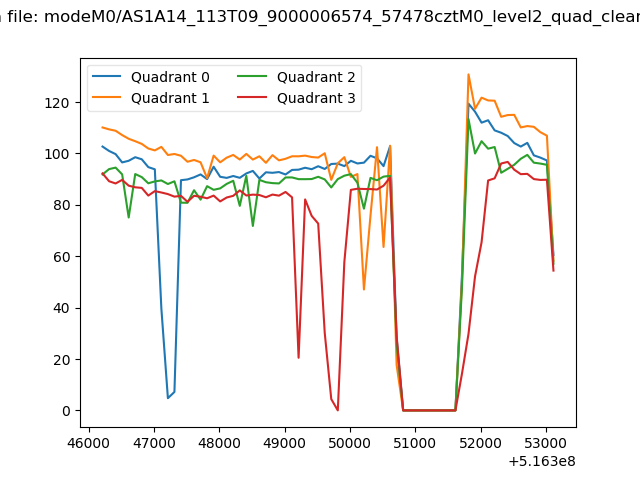
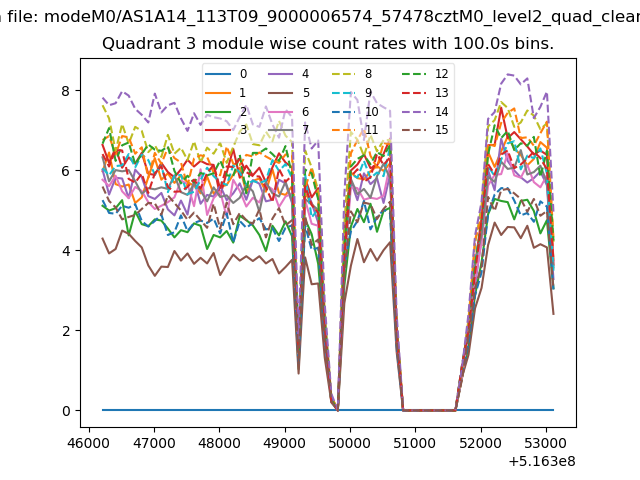
| Quadrant-wise count rates Data is divided into 100 sec bins |
 |
|
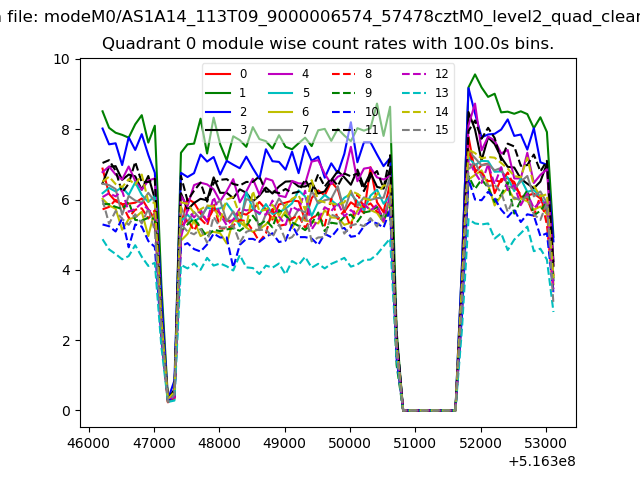
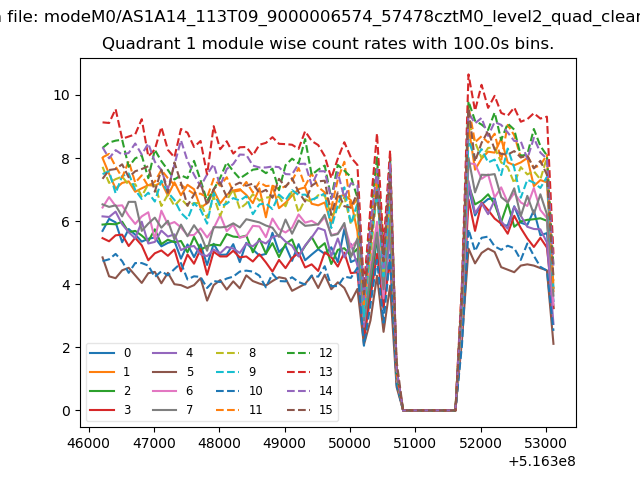
| Module-wise count rates for Quadrant A Data is divided into 100 sec bins |
 |
 |
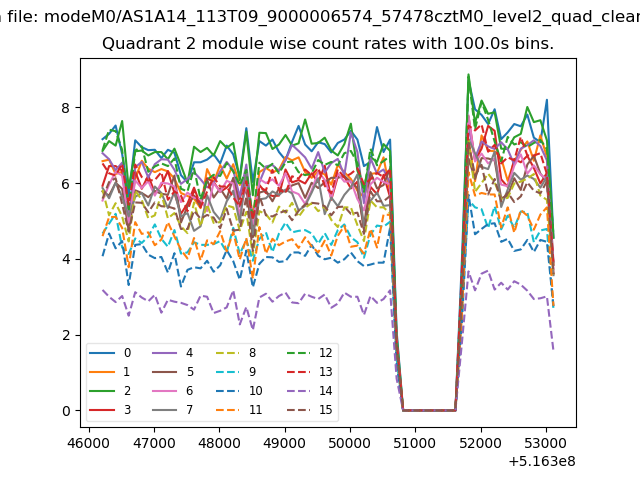
| Module-wise count rates for Quadrant B Data is divided into 100 sec bins |
 |
 |
| Module-wise count rates for Quadrant C Data is divided into 100 sec bins |
 |
 |
| Module-wise count rates for Quadrant D Data is divided into 100 sec bins |
 |
 |
| Parameter | Plot |
|---|---|
| CZT HV Monitor | 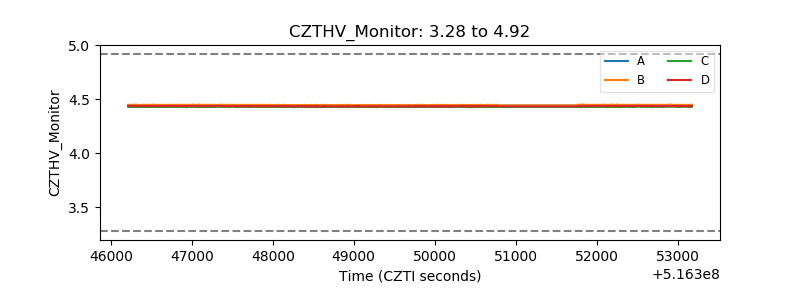 |
| D_VDD | 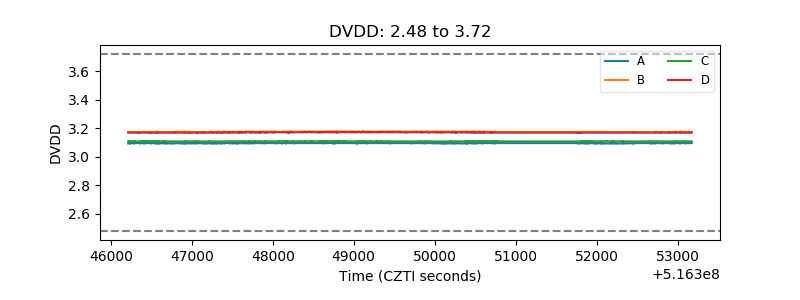 |
| Temperature 1 | 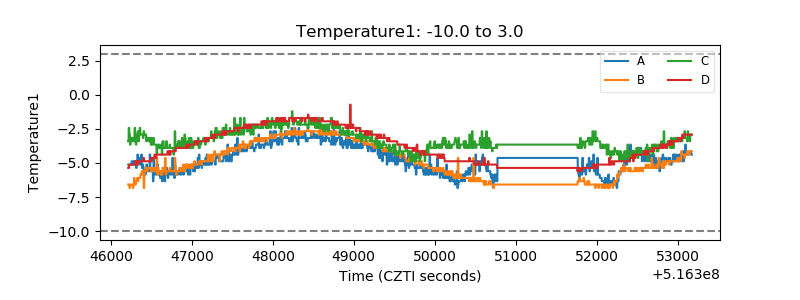 |
| Veto HV Monitor | 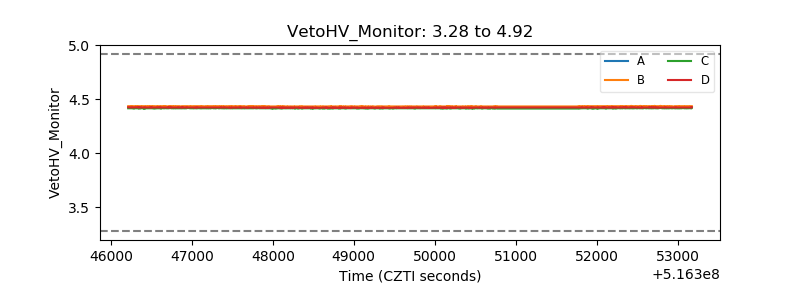 |
| Veto LLD | 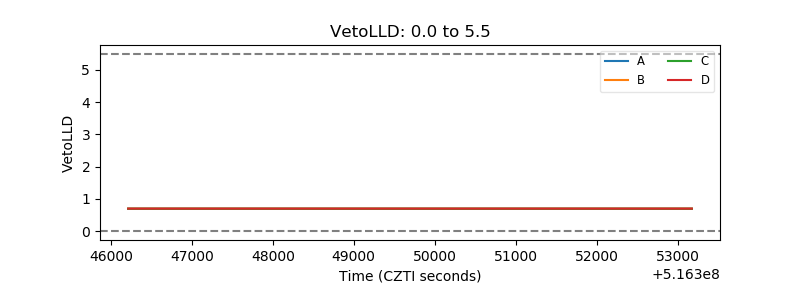 |
| Alpha Counter | 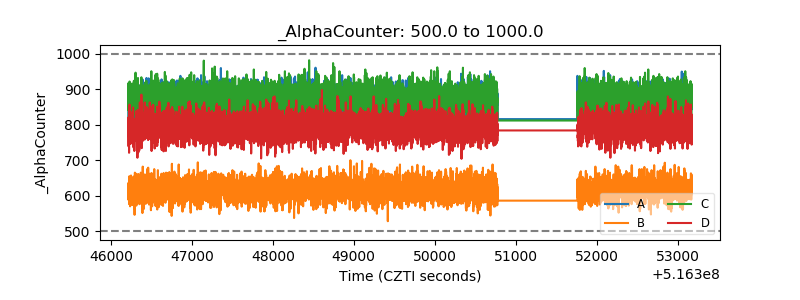 |
| _CPM_Rate | 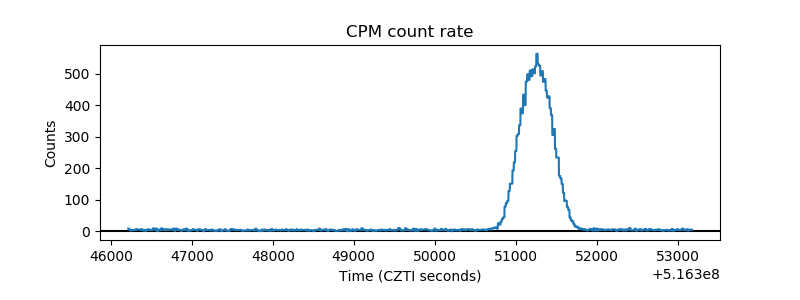 |
| CZT Counter | 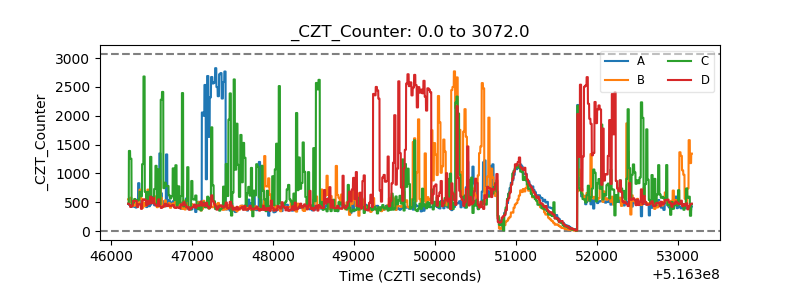 |
| +2.5 Volts monitor | 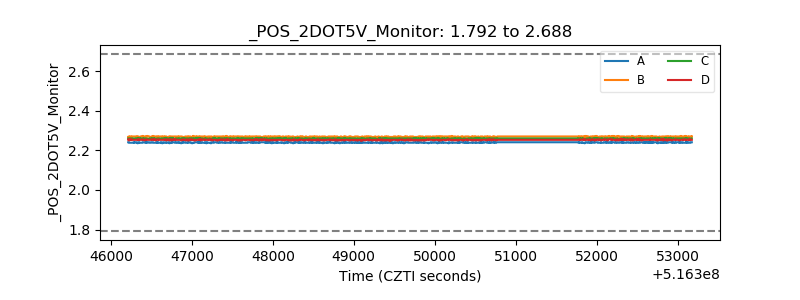 |
| +5 Volts monitor |  |
| _ROLL_ROT | 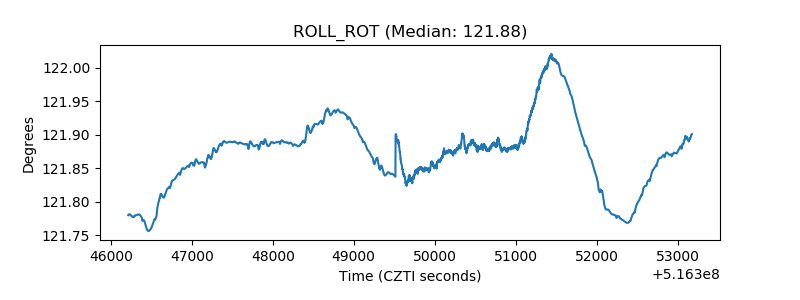 |
| _Roll_DEC | 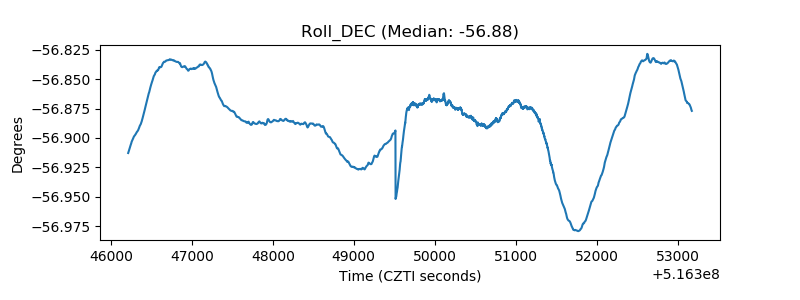 |
| _Roll_RA | 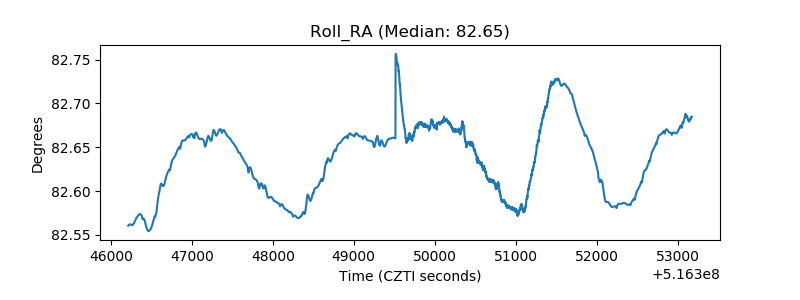 |
| Veto Counter | 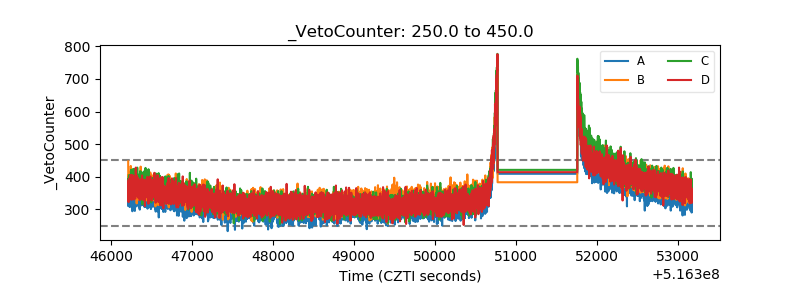 |