| Param | Original file | Final file |
|---|---|---|
| Filename | modeM0/AS1A14_113T09_9000006574_57480cztM0_level2.fits | modeM0/AS1A14_113T09_9000006574_57480cztM0_level2_quad_clean.evt |
| Size (bytes) | 466,344,000 | 96,022,080 |
| Size | 444.7 MB | 91.6 MB |
| Events in quadrant A | 2,899,675 | 650,064 |
| Events in quadrant B | 4,173,872 | 672,730 |
| Events in quadrant C | 4,921,287 | 594,257 |
| Events in quadrant D | 4,768,801 | 542,412 |
| Mode SS | |||
|---|---|---|---|
| Quadrant | BADHDUFLAG | Total packets | Discarded packets |
| A | 0 | 132 | 0 |
| B | 0 | 132 | 0 |
| C | 0 | 132 | 0 |
| D | 0 | 132 | 0 |
| Mode M9 | |||
|---|---|---|---|
| Quadrant | BADHDUFLAG | Total packets | Discarded packets |
| A | 0 | 11 | 0 |
| B | 0 | 11 | 0 |
| C | 0 | 11 | 0 |
| D | 0 | 11 | 0 |
| Mode M0 | |||
|---|---|---|---|
| Quadrant | BADHDUFLAG | Total packets | Discarded packets |
| A | 0 | 13195 | 1 |
| B | 0 | 16653 | 1 |
| C | 0 | 19155 | 4 |
| D | 0 | 18531 | 1 |
| Quadrant | Total seconds | Saturated seconds | Saturation percentage |
|---|---|---|---|
| A | 6416 | 61 | 0.950748% |
| B | 6417 | 361 | 5.625682% |
| C | 6416 | 436 | 6.795511% |
| D | 6416 | 568 | 8.852868% |
Noise dominated data is calculated using 1-second bins in cleaned event files. If a bin has >2000 counts, and if more than 50% of those come from <1% of pixels, then it is considered to be noise-dominated and hence unusable.
| Quadrant | # 1 sec bins | Bins with >0 counts | Bins with >2000 counts | High rate bins dominated by noise | Noise dominated (total time) | Noise dominated (detector-on time) | Marked lightcurve |
|---|---|---|---|---|---|---|---|
| A | 7566 | 6416 | 2 | 2 | 0.03% | 0.03% | 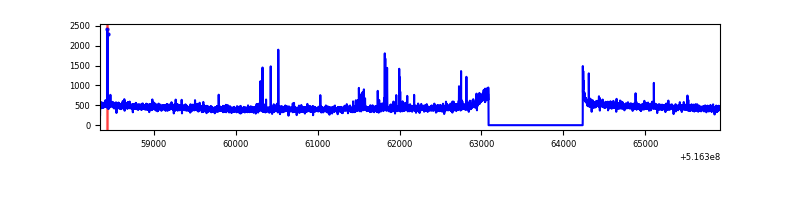 |
| B | 7567 | 6417 | 204 | 204 | 2.70% | 3.18% | 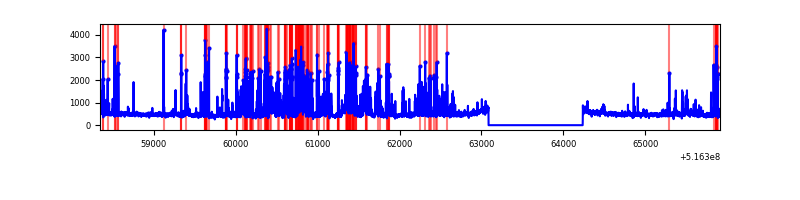 |
| C | 7566 | 6417 | 340 | 340 | 4.49% | 5.30% | 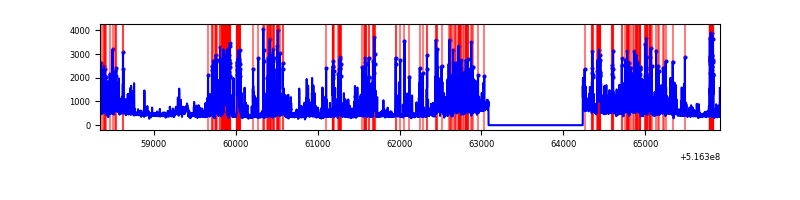 |
| D | 7566 | 6417 | 470 | 470 | 6.21% | 7.32% | 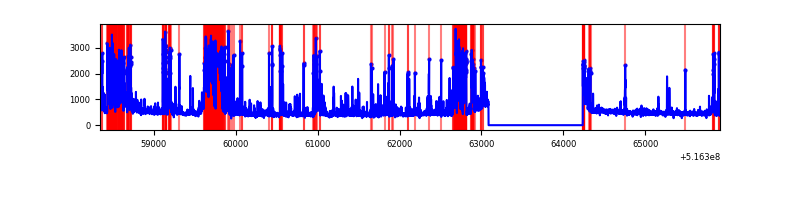 |
Top three noisy pixels from each quadrant. If the there are fewer than three noisy pixels in the level2.evt file, extra rows are filled as -1
| Pixel properties | Quadrant properties | ||||||
|---|---|---|---|---|---|---|---|
| Quadrant | DetID | PixID | Counts | Sigma | Mean | Median | Sigma |
| A | 10 | 251 | 55818 | 307.43 | 724 | 706 | 179.3 |
| A | 4 | 3 | 15115 | 80.38 | 724 | 706 | 179.3 |
| A | 7 | 14 | 13567 | 71.74 | 724 | 706 | 179.3 |
| B | 4 | 206 | 1085183 | 7397.98 | 692 | 667 | 146.6 |
| B | 5 | 185 | 93142 | 630.81 | 692 | 667 | 146.6 |
| B | 0 | 245 | 54340 | 366.13 | 692 | 667 | 146.6 |
| C | 15 | 224 | 1840935 | 9967.54 | 679 | 673 | 184.6 |
| C | 14 | 254 | 157298 | 848.34 | 679 | 673 | 184.6 |
| C | 12 | 2 | 124257 | 669.38 | 679 | 673 | 184.6 |
| D | 2 | 249 | 1210796 | 6328.59 | 677 | 647 | 191.2 |
| D | 15 | 142 | 391981 | 2046.52 | 677 | 647 | 191.2 |
| D | 8 | 240 | 140782 | 732.85 | 677 | 647 | 191.2 |
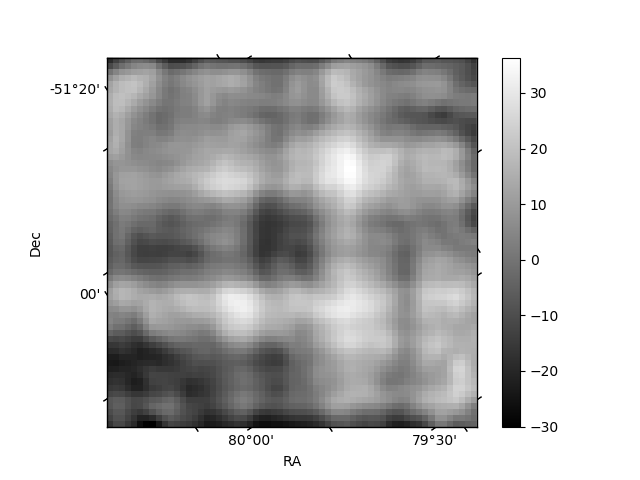
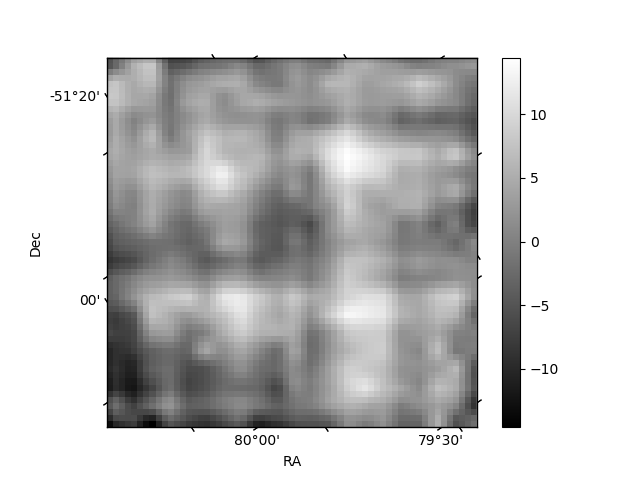
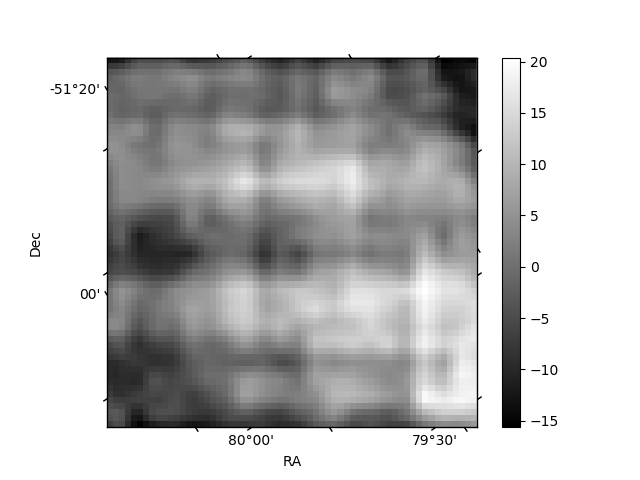
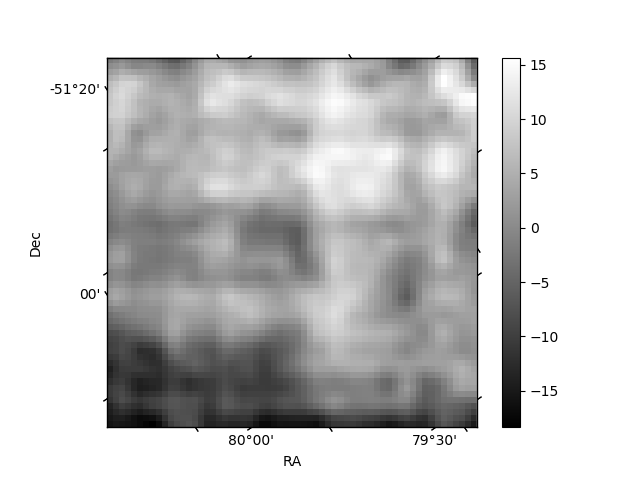
Histogram calculated using DETX and DETY for each event in the final _common_clean file
| Quadrant A | 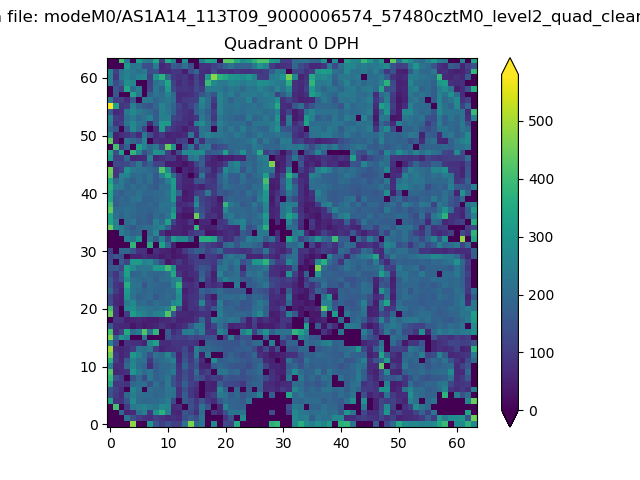 |
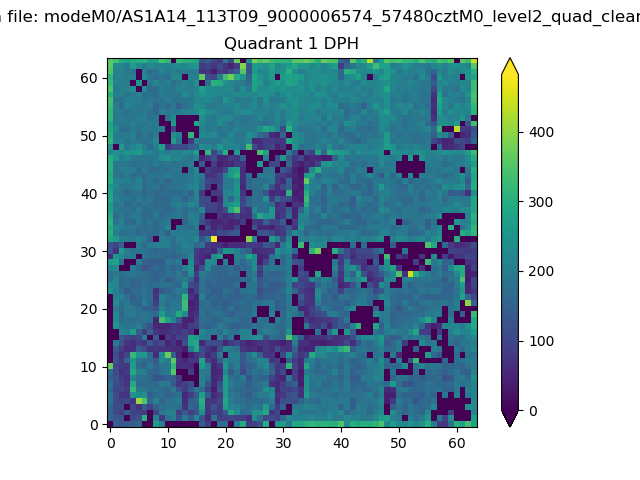 |
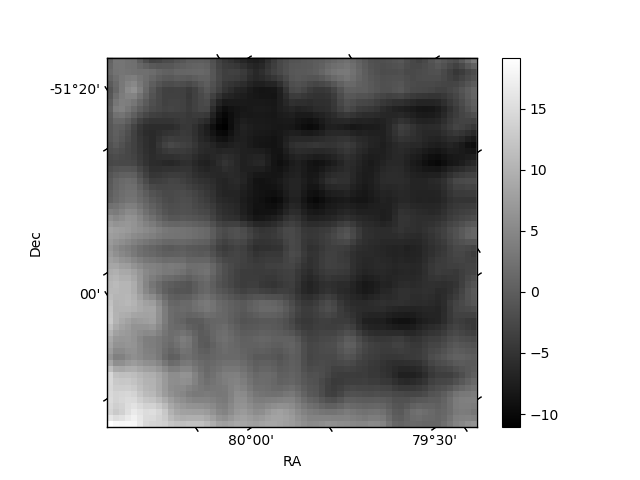
Quadrant B |
|---|---|---|---|
| Quadrant D | 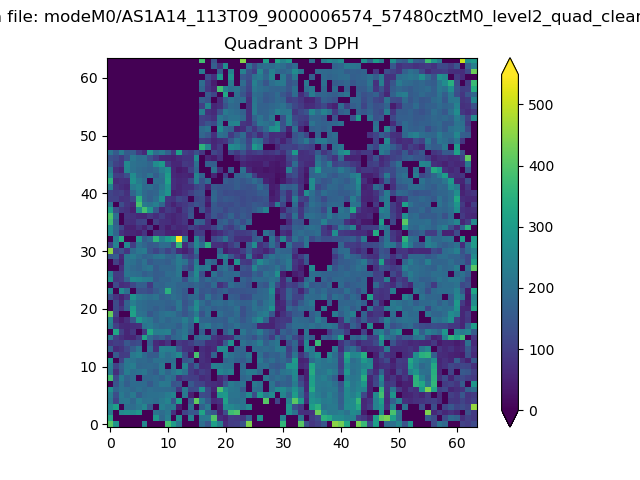 |
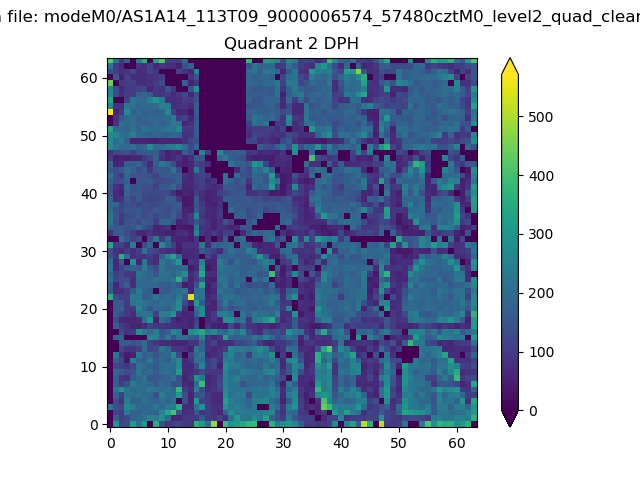 |
Quadrant C |
| Plot type | Count rate plots | Images |
|---|---|---|
| Comparison with Poisson distribution Blue bars denote a histogram of data divided into 1 sec bins. Red curve is a Poisson curve with rate = median count rate of data. |
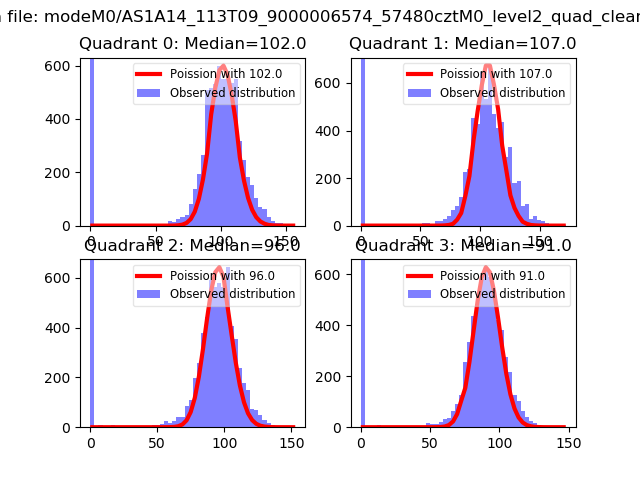 |
 |
| Quadrant-wise count rates Data is divided into 100 sec bins |
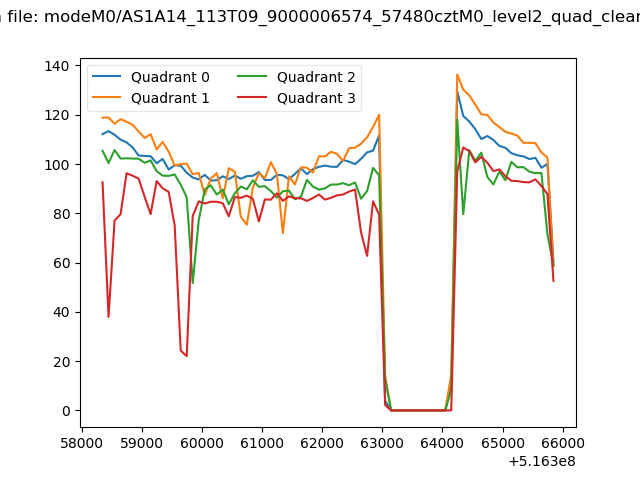 |
|
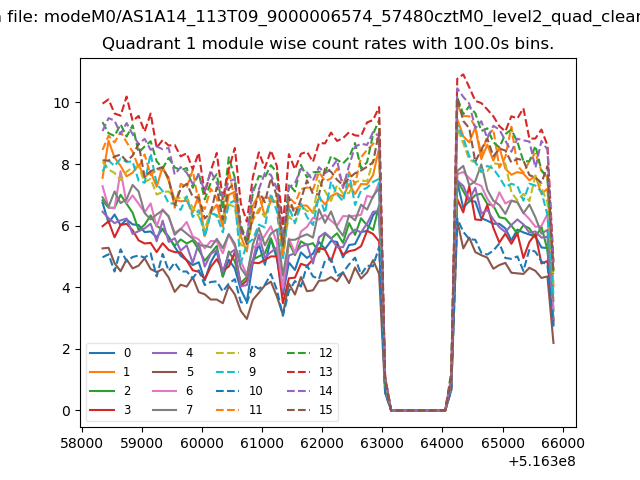
| Module-wise count rates for Quadrant A Data is divided into 100 sec bins |
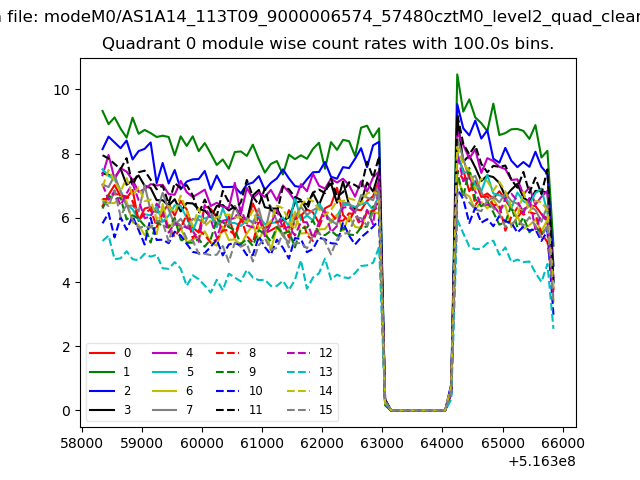 |
 |
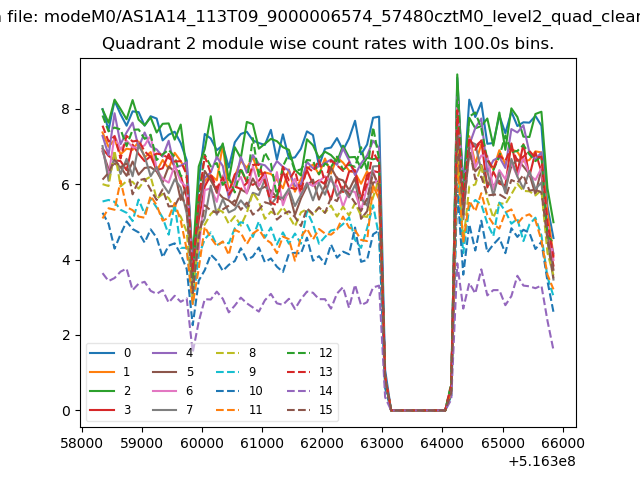
| Module-wise count rates for Quadrant B Data is divided into 100 sec bins |
 |
 |
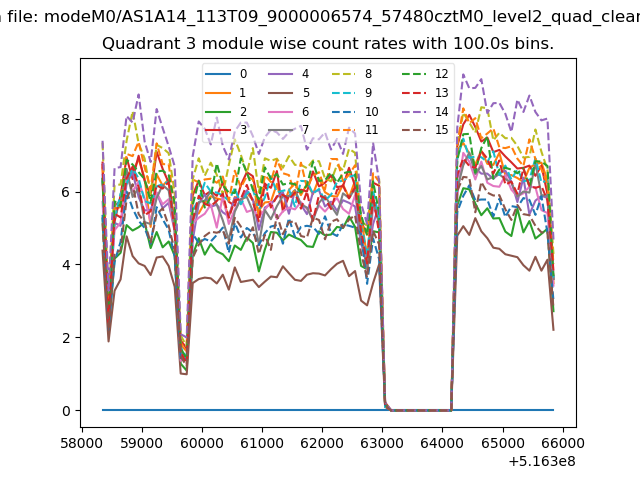
| Module-wise count rates for Quadrant C Data is divided into 100 sec bins |
 |
 |
| Module-wise count rates for Quadrant D Data is divided into 100 sec bins |
 |
 |
| Parameter | Plot |
|---|---|
| CZT HV Monitor | 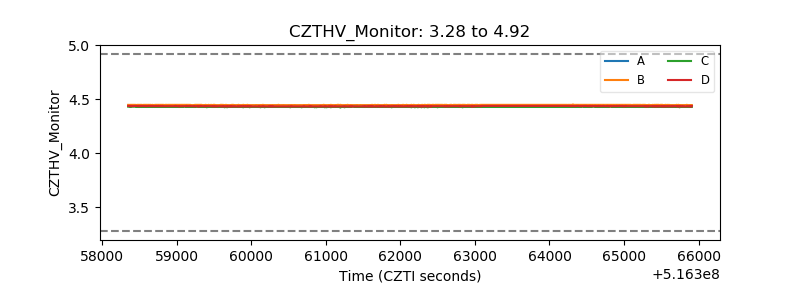 |
| D_VDD | 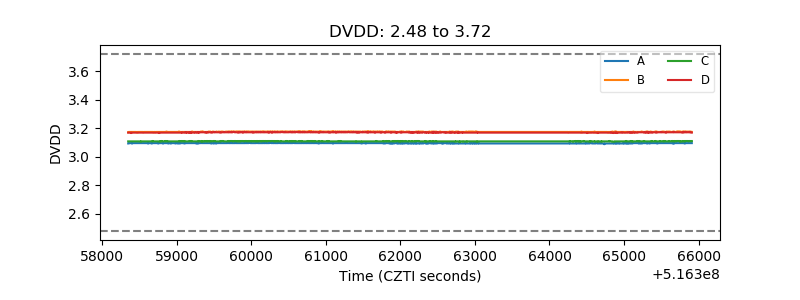 |
| Temperature 1 | 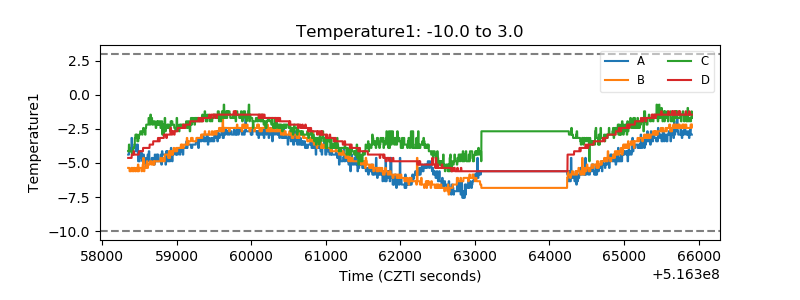 |
| Veto HV Monitor | 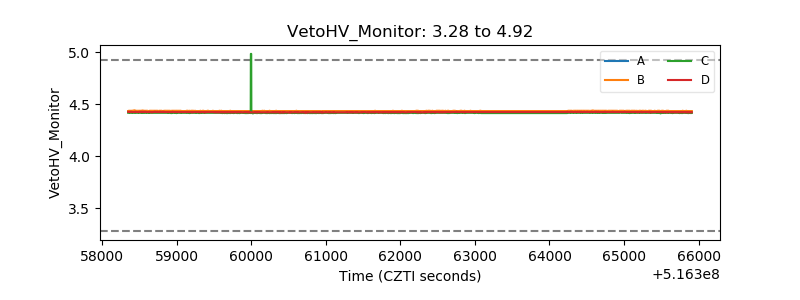 |
| Veto LLD | 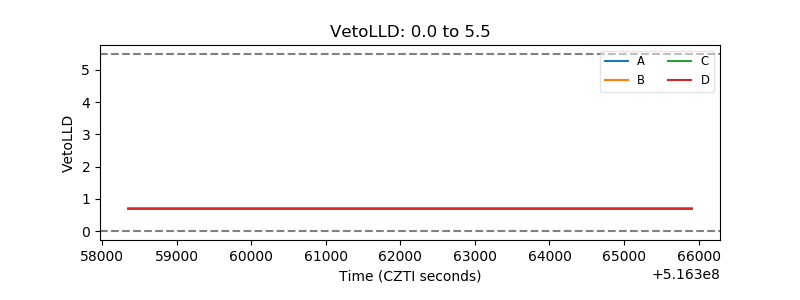 |
| Alpha Counter | 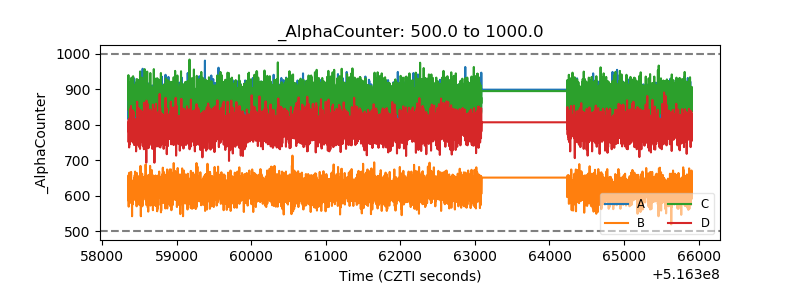 |
| _CPM_Rate | 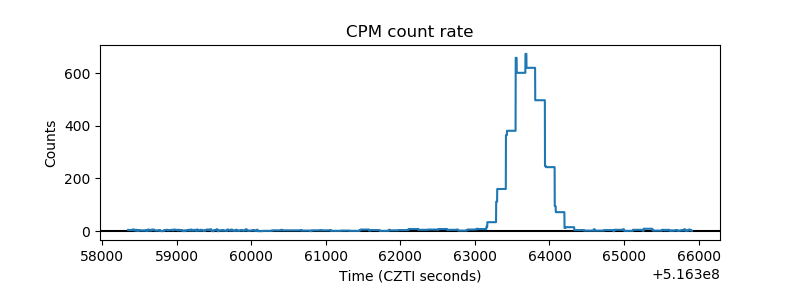 |
| CZT Counter | 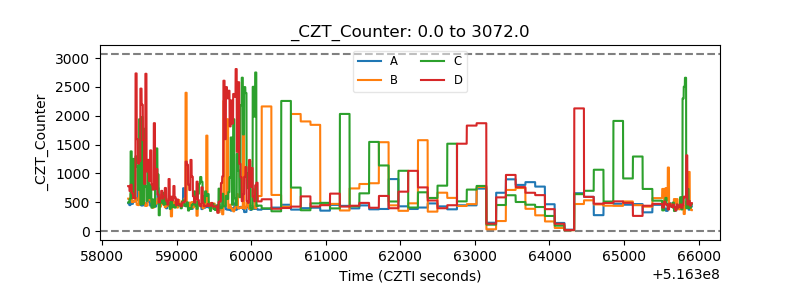 |
| +2.5 Volts monitor |  |
| +5 Volts monitor |  |
| _ROLL_ROT | 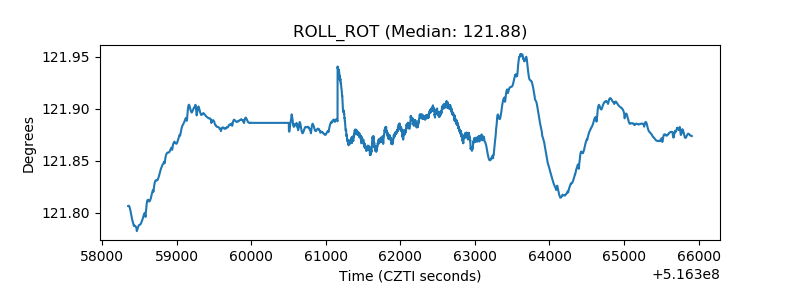 |
| _Roll_DEC | 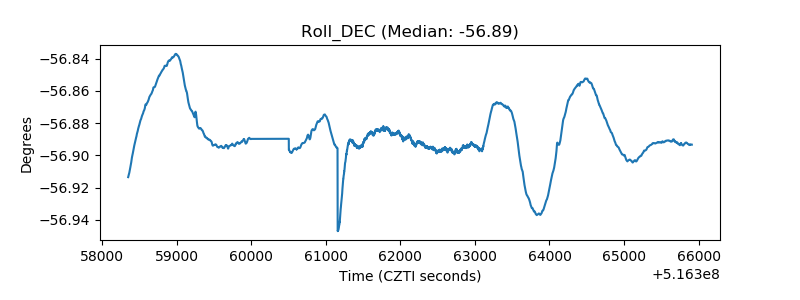 |
| _Roll_RA | 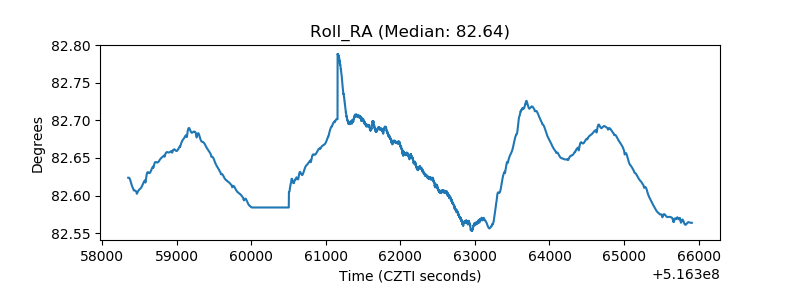 |
| Veto Counter | 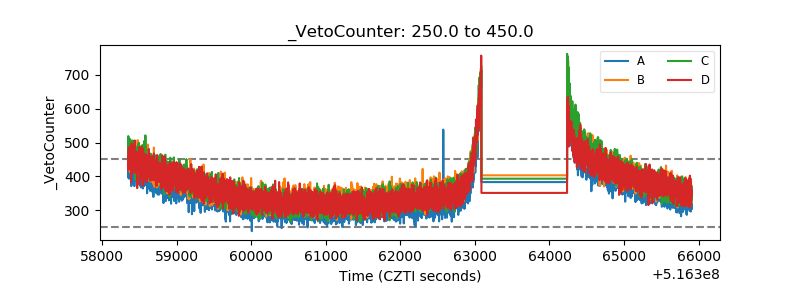 |