| Param | Original file | Final file |
|---|---|---|
| Filename | modeM0/AS1A14_113T09_9000006574_57481cztM0_level2.fits | modeM0/AS1A14_113T09_9000006574_57481cztM0_level2_quad_clean.evt |
| Size (bytes) | 474,278,400 | 95,394,240 |
| Size | 452.3 MB | 91.0 MB |
| Events in quadrant A | 2,951,056 | 647,377 |
| Events in quadrant B | 3,782,447 | 671,750 |
| Events in quadrant C | 5,111,006 | 583,856 |
| Events in quadrant D | 5,210,601 | 535,663 |
| Mode SS | |||
|---|---|---|---|
| Quadrant | BADHDUFLAG | Total packets | Discarded packets |
| A | 0 | 132 | 0 |
| B | 0 | 132 | 0 |
| C | 0 | 132 | 0 |
| D | 0 | 132 | 0 |
| Mode M9 | |||
|---|---|---|---|
| Quadrant | BADHDUFLAG | Total packets | Discarded packets |
| A | 0 | 11 | 0 |
| B | 0 | 11 | 0 |
| C | 0 | 11 | 0 |
| D | 0 | 11 | 0 |
| Mode M0 | |||
|---|---|---|---|
| Quadrant | BADHDUFLAG | Total packets | Discarded packets |
| A | 0 | 13448 | 1 |
| B | 0 | 15537 | 1 |
| C | 0 | 19727 | 1 |
| D | 0 | 19822 | 1 |
| Quadrant | Total seconds | Saturated seconds | Saturation percentage |
|---|---|---|---|
| A | 6445 | 93 | 1.442979% |
| B | 6446 | 272 | 4.219671% |
| C | 6446 | 512 | 7.942910% |
| D | 6446 | 665 | 10.316475% |
Noise dominated data is calculated using 1-second bins in cleaned event files. If a bin has >2000 counts, and if more than 50% of those come from <1% of pixels, then it is considered to be noise-dominated and hence unusable.
| Quadrant | # 1 sec bins | Bins with >0 counts | Bins with >2000 counts | High rate bins dominated by noise | Noise dominated (total time) | Noise dominated (detector-on time) | Marked lightcurve |
|---|---|---|---|---|---|---|---|
| A | 7550 | 6445 | 11 | 11 | 0.15% | 0.17% | 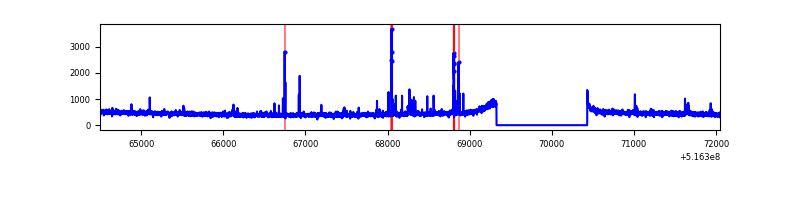 |
| B | 7551 | 6446 | 101 | 101 | 1.34% | 1.57% | 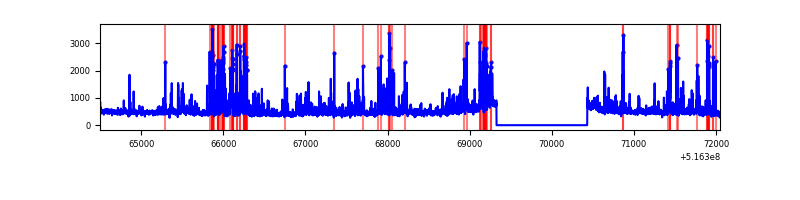 |
| C | 7551 | 6446 | 421 | 421 | 5.58% | 6.53% | 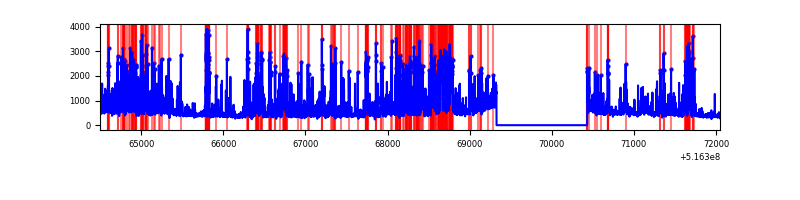 |
| D | 7551 | 6446 | 593 | 593 | 7.85% | 9.20% | 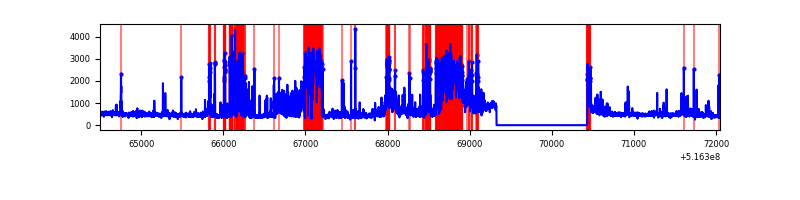 |
Top three noisy pixels from each quadrant. If the there are fewer than three noisy pixels in the level2.evt file, extra rows are filled as -1
| Pixel properties | Quadrant properties | ||||||
|---|---|---|---|---|---|---|---|
| Quadrant | DetID | PixID | Counts | Sigma | Mean | Median | Sigma |
| A | 10 | 251 | 102331 | 563.43 | 727 | 707 | 180.4 |
| A | 13 | 153 | 14278 | 75.24 | 727 | 707 | 180.4 |
| A | 4 | 3 | 10691 | 55.35 | 727 | 707 | 180.4 |
| B | 4 | 206 | 474571 | 3226.94 | 696 | 671 | 146.9 |
| B | 2 | 249 | 210421 | 1428.25 | 696 | 671 | 146.9 |
| B | 5 | 185 | 90956 | 614.78 | 696 | 671 | 146.9 |
| C | 15 | 224 | 1999934 | 10958.22 | 671 | 665 | 182.4 |
| C | 14 | 254 | 182599 | 997.2 | 671 | 665 | 182.4 |
| C | 12 | 2 | 133260 | 726.77 | 671 | 665 | 182.4 |
| D | 15 | 142 | 940987 | 4890.92 | 680 | 650 | 192.3 |
| D | 7 | 96 | 924368 | 4804.48 | 680 | 650 | 192.3 |
| D | 2 | 249 | 328686 | 1706.2 | 680 | 650 | 192.3 |
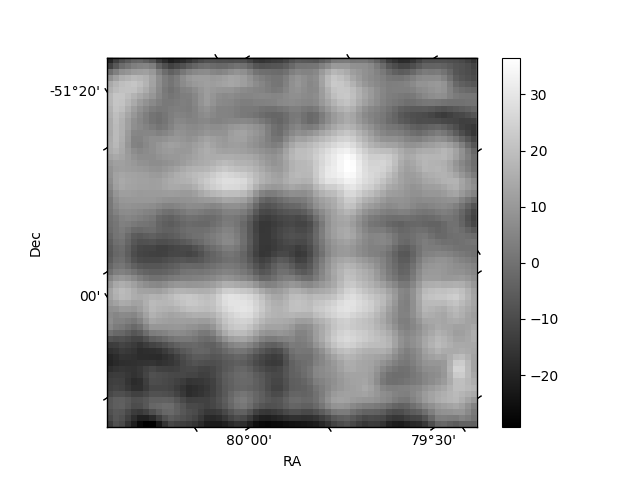
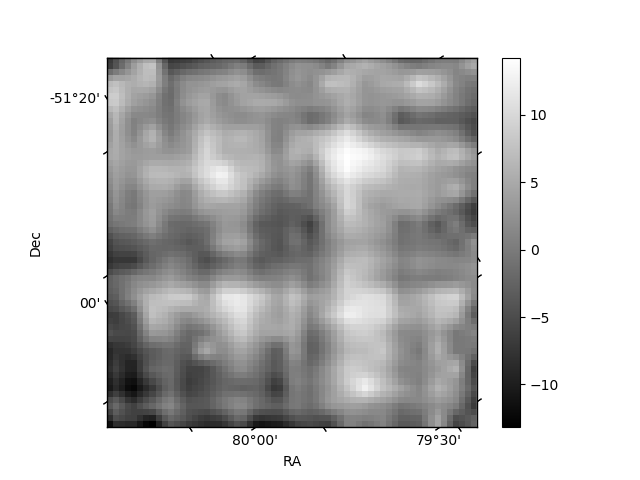
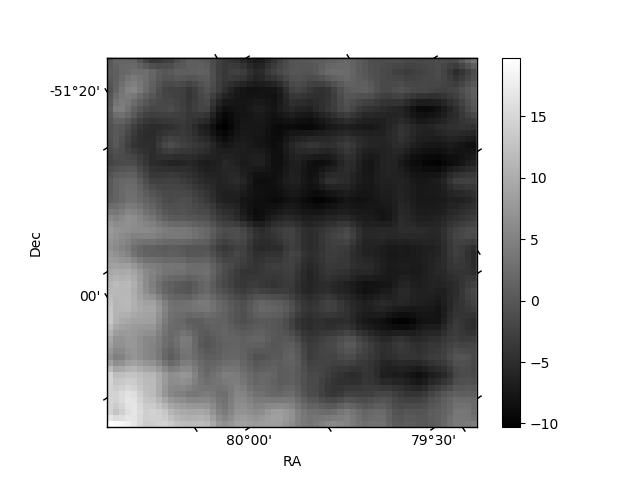
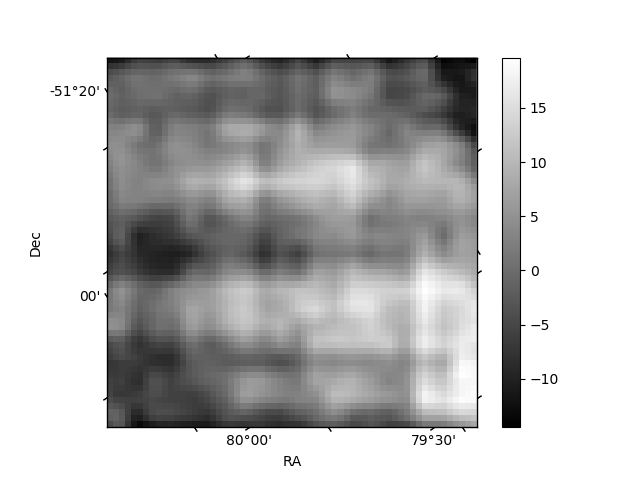
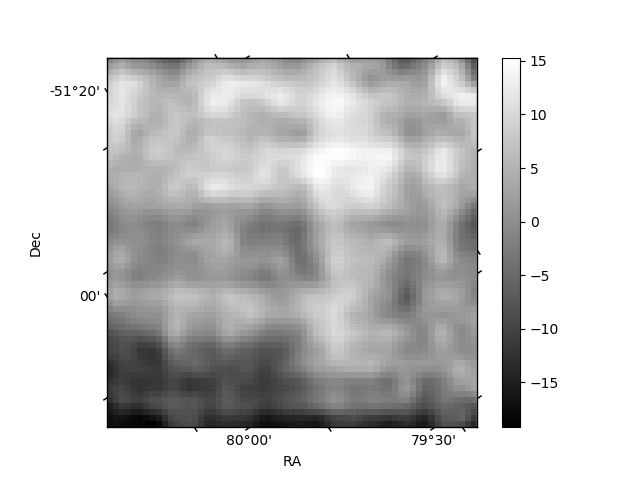
Histogram calculated using DETX and DETY for each event in the final _common_clean file
| Quadrant A | 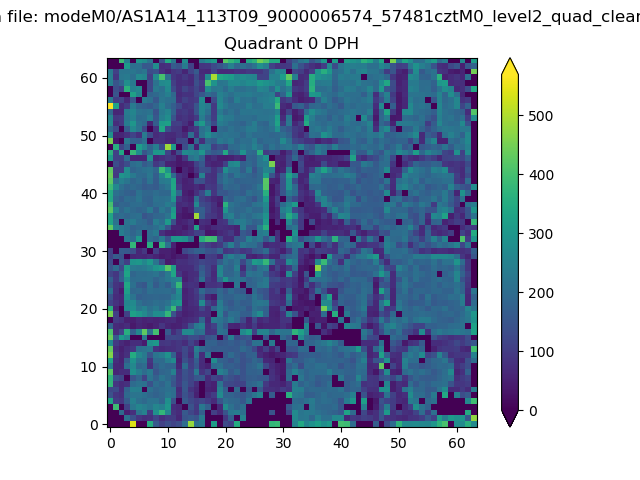 |
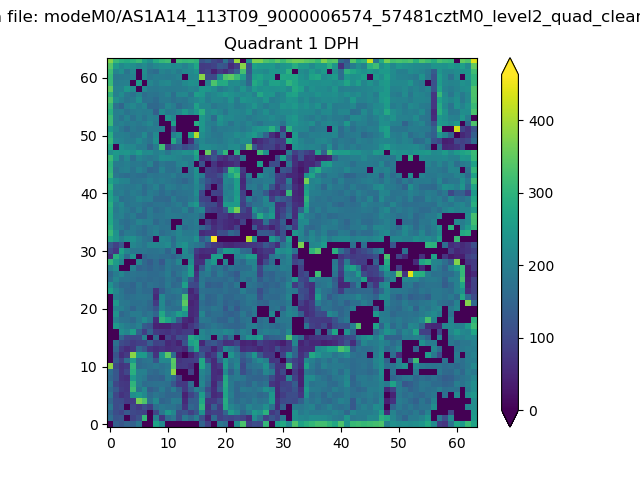 |
Quadrant B |
|---|---|---|---|
| Quadrant D | 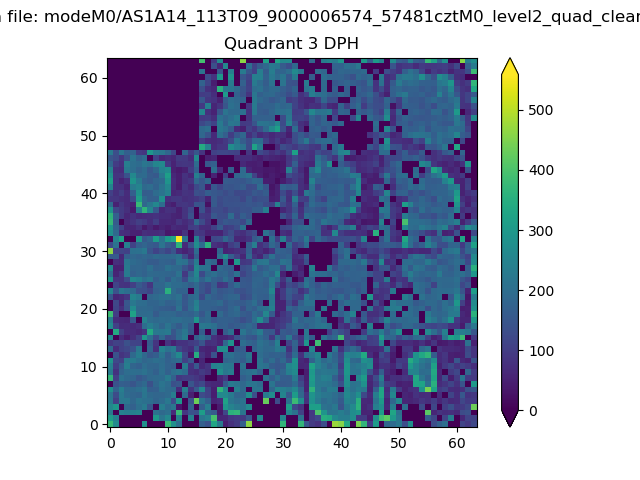 |
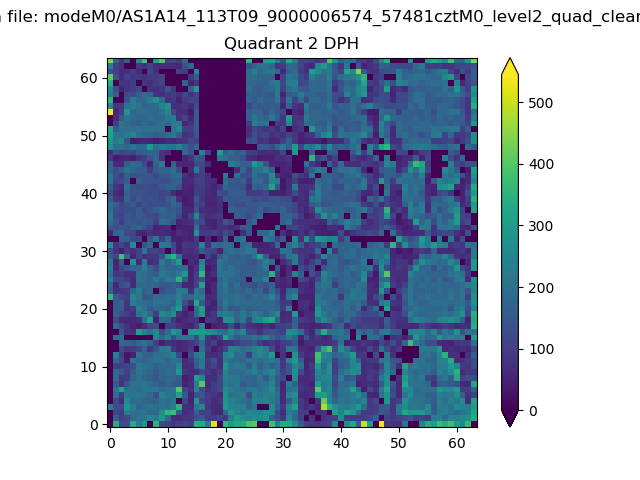 |
Quadrant C |
| Plot type | Count rate plots | Images |
|---|---|---|
| Comparison with Poisson distribution Blue bars denote a histogram of data divided into 1 sec bins. Red curve is a Poisson curve with rate = median count rate of data. |
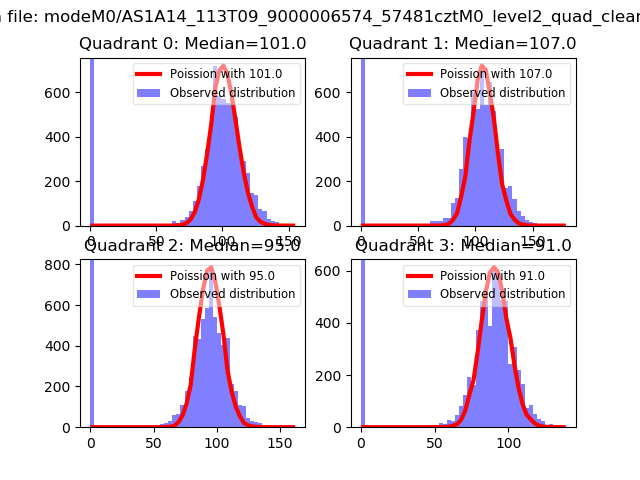 |
 |
| Quadrant-wise count rates Data is divided into 100 sec bins |
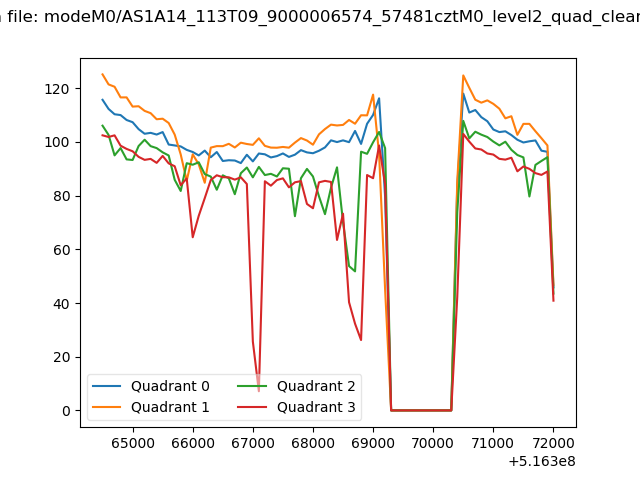 |
|
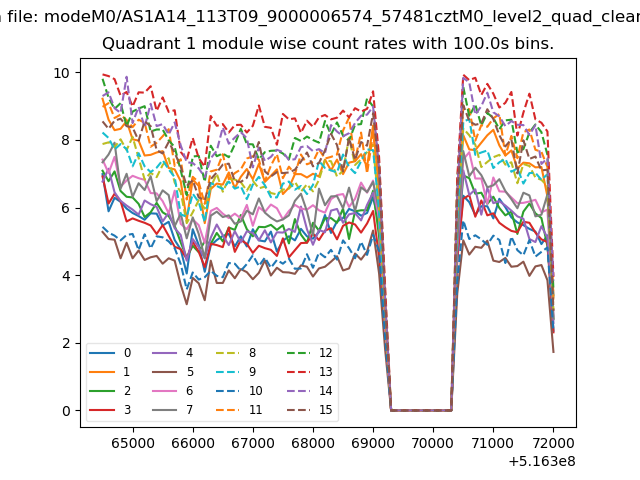
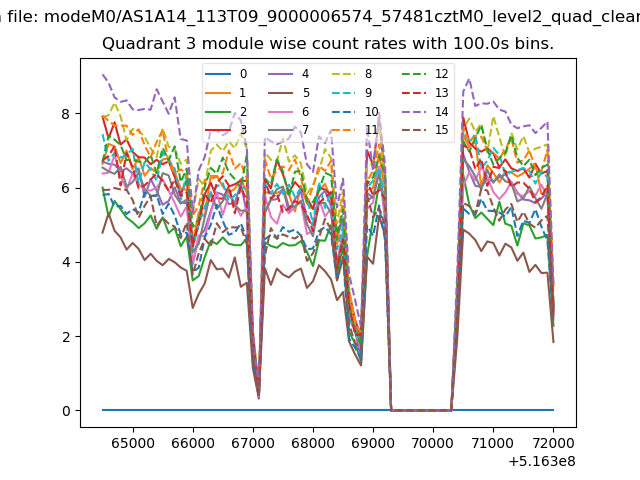
| Module-wise count rates for Quadrant A Data is divided into 100 sec bins |
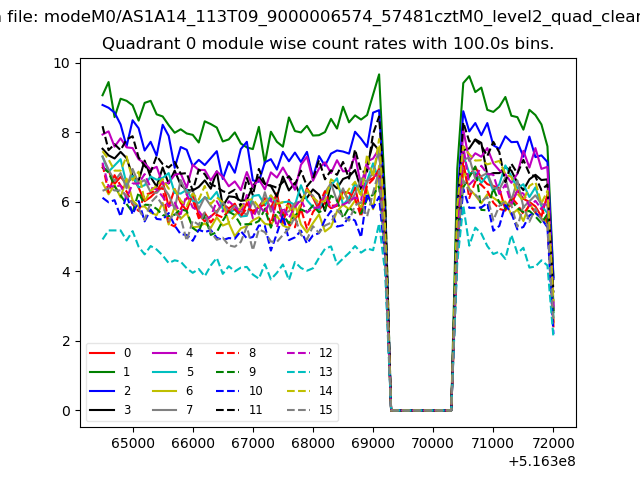 |
 |
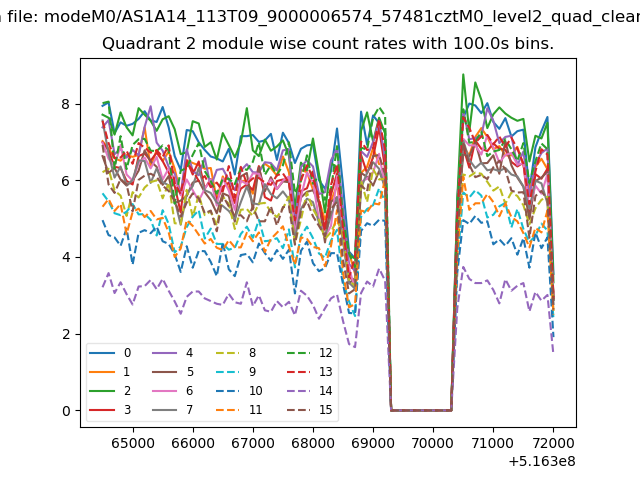
| Module-wise count rates for Quadrant B Data is divided into 100 sec bins |
 |
 |
| Module-wise count rates for Quadrant C Data is divided into 100 sec bins |
 |
 |
| Module-wise count rates for Quadrant D Data is divided into 100 sec bins |
 |
 |
| Parameter | Plot |
|---|---|
| CZT HV Monitor | 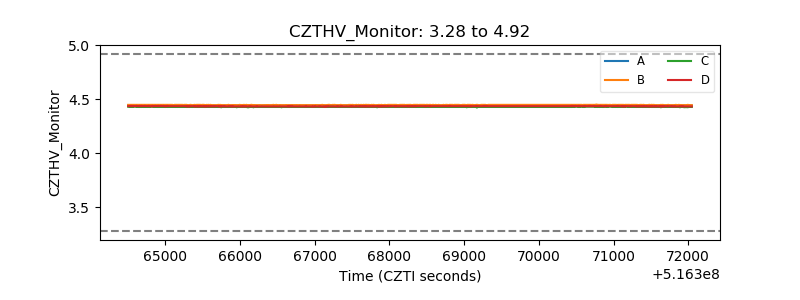 |
| D_VDD | 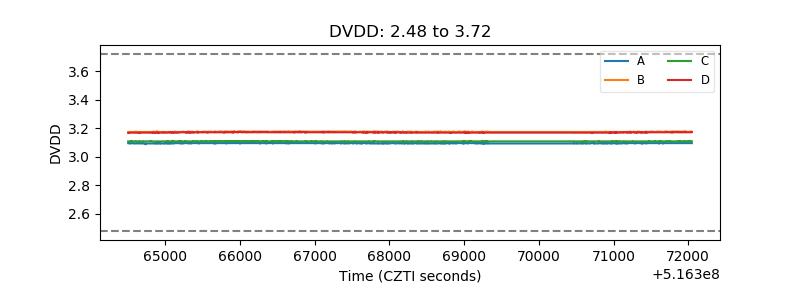 |
| Temperature 1 | 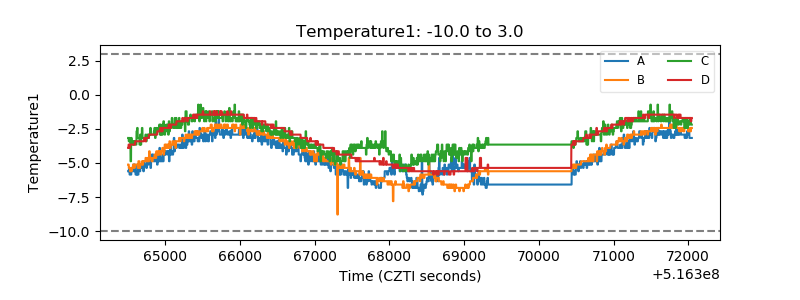 |
| Veto HV Monitor |  |
| Veto LLD | 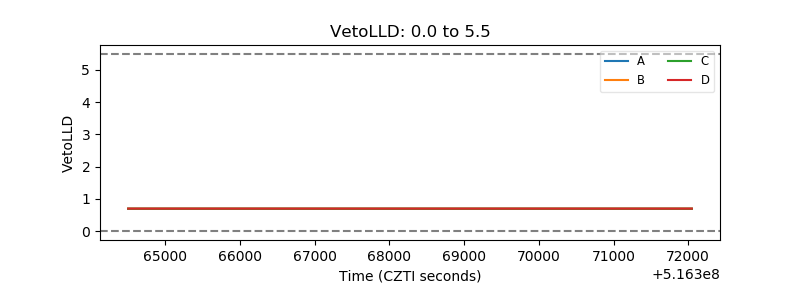 |
| Alpha Counter | 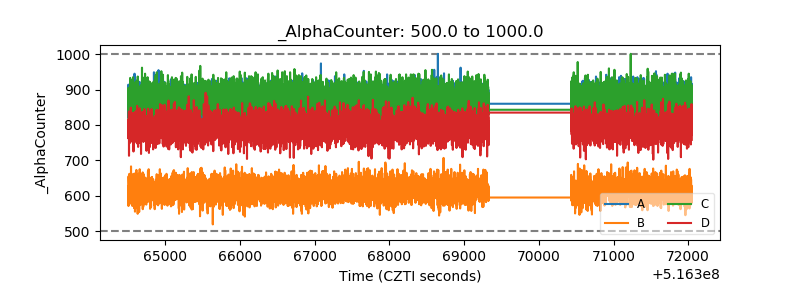 |
| _CPM_Rate | 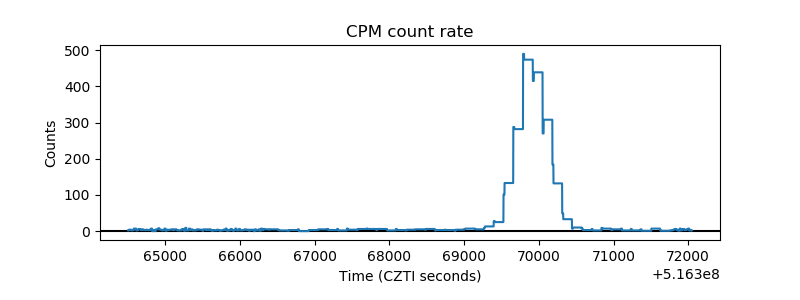 |
| CZT Counter | 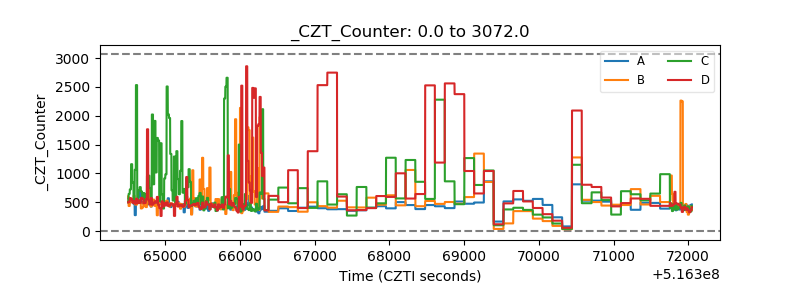 |
| +2.5 Volts monitor | 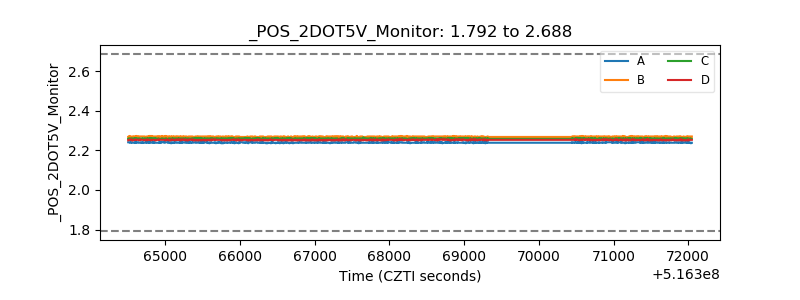 |
| +5 Volts monitor |  |
| _ROLL_ROT | 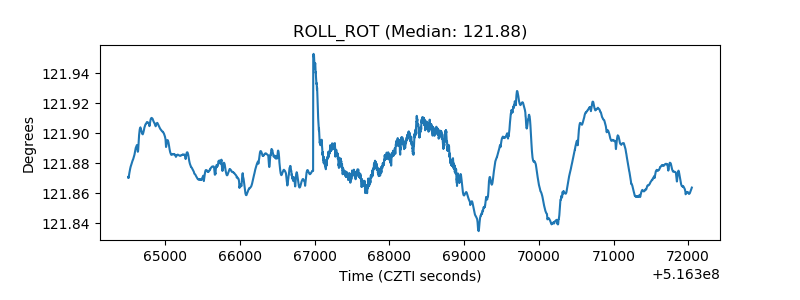 |
| _Roll_DEC | 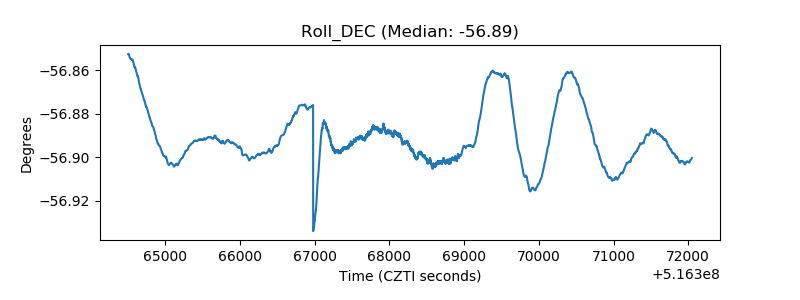 |
| _Roll_RA | 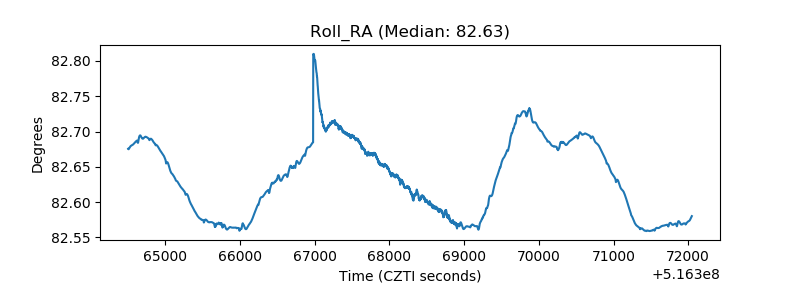 |
| Veto Counter | 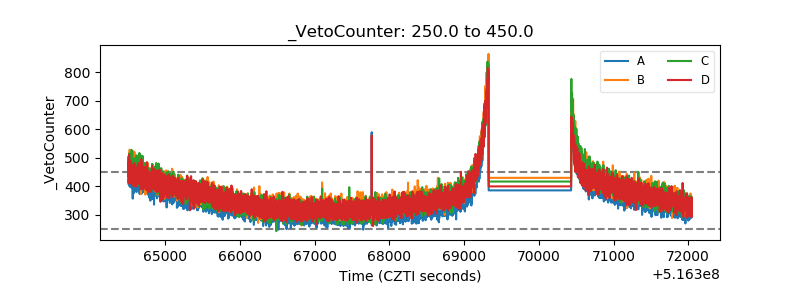 |