| Param | Original file | Final file |
|---|---|---|
| Filename | modeM0/AS1A14_113T09_9000006574_57482cztM0_level2.fits | modeM0/AS1A14_113T09_9000006574_57482cztM0_level2_quad_clean.evt |
| Size (bytes) | 400,596,480 | 99,043,200 |
| Size | 382.0 MB | 94.5 MB |
| Events in quadrant A | 2,930,062 | 652,585 |
| Events in quadrant B | 3,553,150 | 688,618 |
| Events in quadrant C | 4,311,210 | 608,114 |
| Events in quadrant D | 3,517,550 | 586,921 |
| Mode SS | |||
|---|---|---|---|
| Quadrant | BADHDUFLAG | Total packets | Discarded packets |
| A | 0 | 134 | 0 |
| B | 0 | 134 | 0 |
| C | 0 | 134 | 0 |
| D | 0 | 134 | 0 |
| Mode M9 | |||
|---|---|---|---|
| Quadrant | BADHDUFLAG | Total packets | Discarded packets |
| A | 0 | 11 | 0 |
| B | 0 | 11 | 0 |
| C | 0 | 11 | 0 |
| D | 0 | 11 | 0 |
| Mode M0 | |||
|---|---|---|---|
| Quadrant | BADHDUFLAG | Total packets | Discarded packets |
| A | 0 | 13652 | 1 |
| B | 0 | 15108 | 1 |
| C | 0 | 17672 | 1 |
| D | 0 | 15089 | 1 |
| Quadrant | Total seconds | Saturated seconds | Saturation percentage |
|---|---|---|---|
| A | 6641 | 83 | 1.249812% |
| B | 6642 | 151 | 2.273412% |
| C | 6642 | 267 | 4.019874% |
| D | 6642 | 108 | 1.626016% |
Noise dominated data is calculated using 1-second bins in cleaned event files. If a bin has >2000 counts, and if more than 50% of those come from <1% of pixels, then it is considered to be noise-dominated and hence unusable.
| Quadrant | # 1 sec bins | Bins with >0 counts | Bins with >2000 counts | High rate bins dominated by noise | Noise dominated (total time) | Noise dominated (detector-on time) | Marked lightcurve |
|---|---|---|---|---|---|---|---|
| A | 7666 | 6641 | 2 | 2 | 0.03% | 0.03% | 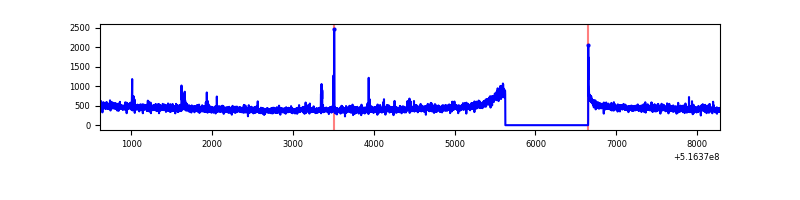 |
| B | 7667 | 6642 | 46 | 46 | 0.60% | 0.69% | 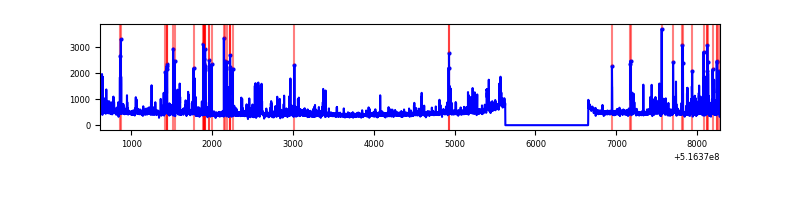 |
| C | 7667 | 6643 | 204 | 204 | 2.66% | 3.07% | 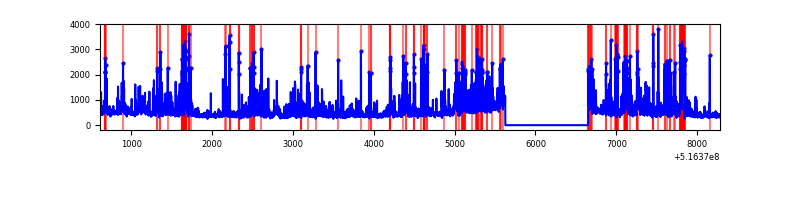 |
| D | 7667 | 6643 | 62 | 62 | 0.81% | 0.93% | 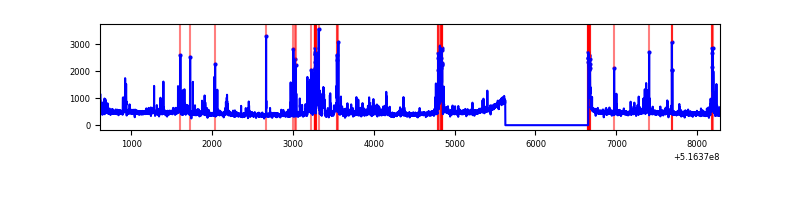 |
Top three noisy pixels from each quadrant. If the there are fewer than three noisy pixels in the level2.evt file, extra rows are filled as -1
| Pixel properties | Quadrant properties | ||||||
|---|---|---|---|---|---|---|---|
| Quadrant | DetID | PixID | Counts | Sigma | Mean | Median | Sigma |
| A | 3 | 14 | 22280 | 119.32 | 737 | 718 | 180.7 |
| A | 13 | 153 | 14466 | 76.08 | 737 | 718 | 180.7 |
| A | 4 | 3 | 12121 | 63.1 | 737 | 718 | 180.7 |
| B | 4 | 206 | 348679 | 2280.95 | 713 | 686 | 152.6 |
| B | 8 | 234 | 91509 | 595.31 | 713 | 686 | 152.6 |
| B | 5 | 185 | 47495 | 306.81 | 713 | 686 | 152.6 |
| C | 15 | 224 | 1078641 | 5691.98 | 693 | 686 | 189.4 |
| C | 14 | 254 | 196791 | 1035.5 | 693 | 686 | 189.4 |
| C | 6 | 223 | 95995 | 503.26 | 693 | 686 | 189.4 |
| D | 15 | 142 | 312092 | 1565.64 | 709 | 677 | 198.9 |
| D | 3 | 12 | 107039 | 534.74 | 709 | 677 | 198.9 |
| D | 2 | 62 | 68087 | 338.9 | 709 | 677 | 198.9 |
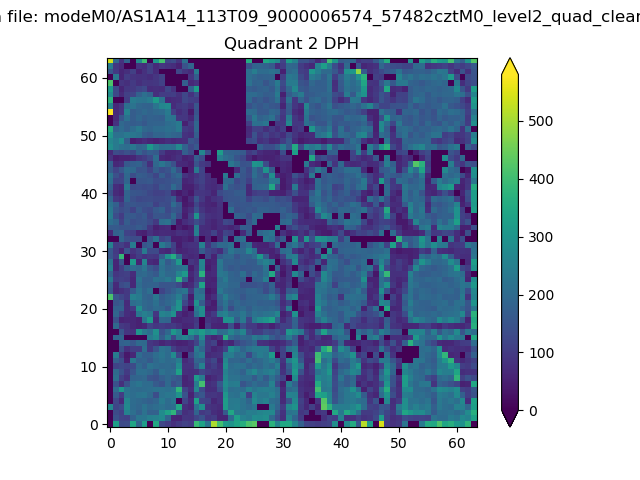
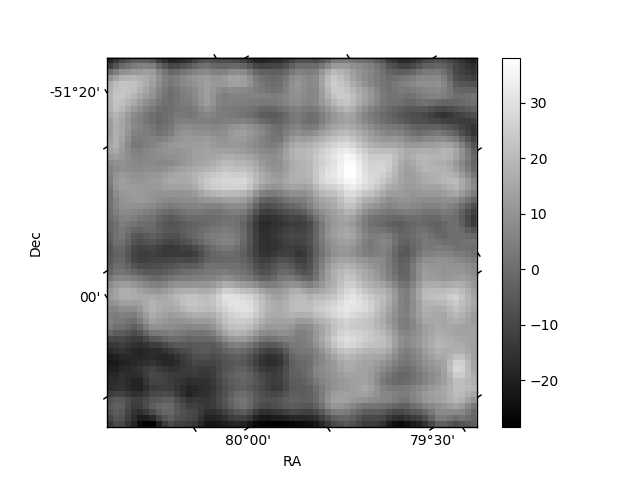
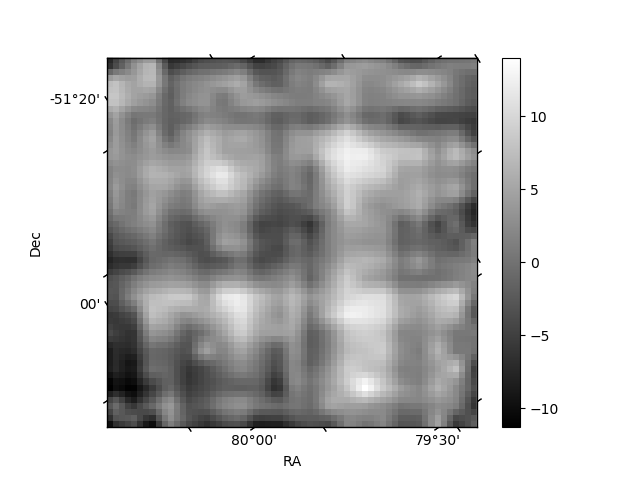
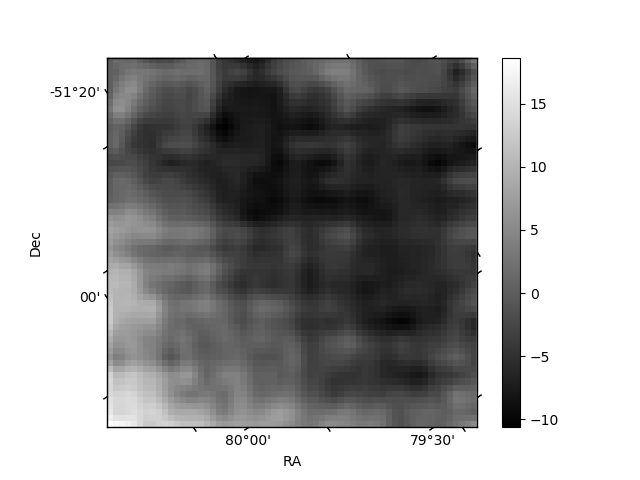
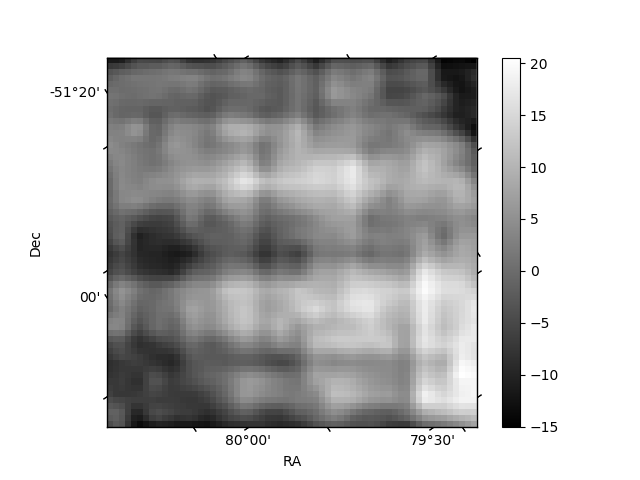
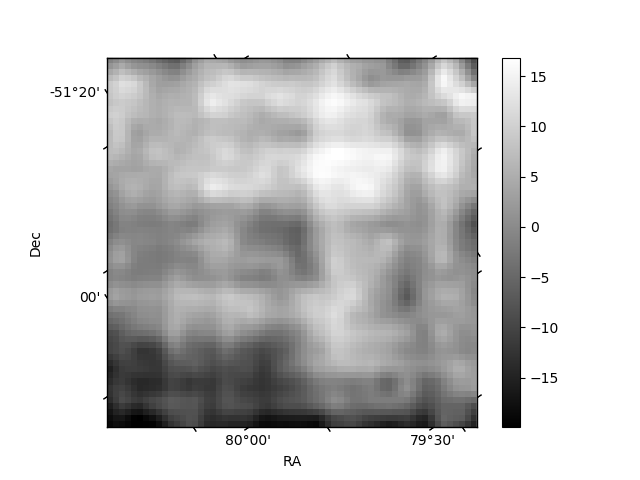
Histogram calculated using DETX and DETY for each event in the final _common_clean file
| Quadrant A | 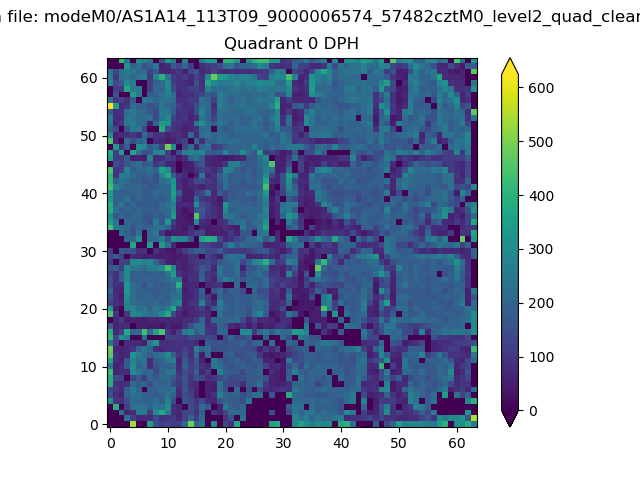 |
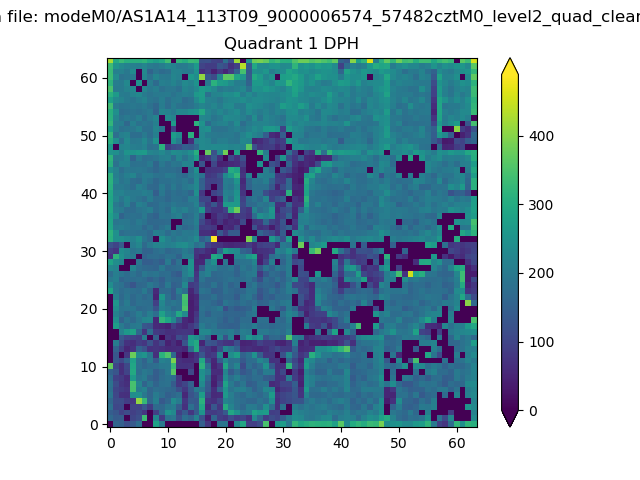 |
Quadrant B |
|---|---|---|---|
| Quadrant D | 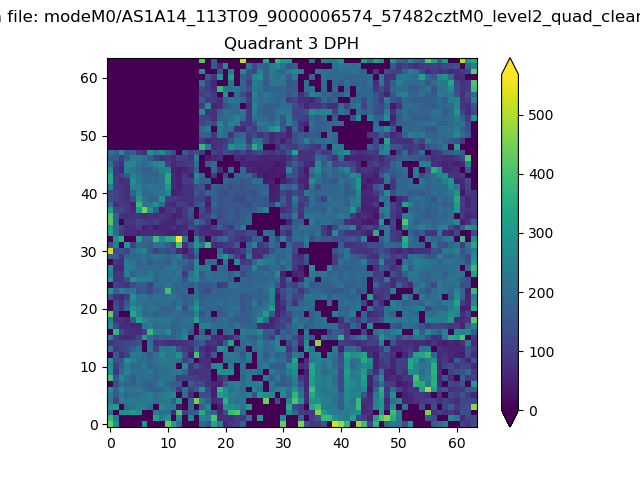 |
 |
Quadrant C |
| Plot type | Count rate plots | Images |
|---|---|---|
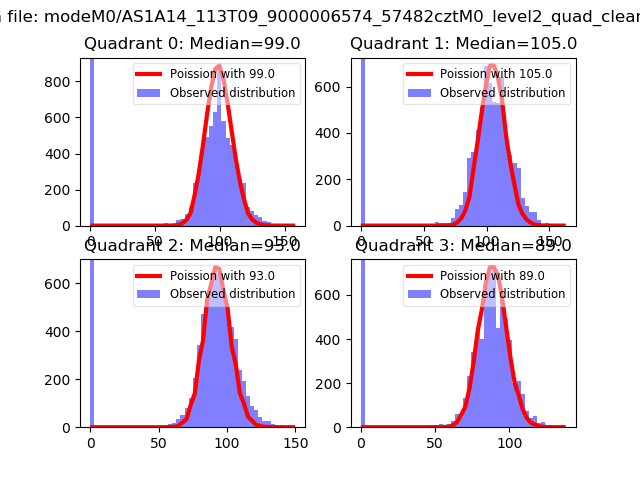
| Comparison with Poisson distribution Blue bars denote a histogram of data divided into 1 sec bins. Red curve is a Poisson curve with rate = median count rate of data. |
 |
 |
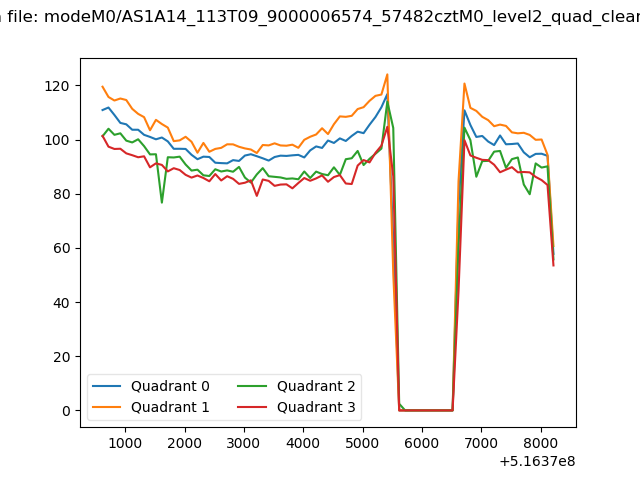
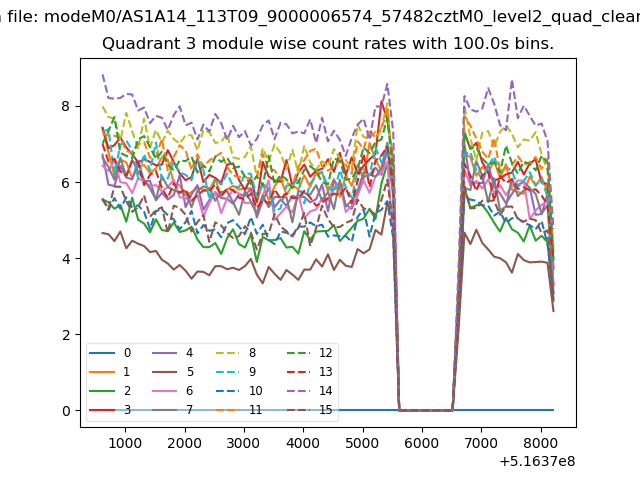
| Quadrant-wise count rates Data is divided into 100 sec bins |
 |
|
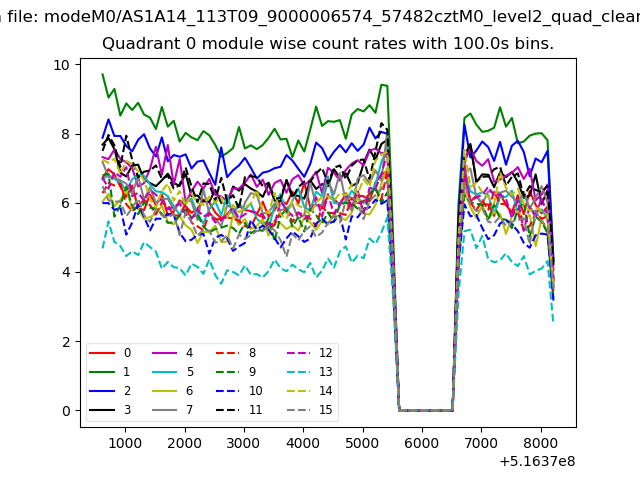
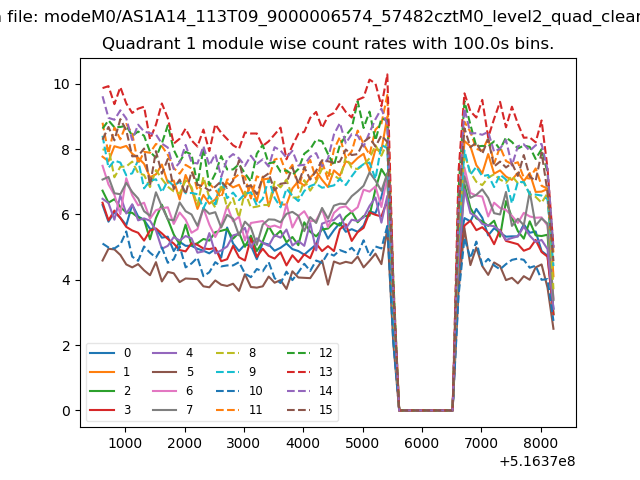
| Module-wise count rates for Quadrant A Data is divided into 100 sec bins |
 |
 |
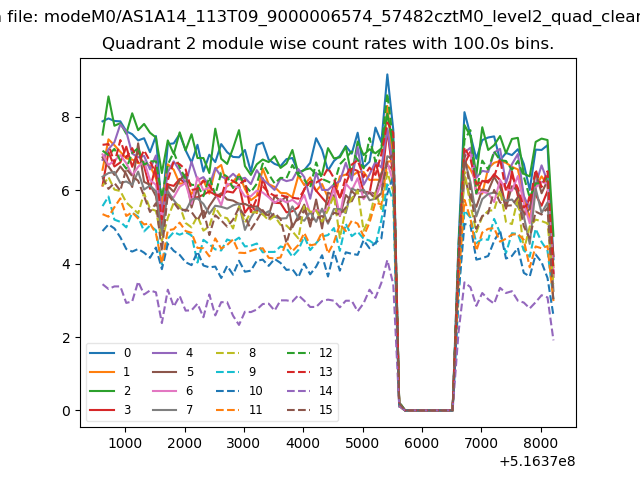
| Module-wise count rates for Quadrant B Data is divided into 100 sec bins |
 |
 |
| Module-wise count rates for Quadrant C Data is divided into 100 sec bins |
 |
 |
| Module-wise count rates for Quadrant D Data is divided into 100 sec bins |
 |
 |
| Parameter | Plot |
|---|---|
| CZT HV Monitor |  |
| D_VDD | 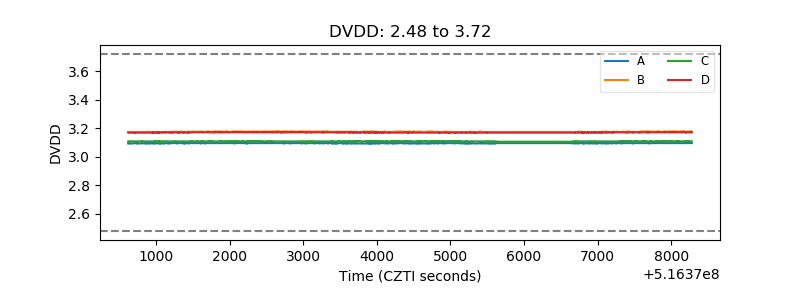 |
| Temperature 1 | 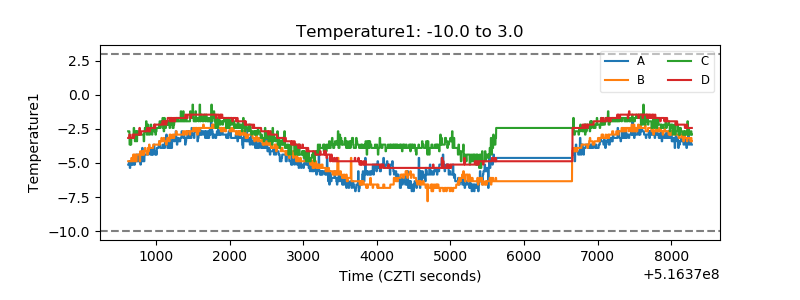 |
| Veto HV Monitor | 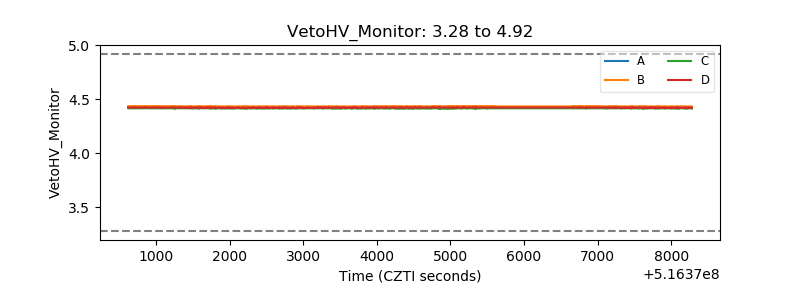 |
| Veto LLD | 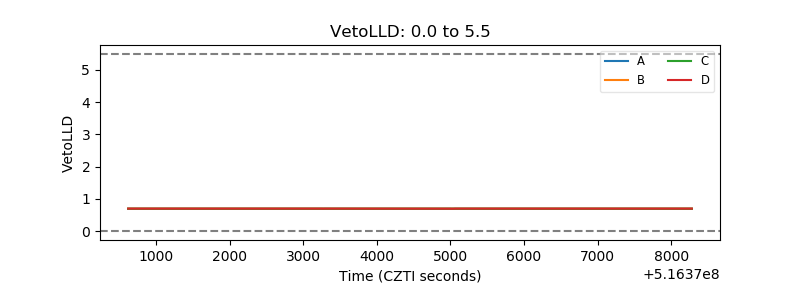 |
| Alpha Counter | 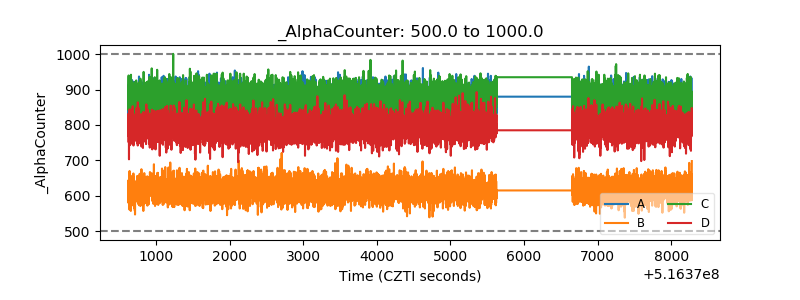 |
| _CPM_Rate | 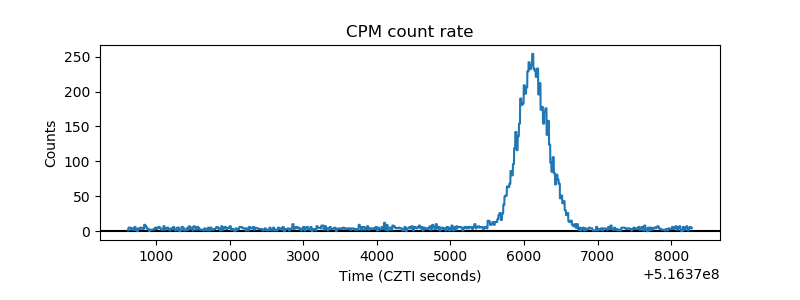 |
| CZT Counter | 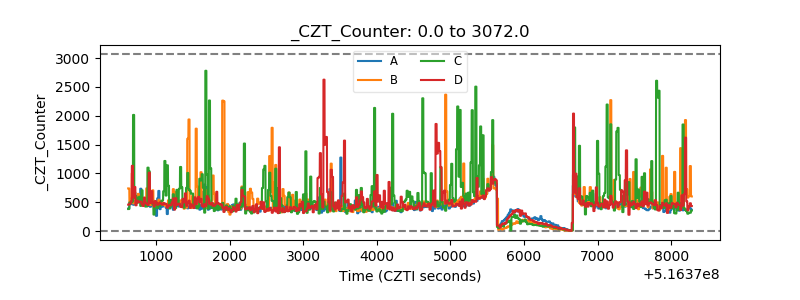 |
| +2.5 Volts monitor | 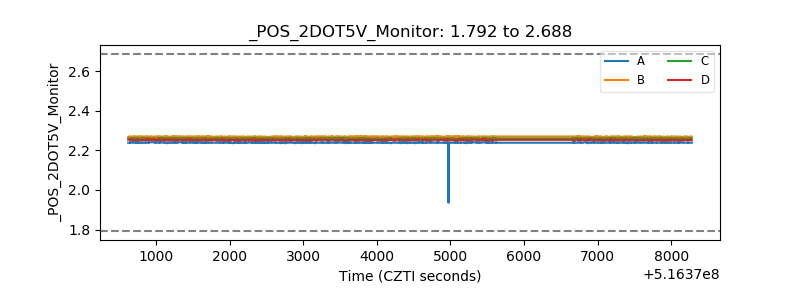 |
| +5 Volts monitor |  |
| _ROLL_ROT | 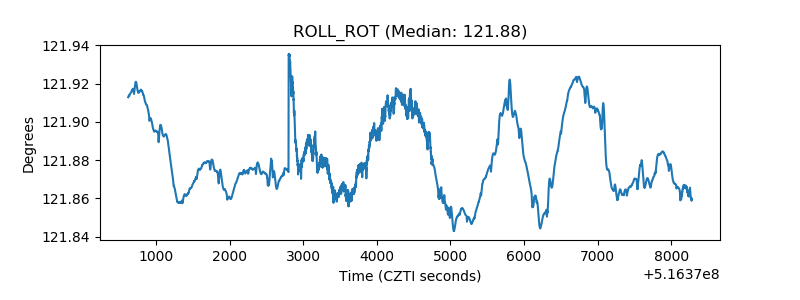 |
| _Roll_DEC | 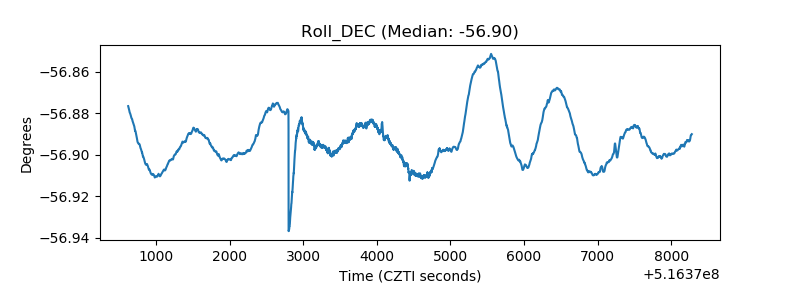 |
| _Roll_RA | 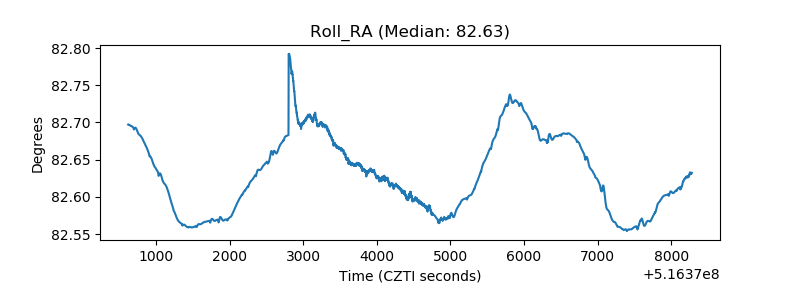 |
| Veto Counter | 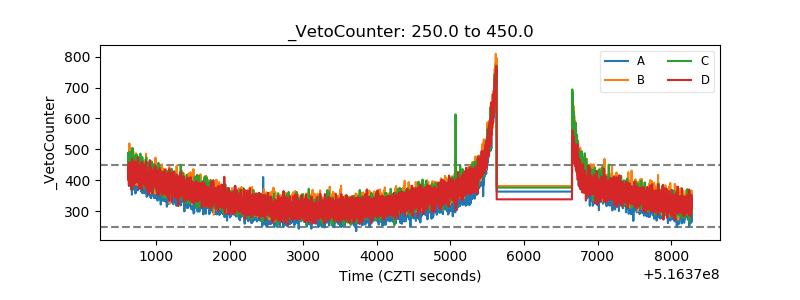 |