| Param | Original file | Final file |
|---|---|---|
| Filename | modeM0/AS1A14_113T09_9000006574_57484cztM0_level2.fits | modeM0/AS1A14_113T09_9000006574_57484cztM0_level2_quad_clean.evt |
| Size (bytes) | 480,130,560 | 98,288,640 |
| Size | 457.9 MB | 93.7 MB |
| Events in quadrant A | 3,389,502 | 655,579 |
| Events in quadrant B | 4,683,451 | 661,989 |
| Events in quadrant C | 5,314,513 | 594,035 |
| Events in quadrant D | 3,847,399 | 581,804 |
| Mode SS | |||
|---|---|---|---|
| Quadrant | BADHDUFLAG | Total packets | Discarded packets |
| A | 0 | 142 | 0 |
| B | 0 | 142 | 0 |
| C | 0 | 142 | 0 |
| D | 0 | 142 | 0 |
| Mode M9 | |||
|---|---|---|---|
| Quadrant | BADHDUFLAG | Total packets | Discarded packets |
| A | 0 | 3 | 0 |
| B | 0 | 3 | 0 |
| C | 0 | 3 | 0 |
| D | 0 | 3 | 0 |
| Mode M0 | |||
|---|---|---|---|
| Quadrant | BADHDUFLAG | Total packets | Discarded packets |
| A | 0 | 15060 | 1 |
| B | 0 | 18690 | 1 |
| C | 0 | 20712 | 1 |
| D | 0 | 16419 | 1 |
| Quadrant | Total seconds | Saturated seconds | Saturation percentage |
|---|---|---|---|
| A | 6920 | 75 | 1.083815% |
| B | 6921 | 524 | 7.571160% |
| C | 6921 | 497 | 7.181043% |
| D | 6921 | 184 | 2.658575% |
Noise dominated data is calculated using 1-second bins in cleaned event files. If a bin has >2000 counts, and if more than 50% of those come from <1% of pixels, then it is considered to be noise-dominated and hence unusable.
| Quadrant | # 1 sec bins | Bins with >0 counts | Bins with >2000 counts | High rate bins dominated by noise | Noise dominated (total time) | Noise dominated (detector-on time) | Marked lightcurve |
|---|---|---|---|---|---|---|---|
| A | 7250 | 6921 | 15 | 15 | 0.21% | 0.22% | 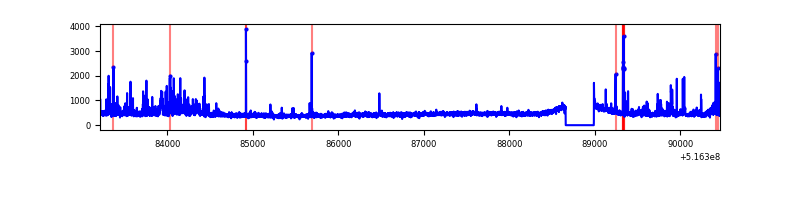 |
| B | 7251 | 6922 | 257 | 257 | 3.54% | 3.71% | 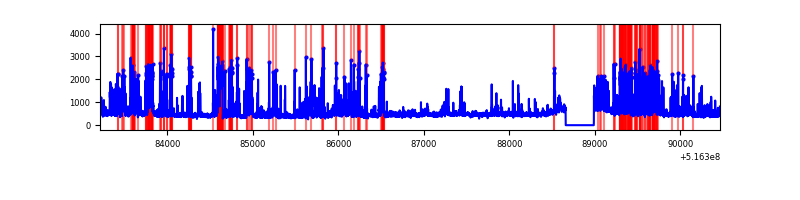 |
| C | 7251 | 6922 | 428 | 428 | 5.90% | 6.18% | 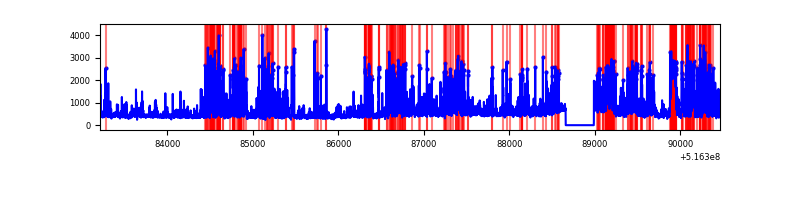 |
| D | 7251 | 6922 | 139 | 139 | 1.92% | 2.01% | 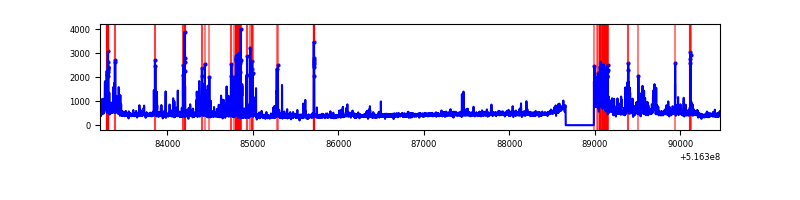 |
Top three noisy pixels from each quadrant. If the there are fewer than three noisy pixels in the level2.evt file, extra rows are filled as -1
| Pixel properties | Quadrant properties | ||||||
|---|---|---|---|---|---|---|---|
| Quadrant | DetID | PixID | Counts | Sigma | Mean | Median | Sigma |
| A | 7 | 64 | 321636 | 1729.89 | 749 | 728 | 185.5 |
| A | 3 | 14 | 45142 | 239.42 | 749 | 728 | 185.5 |
| A | 13 | 248 | 30510 | 160.54 | 749 | 728 | 185.5 |
| B | 4 | 206 | 1213569 | 7849.68 | 718 | 690 | 154.5 |
| B | 10 | 247 | 282225 | 1822.08 | 718 | 690 | 154.5 |
| B | 0 | 245 | 102026 | 655.84 | 718 | 690 | 154.5 |
| C | 15 | 224 | 2118762 | 11136.35 | 699 | 693 | 190.2 |
| C | 14 | 254 | 199346 | 1044.47 | 699 | 693 | 190.2 |
| C | 14 | 245 | 188224 | 986.0 | 699 | 693 | 190.2 |
| D | 3 | 12 | 322144 | 1611.17 | 713 | 681 | 199.5 |
| D | 2 | 249 | 272910 | 1364.41 | 713 | 681 | 199.5 |
| D | 2 | 252 | 145146 | 724.06 | 713 | 681 | 199.5 |
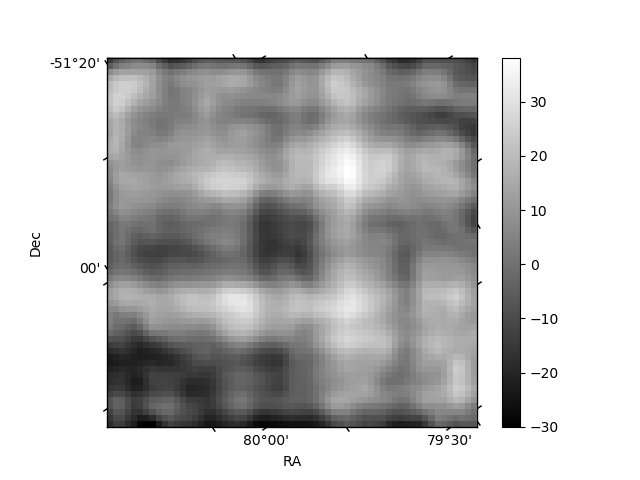
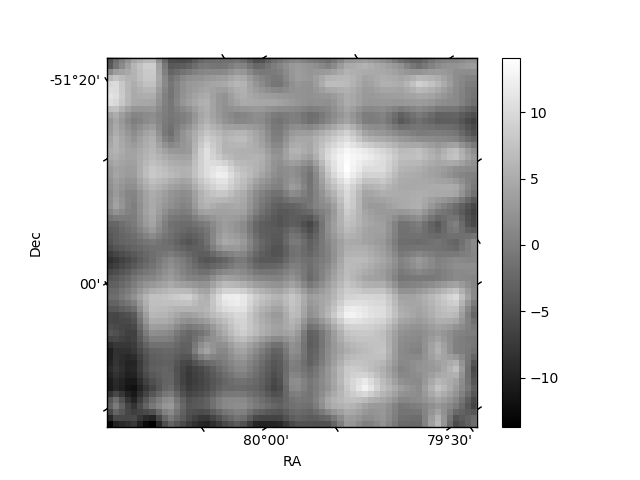
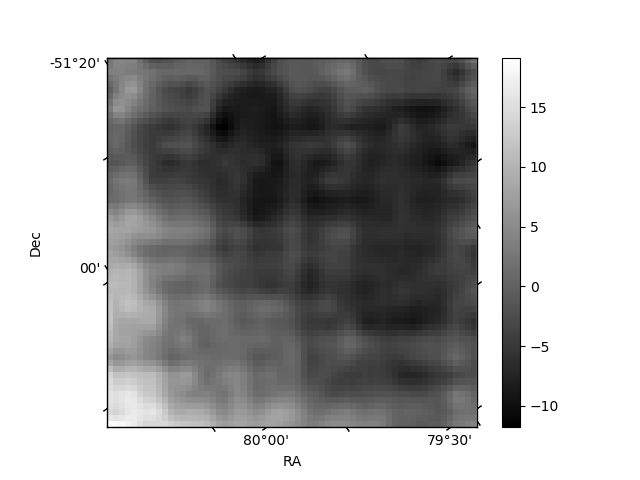
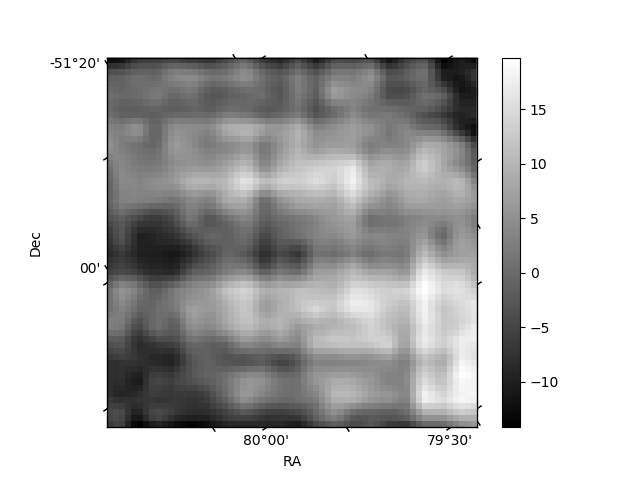
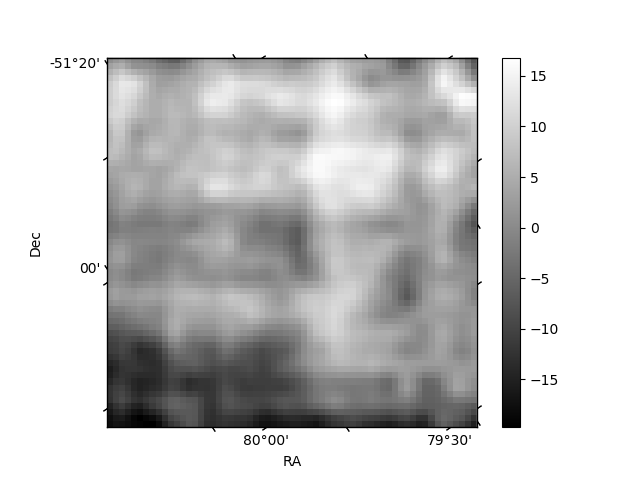
Histogram calculated using DETX and DETY for each event in the final _common_clean file
| Quadrant A | 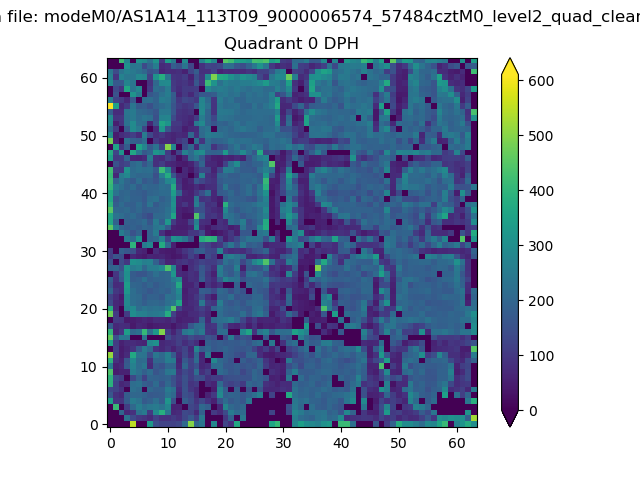 |
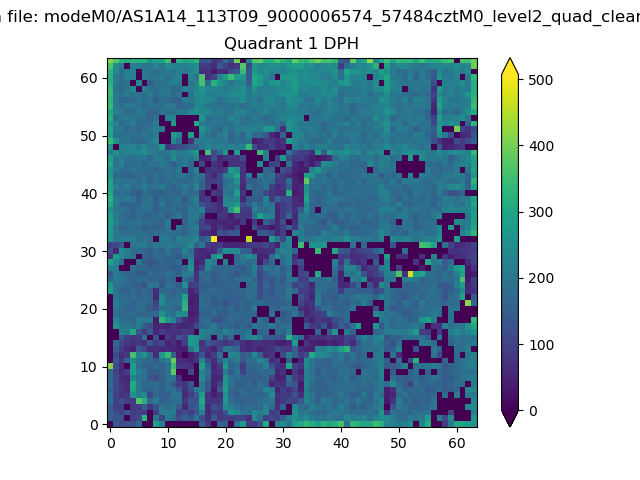 |
Quadrant B |
|---|---|---|---|
| Quadrant D | 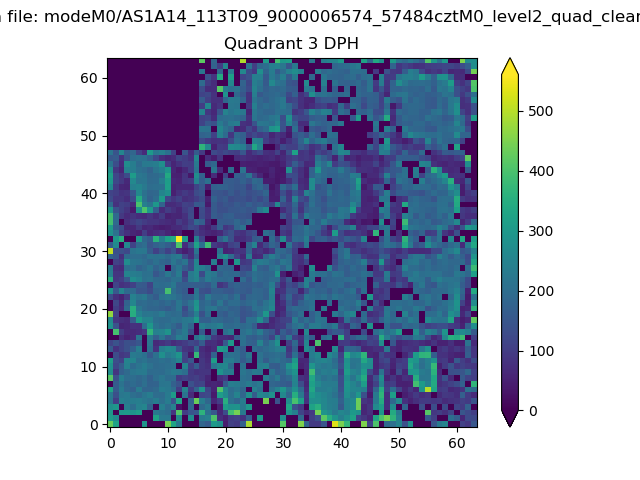 |
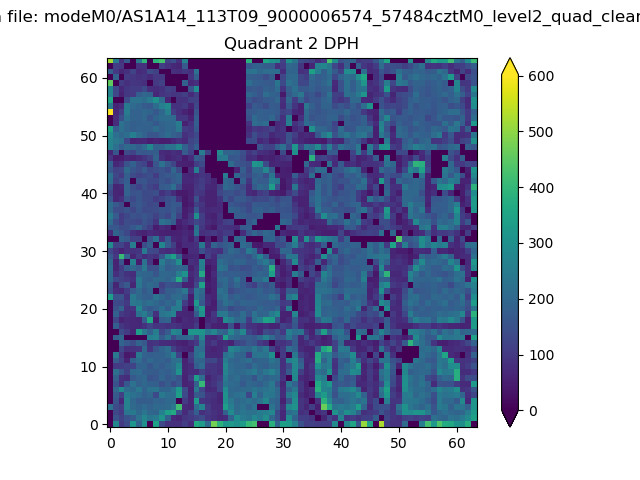 |
Quadrant C |
| Plot type | Count rate plots | Images |
|---|---|---|
| Comparison with Poisson distribution Blue bars denote a histogram of data divided into 1 sec bins. Red curve is a Poisson curve with rate = median count rate of data. |
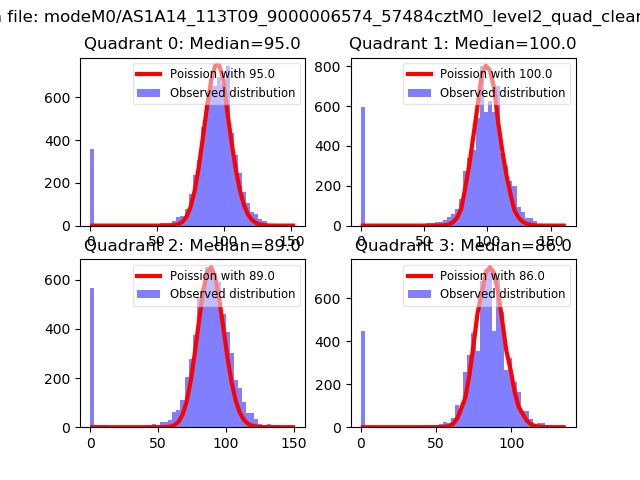 |
 |
| Quadrant-wise count rates Data is divided into 100 sec bins |
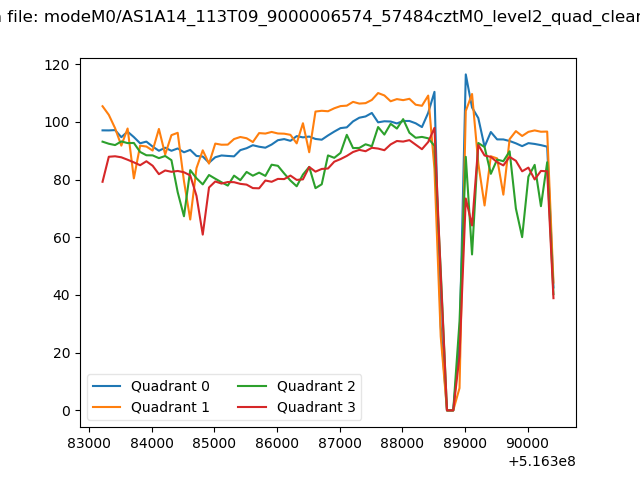 |
|
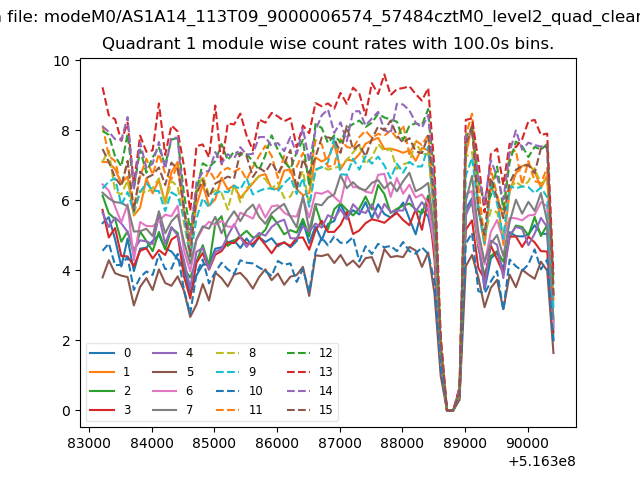
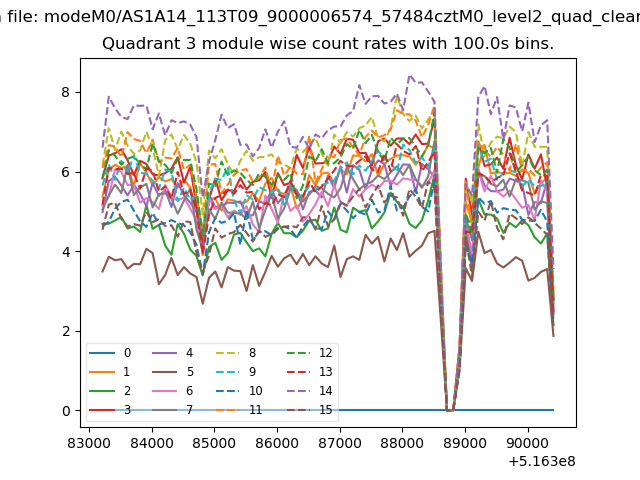
| Module-wise count rates for Quadrant A Data is divided into 100 sec bins |
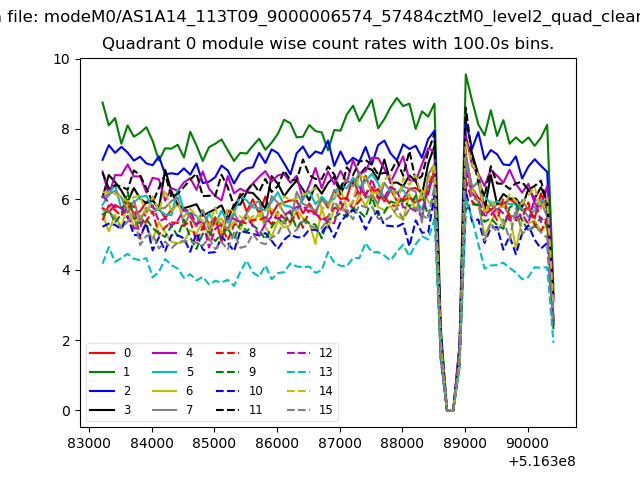 |
 |
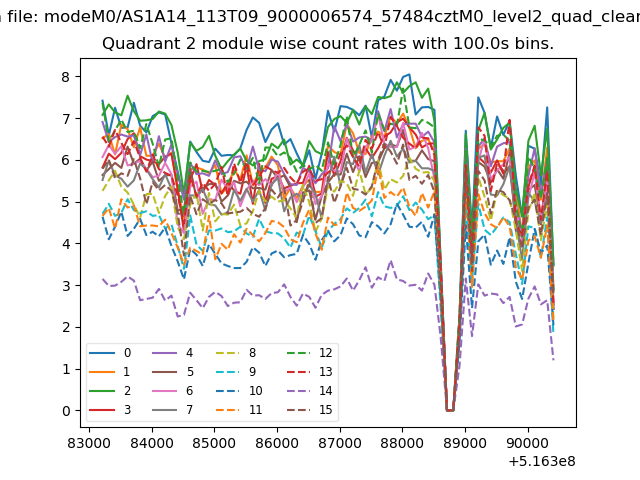
| Module-wise count rates for Quadrant B Data is divided into 100 sec bins |
 |
 |
| Module-wise count rates for Quadrant C Data is divided into 100 sec bins |
 |
 |
| Module-wise count rates for Quadrant D Data is divided into 100 sec bins |
 |
 |
| Parameter | Plot |
|---|---|
| CZT HV Monitor | 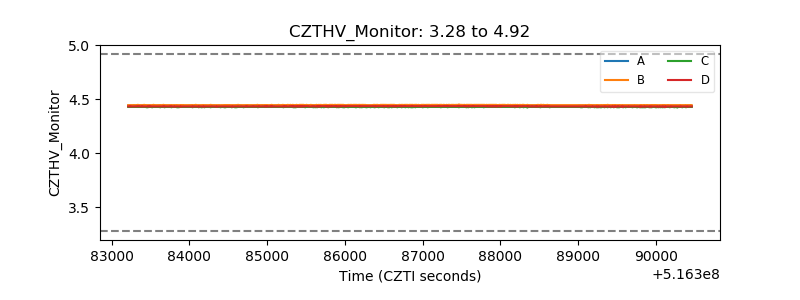 |
| D_VDD | 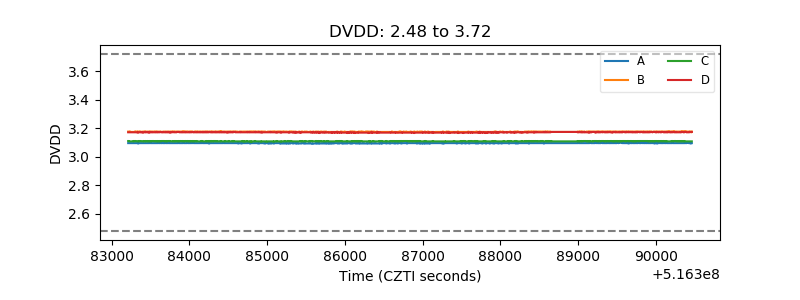 |
| Temperature 1 | 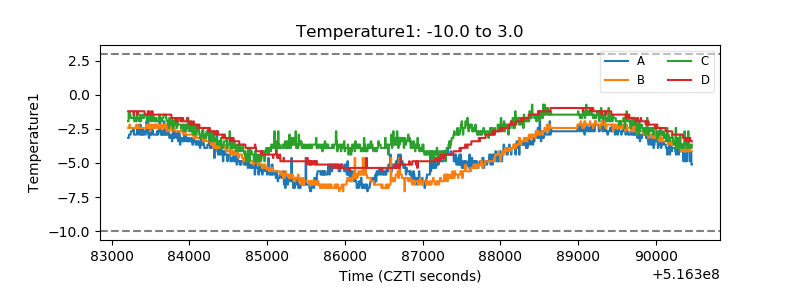 |
| Veto HV Monitor |  |
| Veto LLD | 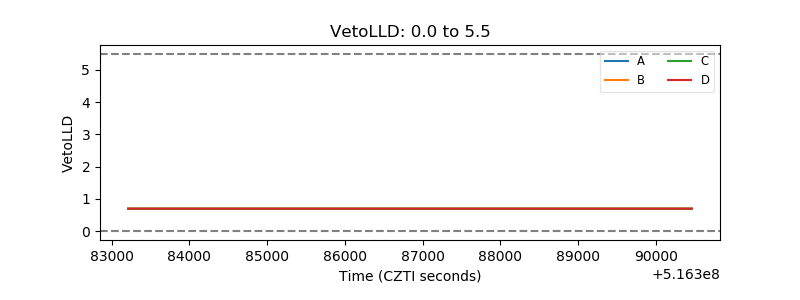 |
| Alpha Counter | 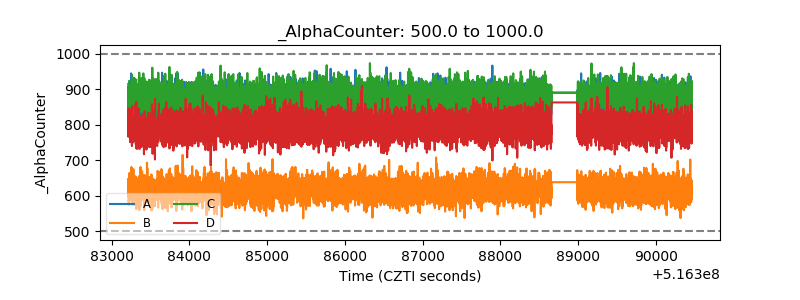 |
| _CPM_Rate | 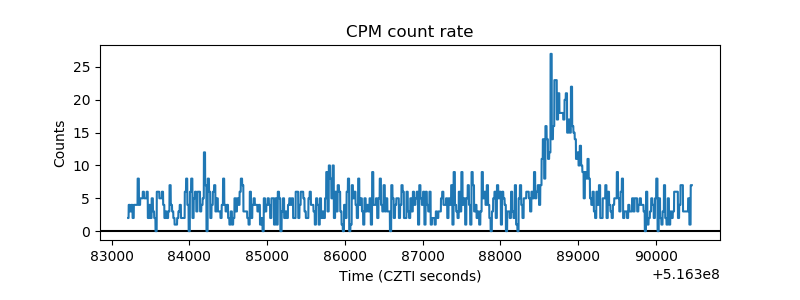 |
| CZT Counter | 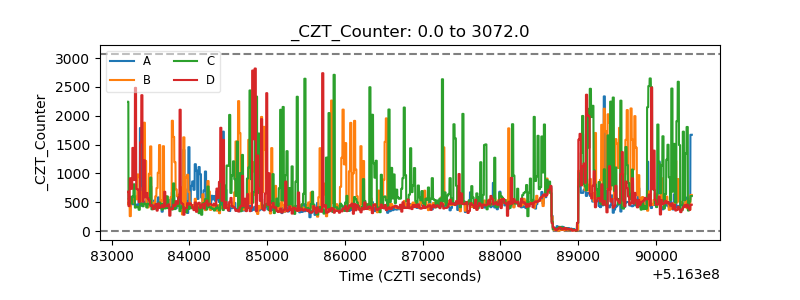 |
| +2.5 Volts monitor | 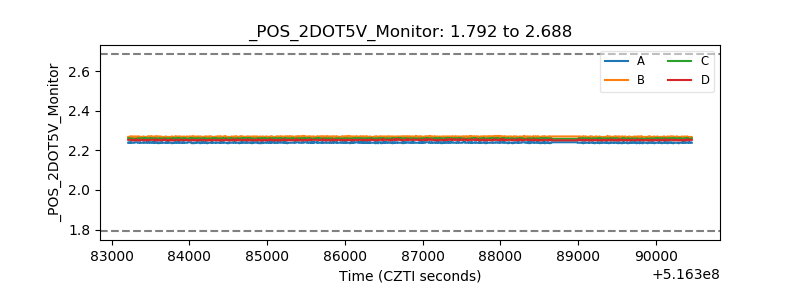 |
| +5 Volts monitor | 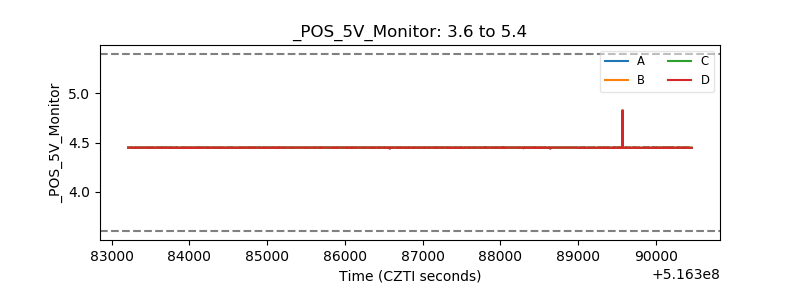 |
| _ROLL_ROT | 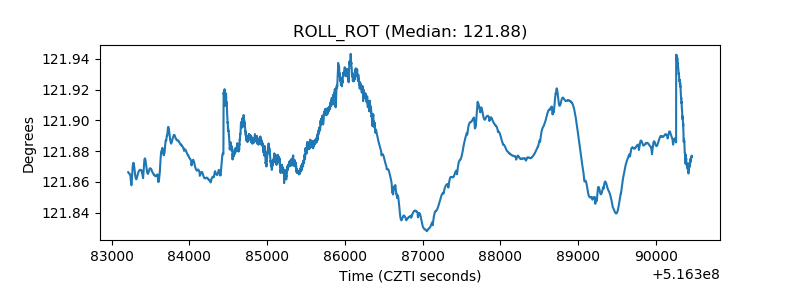 |
| _Roll_DEC | 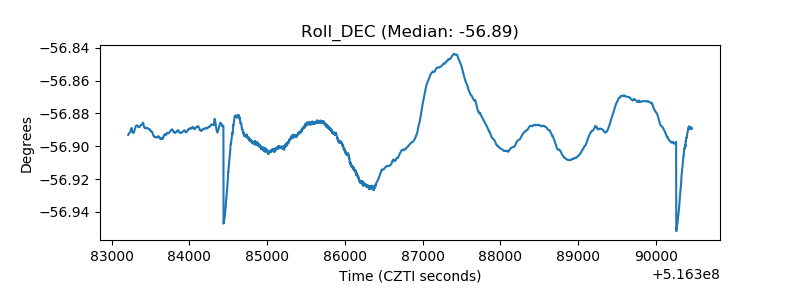 |
| _Roll_RA | 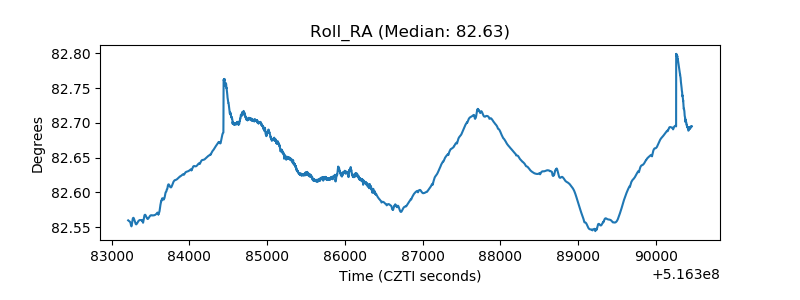 |
| Veto Counter | 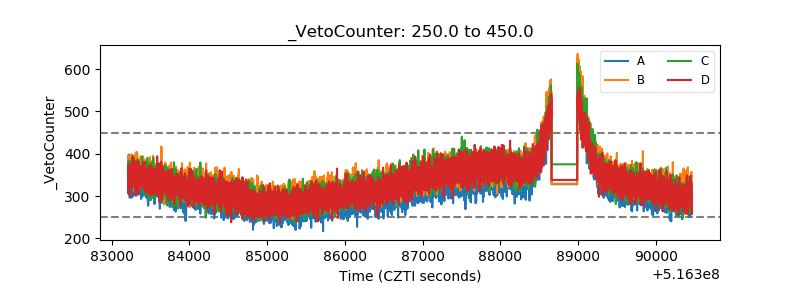 |