| Param | Original file | Final file |
|---|---|---|
| Filename | modeM0/AS1A14_113T09_9000006574_57485cztM0_level2.fits | modeM0/AS1A14_113T09_9000006574_57485cztM0_level2_quad_clean.evt |
| Size (bytes) | 522,302,400 | 106,024,320 |
| Size | 498.1 MB | 101.1 MB |
| Events in quadrant A | 3,668,172 | 705,457 |
| Events in quadrant B | 4,927,625 | 712,740 |
| Events in quadrant C | 6,309,004 | 632,437 |
| Events in quadrant D | 3,847,471 | 638,371 |
| Mode SS | |||
|---|---|---|---|
| Quadrant | BADHDUFLAG | Total packets | Discarded packets |
| A | 0 | 150 | 0 |
| B | 0 | 150 | 0 |
| C | 0 | 150 | 0 |
| D | 0 | 150 | 0 |
| Mode M0 | |||
|---|---|---|---|
| Quadrant | BADHDUFLAG | Total packets | Discarded packets |
| A | 0 | 16420 | 0 |
| B | 0 | 19968 | 1 |
| C | 0 | 24055 | 0 |
| D | 0 | 16750 | 0 |
| Quadrant | Total seconds | Saturated seconds | Saturation percentage |
|---|---|---|---|
| A | 7488 | 77 | 1.028312% |
| B | 7488 | 561 | 7.491987% |
| C | 7488 | 664 | 8.867521% |
| D | 7488 | 35 | 0.467415% |
Noise dominated data is calculated using 1-second bins in cleaned event files. If a bin has >2000 counts, and if more than 50% of those come from <1% of pixels, then it is considered to be noise-dominated and hence unusable.
| Quadrant | # 1 sec bins | Bins with >0 counts | Bins with >2000 counts | High rate bins dominated by noise | Noise dominated (total time) | Noise dominated (detector-on time) | Marked lightcurve |
|---|---|---|---|---|---|---|---|
| A | 7488 | 7488 | 50 | 50 | 0.67% | 0.67% | 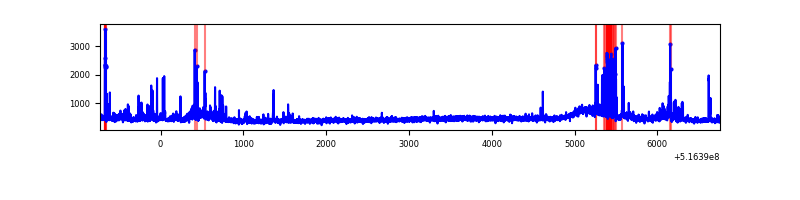 |
| B | 7488 | 7488 | 237 | 237 | 3.17% | 3.17% | 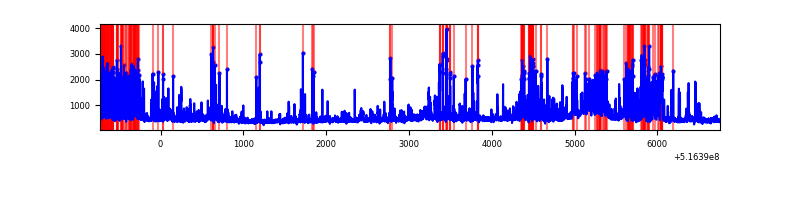 |
| C | 7488 | 7488 | 568 | 568 | 7.59% | 7.59% | 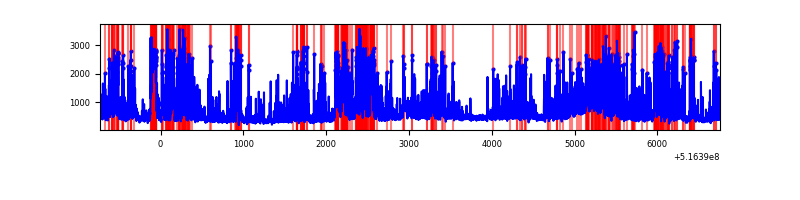 |
| D | 7488 | 7488 | 35 | 35 | 0.47% | 0.47% | 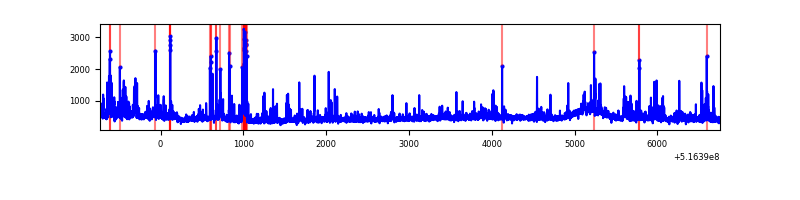 |
Top three noisy pixels from each quadrant. If the there are fewer than three noisy pixels in the level2.evt file, extra rows are filled as -1
| Pixel properties | Quadrant properties | ||||||
|---|---|---|---|---|---|---|---|
| Quadrant | DetID | PixID | Counts | Sigma | Mean | Median | Sigma |
| A | 13 | 248 | 256332 | 1291.16 | 811 | 791 | 197.9 |
| A | 7 | 64 | 185304 | 932.28 | 811 | 791 | 197.9 |
| A | 3 | 245 | 33509 | 165.31 | 811 | 791 | 197.9 |
| B | 4 | 206 | 1275269 | 7653.54 | 779 | 752 | 166.5 |
| B | 0 | 245 | 148572 | 887.67 | 779 | 752 | 166.5 |
| B | 10 | 247 | 81214 | 483.18 | 779 | 752 | 166.5 |
| C | 15 | 224 | 2949068 | 14541.35 | 753 | 746 | 202.8 |
| C | 14 | 254 | 232684 | 1143.93 | 753 | 746 | 202.8 |
| C | 13 | 3 | 68160 | 332.49 | 753 | 746 | 202.8 |
| D | 2 | 252 | 175508 | 790.33 | 784 | 748 | 221.1 |
| D | 2 | 249 | 166182 | 748.15 | 784 | 748 | 221.1 |
| D | 3 | 12 | 66816 | 298.78 | 784 | 748 | 221.1 |
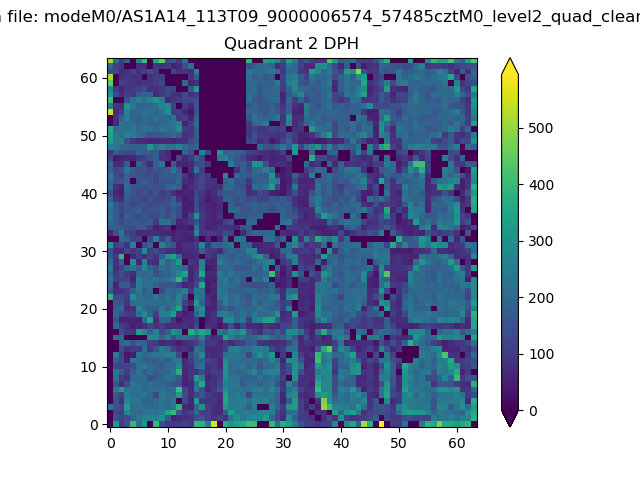
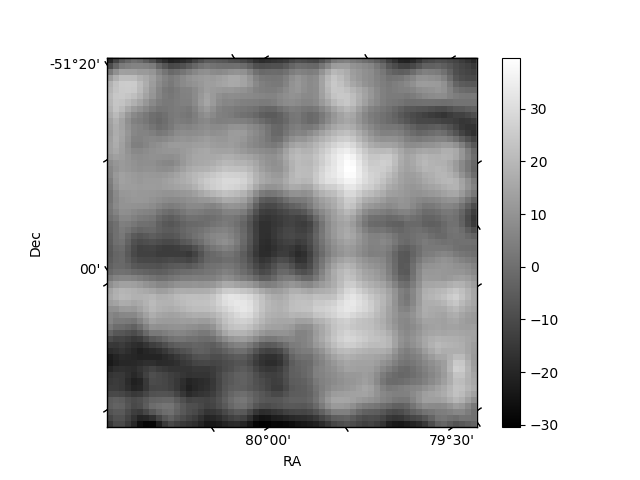
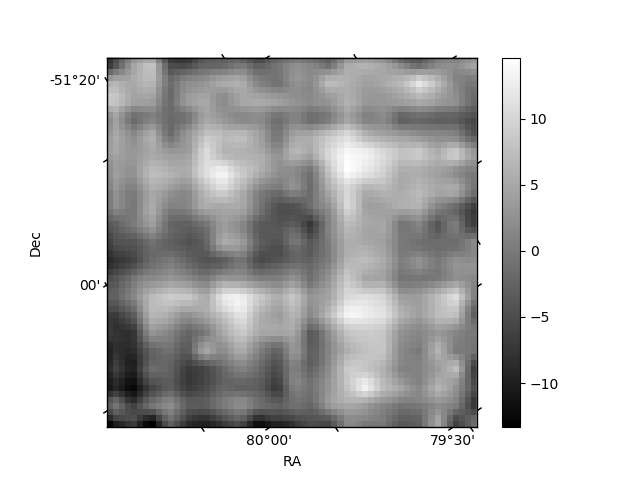
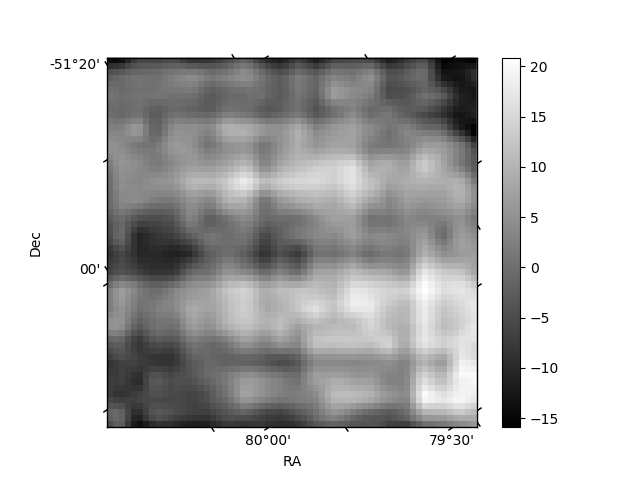
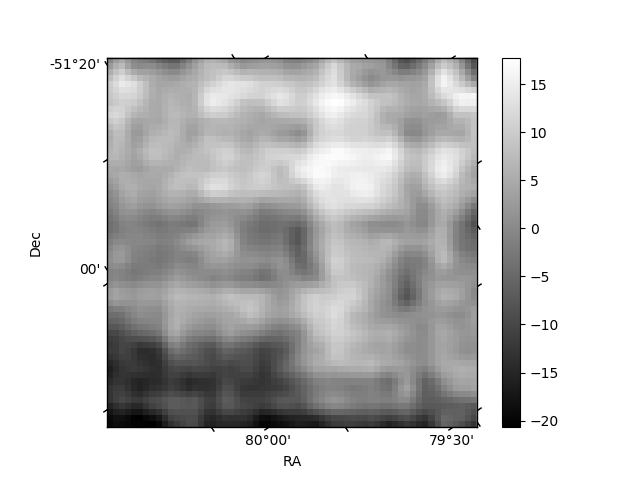
Histogram calculated using DETX and DETY for each event in the final _common_clean file
| Quadrant A | 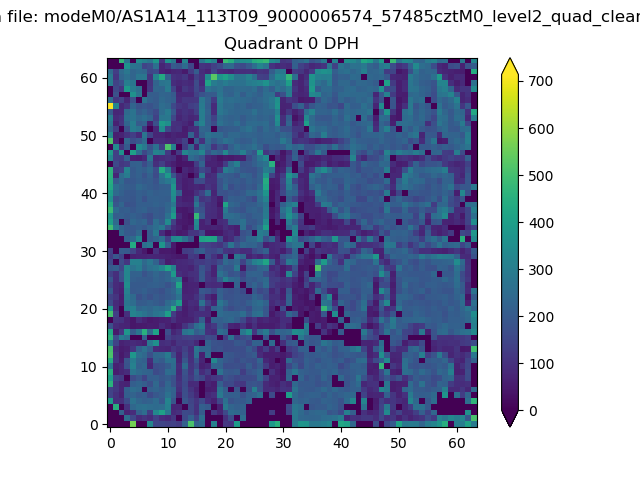 |
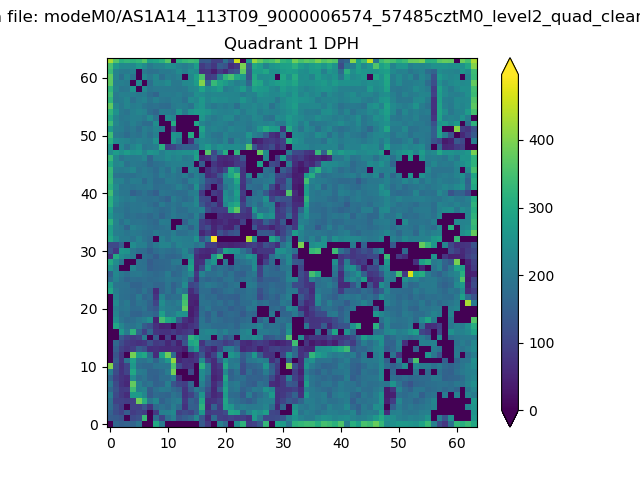 |
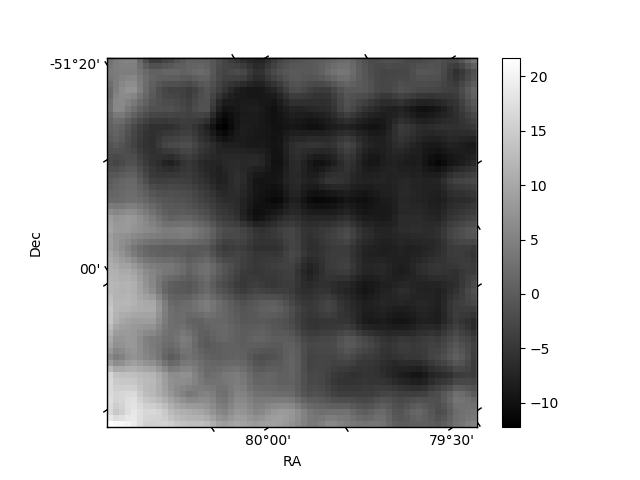
Quadrant B |
|---|---|---|---|
| Quadrant D | 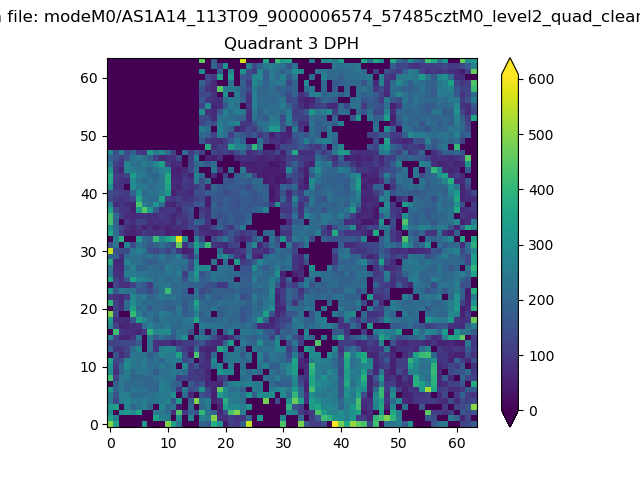 |
 |
Quadrant C |
| Plot type | Count rate plots | Images |
|---|---|---|
| Comparison with Poisson distribution Blue bars denote a histogram of data divided into 1 sec bins. Red curve is a Poisson curve with rate = median count rate of data. |
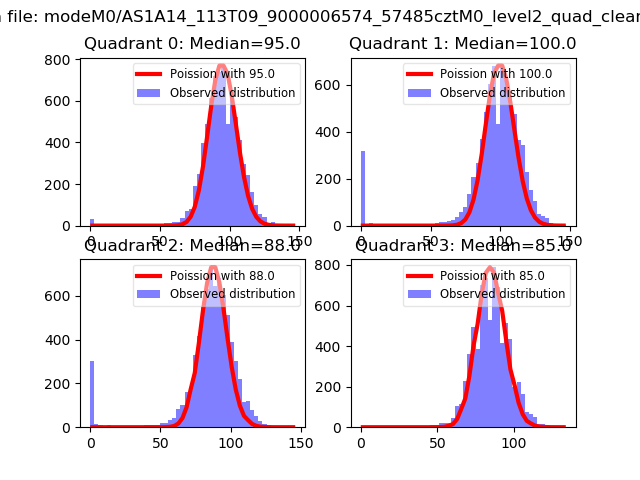 |
 |
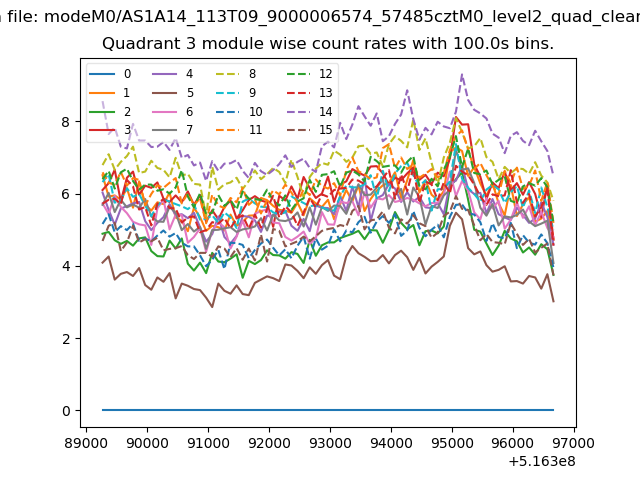
| Quadrant-wise count rates Data is divided into 100 sec bins |
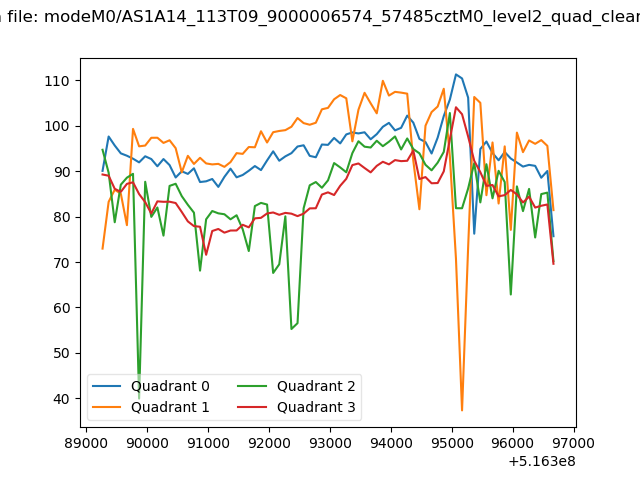 |
|
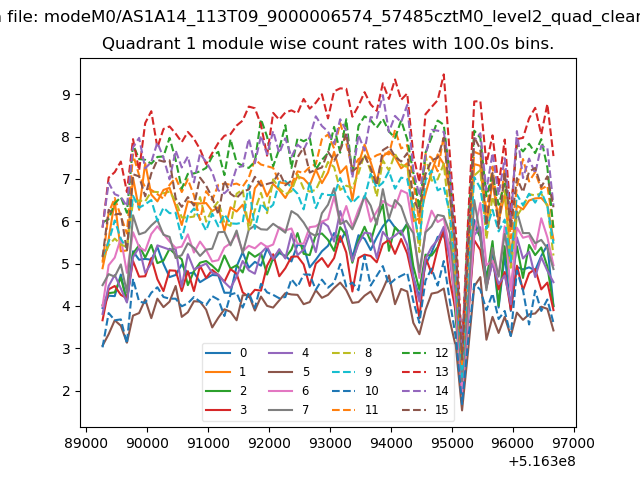
| Module-wise count rates for Quadrant A Data is divided into 100 sec bins |
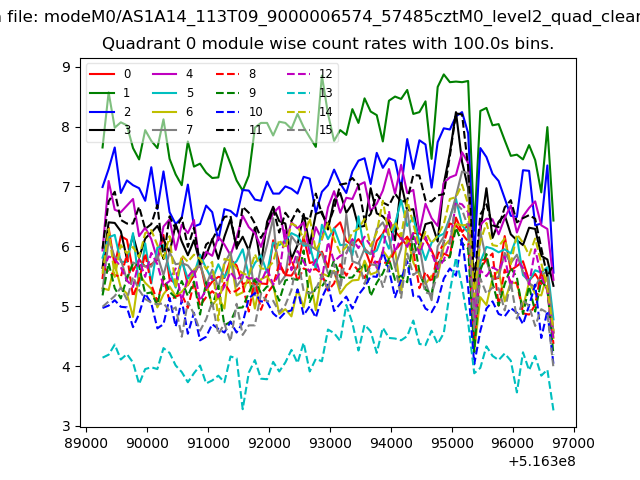 |
 |
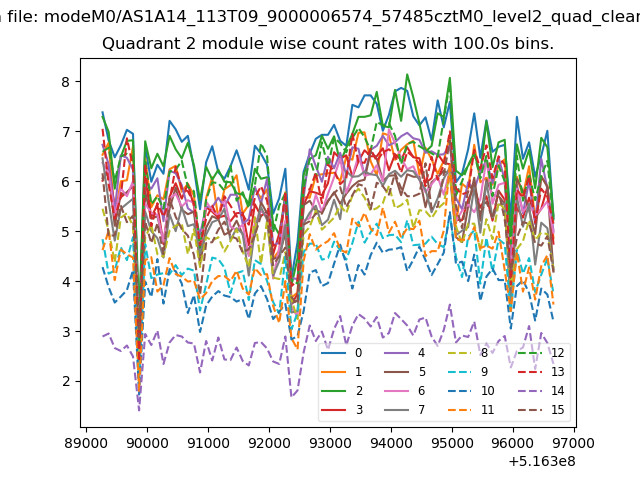
| Module-wise count rates for Quadrant B Data is divided into 100 sec bins |
 |
 |
| Module-wise count rates for Quadrant C Data is divided into 100 sec bins |
 |
 |
| Module-wise count rates for Quadrant D Data is divided into 100 sec bins |
 |
 |
| Parameter | Plot |
|---|---|
| CZT HV Monitor | 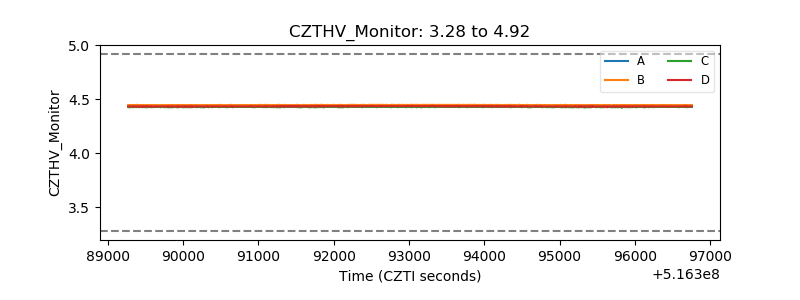 |
| D_VDD | 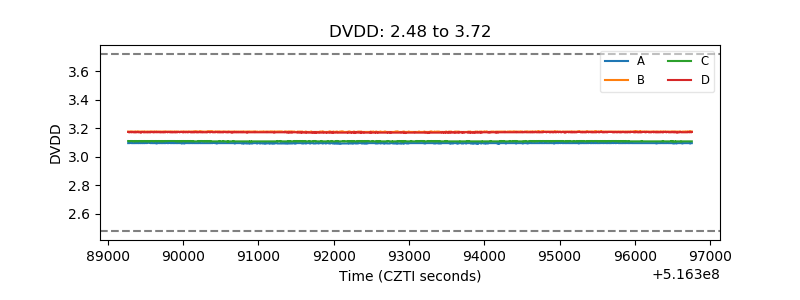 |
| Temperature 1 | 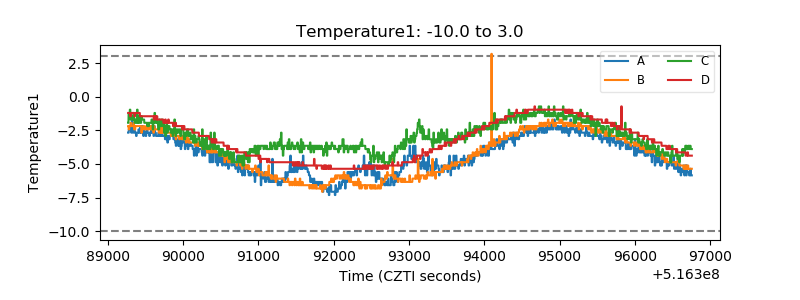 |
| Veto HV Monitor | 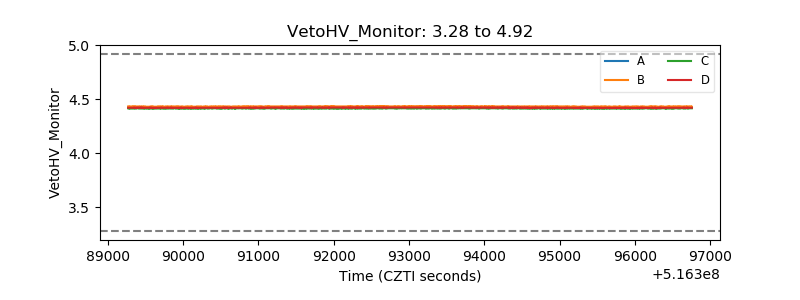 |
| Veto LLD | 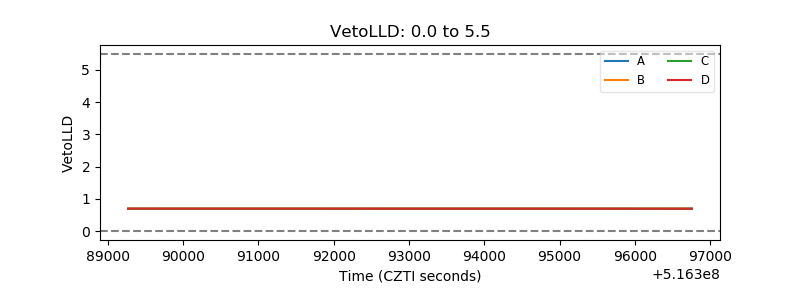 |
| Alpha Counter | 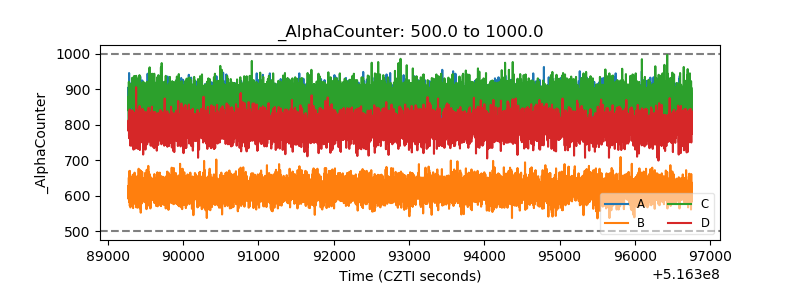 |
| _CPM_Rate | 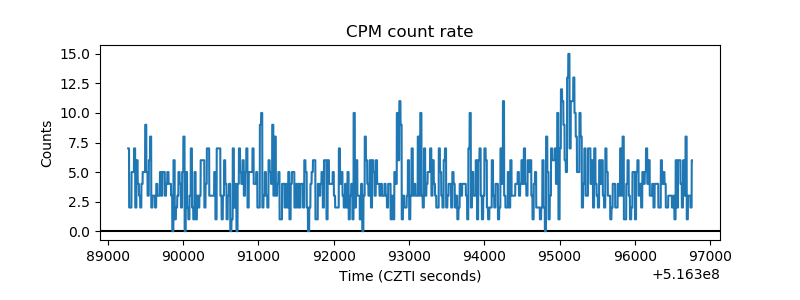 |
| CZT Counter | 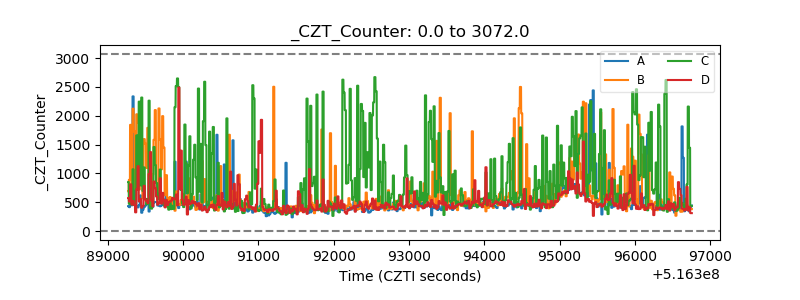 |
| +2.5 Volts monitor | 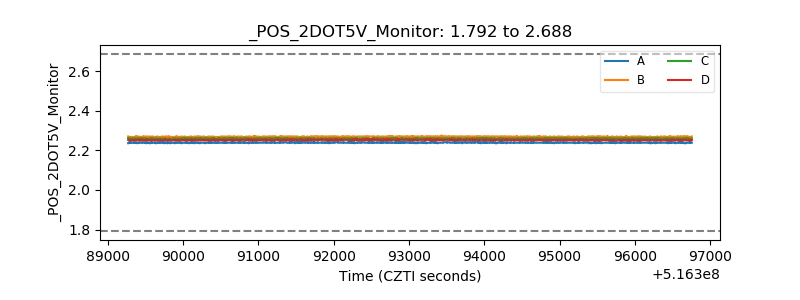 |
| +5 Volts monitor | 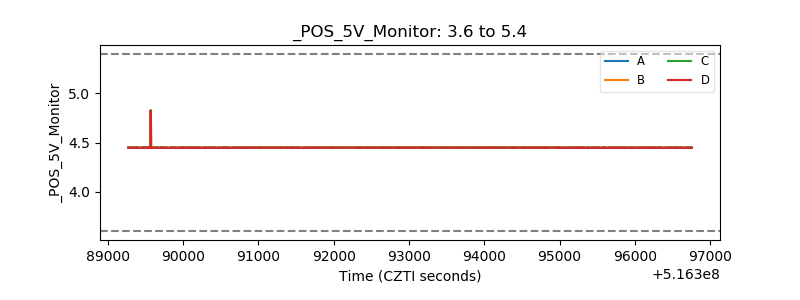 |
| _ROLL_ROT | 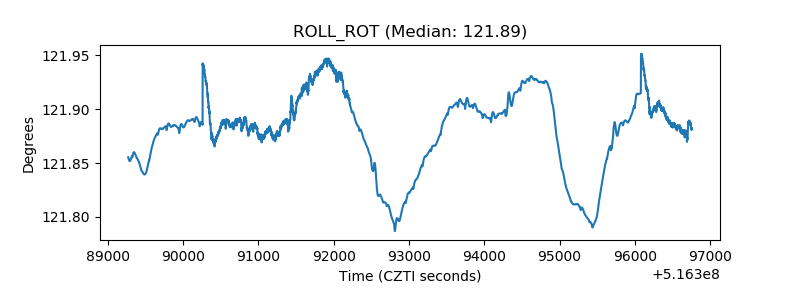 |
| _Roll_DEC | 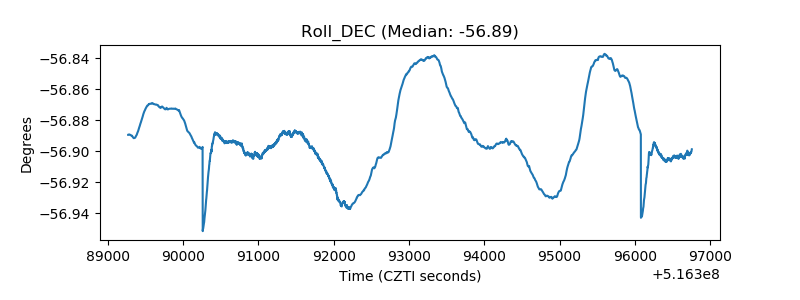 |
| _Roll_RA | 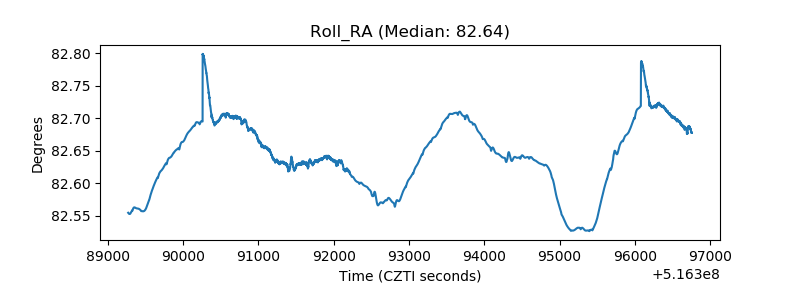 |
| Veto Counter | 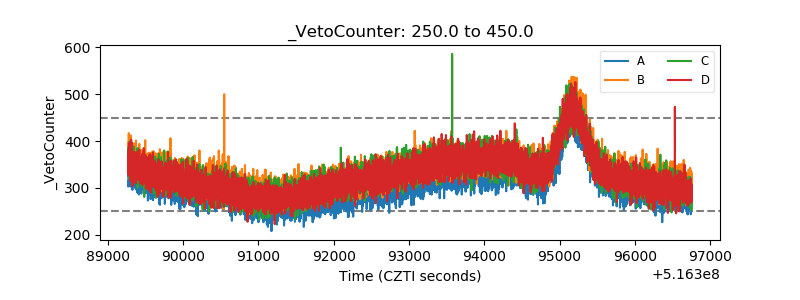 |