| Param | Original file | Final file |
|---|---|---|
| Filename | modeM0/AS1A14_113T09_9000006574_57486cztM0_level2.fits | modeM0/AS1A14_113T09_9000006574_57486cztM0_level2_quad_clean.evt |
| Size (bytes) | 507,890,880 | 98,968,320 |
| Size | 484.4 MB | 94.4 MB |
| Events in quadrant A | 3,844,285 | 636,994 |
| Events in quadrant B | 4,506,868 | 682,871 |
| Events in quadrant C | 5,836,012 | 588,444 |
| Events in quadrant D | 4,027,667 | 563,444 |
| Mode SS | |||
|---|---|---|---|
| Quadrant | BADHDUFLAG | Total packets | Discarded packets |
| A | 0 | 154 | 2 |
| B | 0 | 155 | 3 |
| C | 0 | 154 | 2 |
| D | 0 | 154 | 2 |
| Mode M9 | |||
|---|---|---|---|
| Quadrant | BADHDUFLAG | Total packets | Discarded packets |
| A | 0 | 1 | 1 |
| B | 1 | 1 | 1 |
| C | 1 | -1 | -1 |
| D | 1 | -1 | -1 |
| Mode M0 | |||
|---|---|---|---|
| Quadrant | BADHDUFLAG | Total packets | Discarded packets |
| A | 0 | 17456 | 316 |
| B | 0 | 19181 | 307 |
| C | 0 | 23125 | 415 |
| D | 0 | 17617 | 261 |
| Quadrant | Total seconds | Saturated seconds | Saturation percentage |
|---|---|---|---|
| A | 7538 | 169 | 2.241974% |
| B | 7539 | 418 | 5.544502% |
| C | 7529 | 518 | 6.880064% |
| D | 7537 | 98 | 1.300252% |
Noise dominated data is calculated using 1-second bins in cleaned event files. If a bin has >2000 counts, and if more than 50% of those come from <1% of pixels, then it is considered to be noise-dominated and hence unusable.
| Quadrant | # 1 sec bins | Bins with >0 counts | Bins with >2000 counts | High rate bins dominated by noise | Noise dominated (total time) | Noise dominated (detector-on time) | Marked lightcurve |
|---|---|---|---|---|---|---|---|
| A | 8242 | 7826 | 122 | 122 | 1.48% | 1.56% | 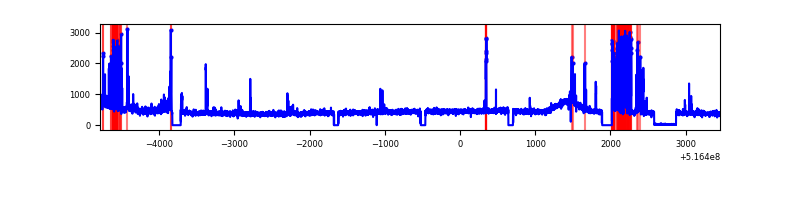 |
| B | 8243 | 7830 | 126 | 126 | 1.53% | 1.61% | 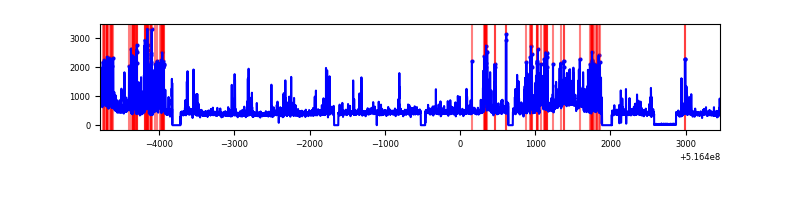 |
| C | 8243 | 7818 | 430 | 430 | 5.22% | 5.50% | 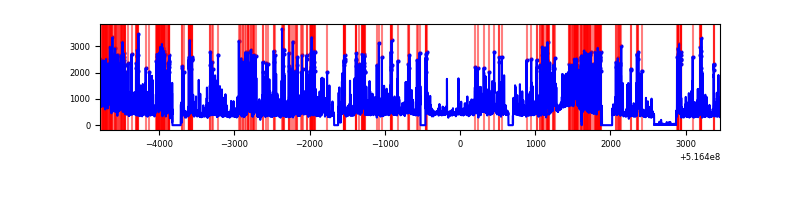 |
| D | 8243 | 7829 | 86 | 86 | 1.04% | 1.10% | 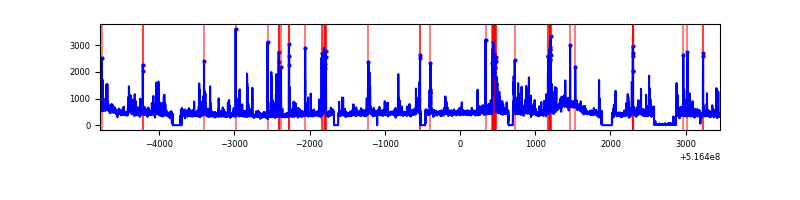 |
Top three noisy pixels from each quadrant. If the there are fewer than three noisy pixels in the level2.evt file, extra rows are filled as -1
| Pixel properties | Quadrant properties | ||||||
|---|---|---|---|---|---|---|---|
| Quadrant | DetID | PixID | Counts | Sigma | Mean | Median | Sigma |
| A | 13 | 248 | 549170 | 2705.22 | 821 | 798 | 202.7 |
| A | 7 | 64 | 25714 | 122.92 | 821 | 798 | 202.7 |
| A | 7 | 14 | 21106 | 100.18 | 821 | 798 | 202.7 |
| B | 4 | 206 | 876984 | 5091.31 | 803 | 774 | 172.1 |
| B | 5 | 185 | 95800 | 552.16 | 803 | 774 | 172.1 |
| B | 0 | 245 | 55421 | 317.53 | 803 | 774 | 172.1 |
| C | 15 | 224 | 2524203 | 12049.61 | 772 | 764 | 209.4 |
| C | 14 | 254 | 166758 | 792.63 | 772 | 764 | 209.4 |
| C | 12 | 252 | 50844 | 239.13 | 772 | 764 | 209.4 |
| D | 8 | 240 | 156454 | 694.25 | 794 | 758 | 224.3 |
| D | 15 | 142 | 138183 | 612.78 | 794 | 758 | 224.3 |
| D | 12 | 128 | 91029 | 402.52 | 794 | 758 | 224.3 |
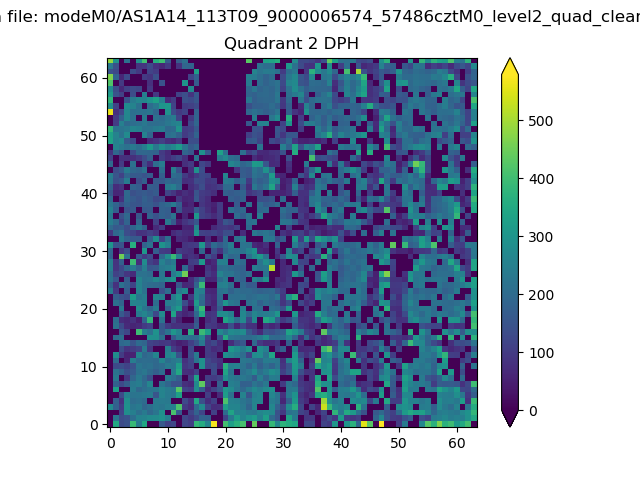
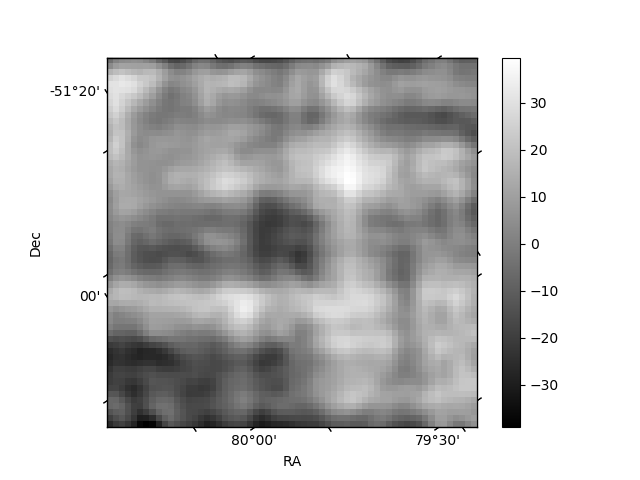
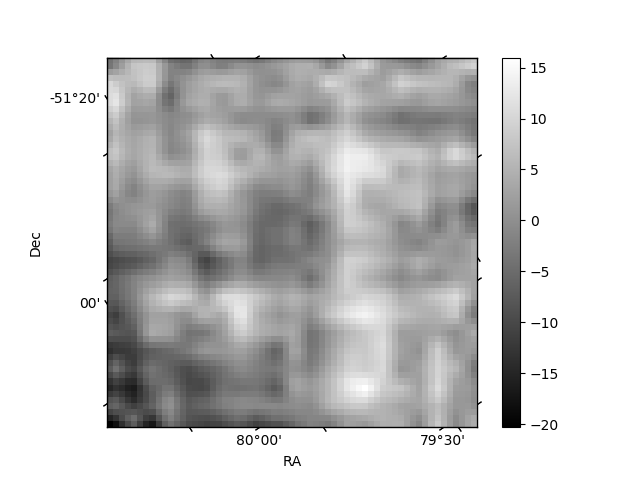
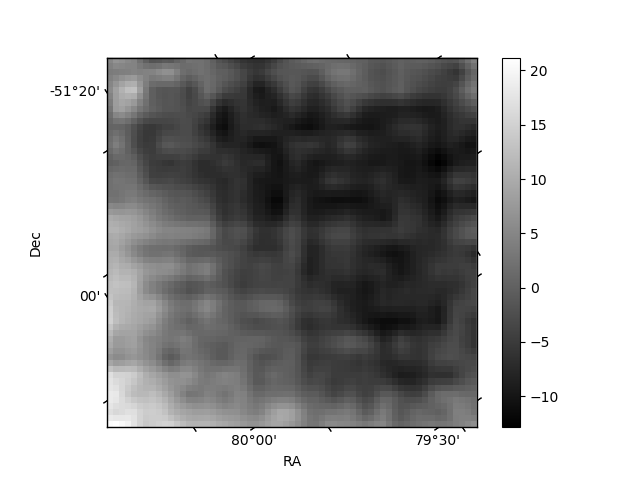
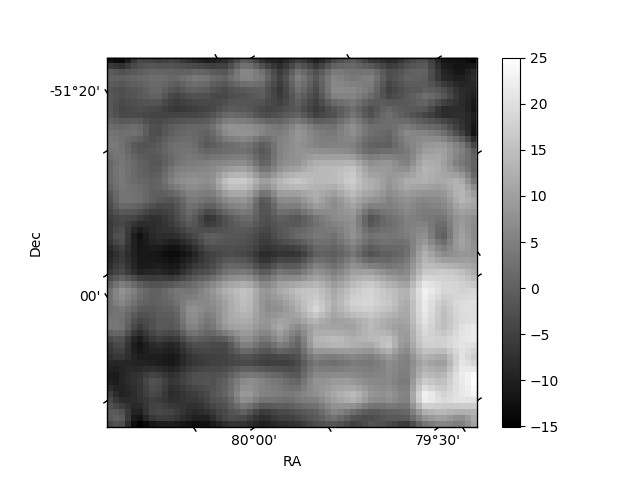
Histogram calculated using DETX and DETY for each event in the final _common_clean file
| Quadrant A | 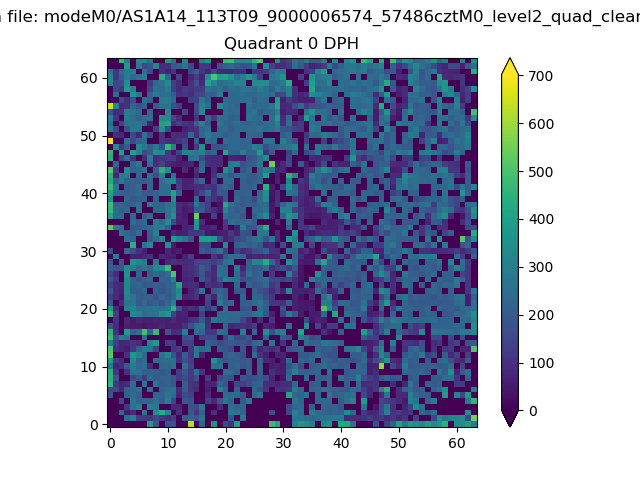 |
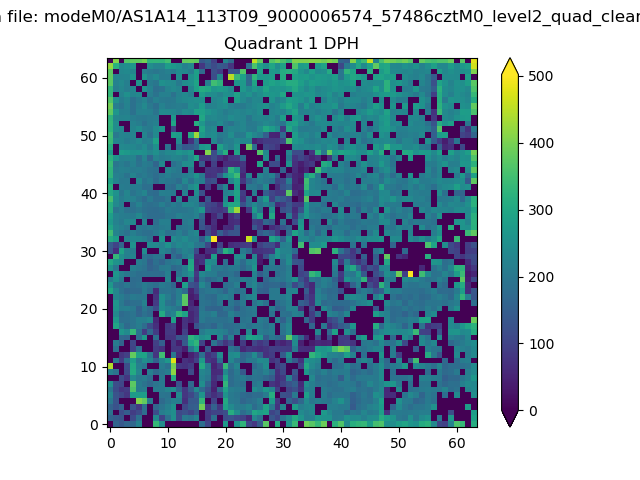 |
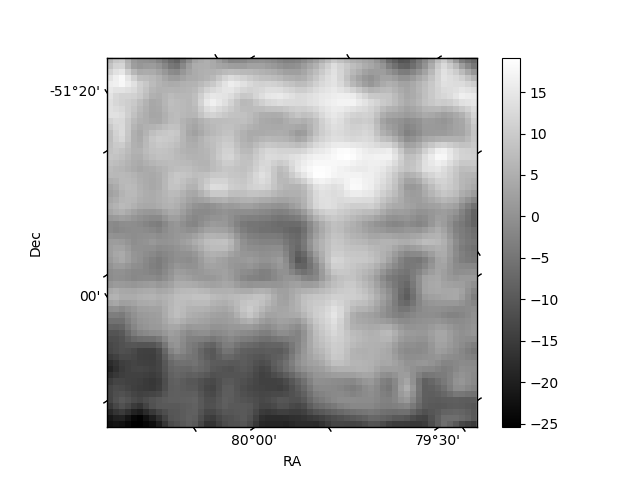
Quadrant B |
|---|---|---|---|
| Quadrant D | 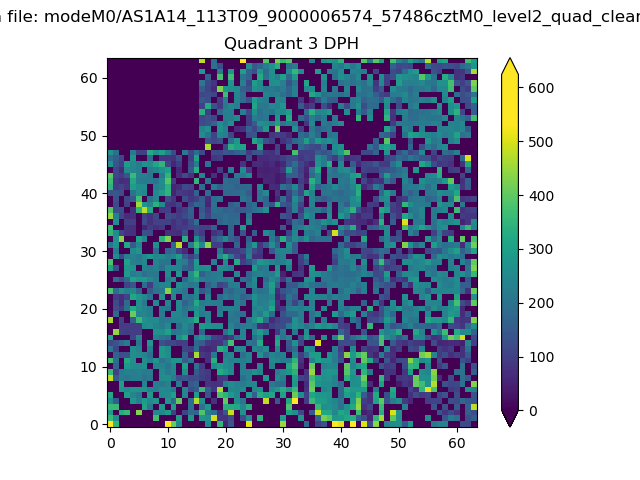 |
 |
Quadrant C |
| Plot type | Count rate plots | Images |
|---|---|---|
| Comparison with Poisson distribution Blue bars denote a histogram of data divided into 1 sec bins. Red curve is a Poisson curve with rate = median count rate of data. |
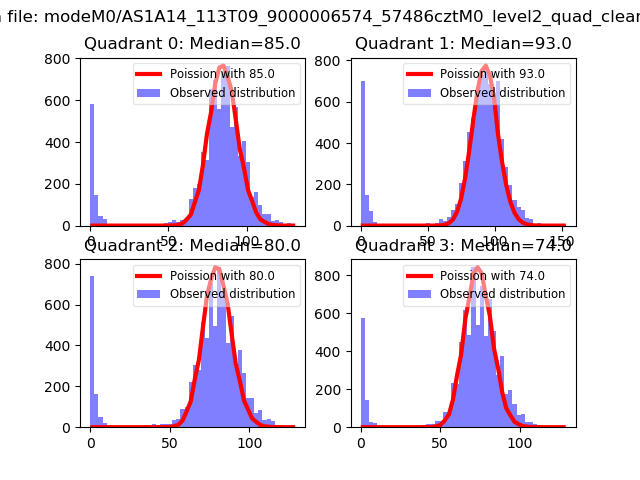 |
 |
| Quadrant-wise count rates Data is divided into 100 sec bins |
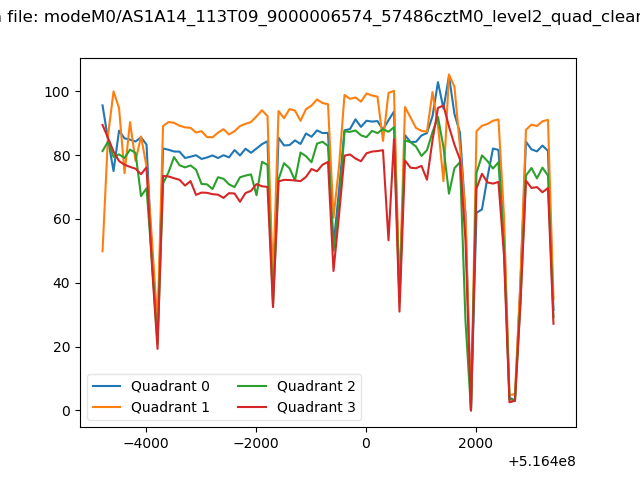 |
|
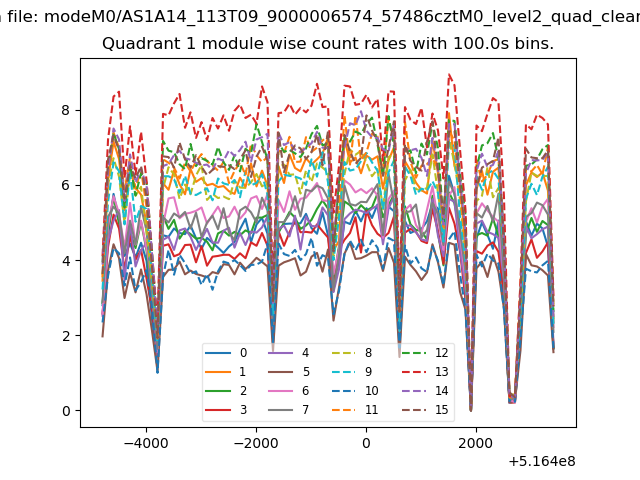
| Module-wise count rates for Quadrant A Data is divided into 100 sec bins |
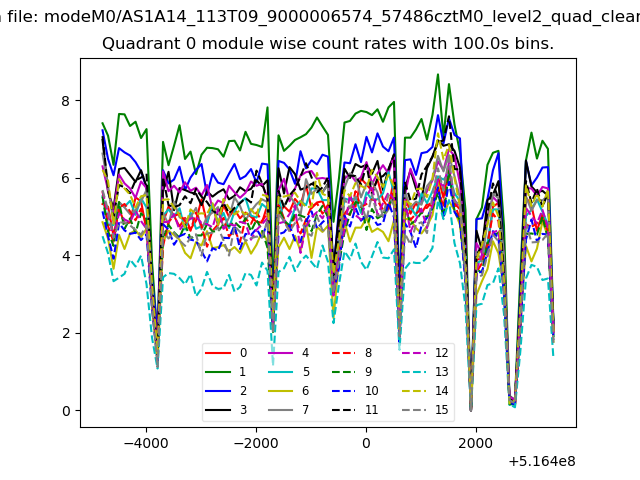 |
 |
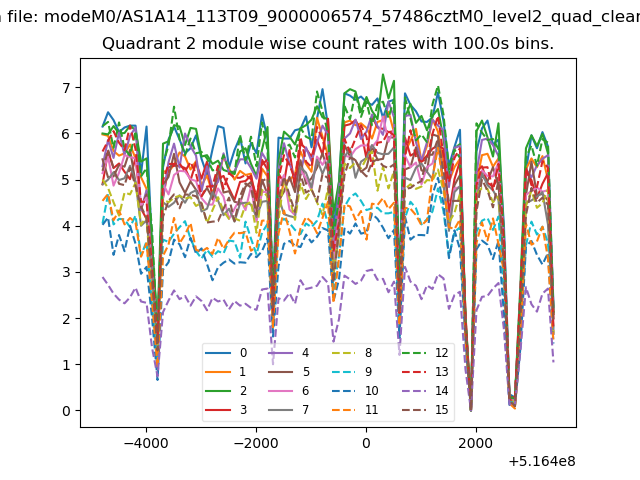
| Module-wise count rates for Quadrant B Data is divided into 100 sec bins |
 |
 |
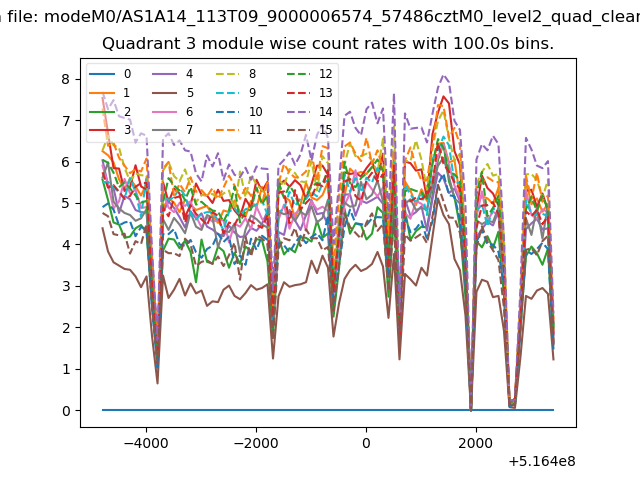
| Module-wise count rates for Quadrant C Data is divided into 100 sec bins |
 |
 |
| Module-wise count rates for Quadrant D Data is divided into 100 sec bins |
 |
 |
| Parameter | Plot |
|---|---|
| CZT HV Monitor | 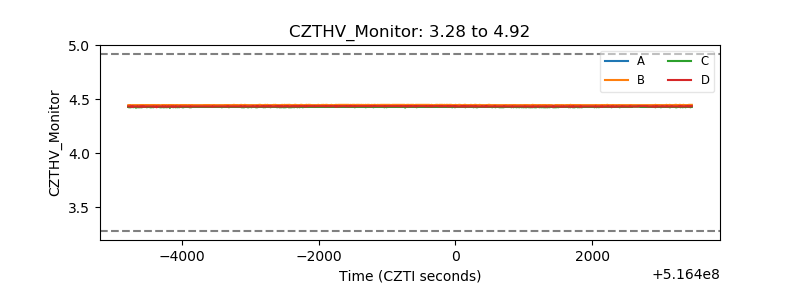 |
| D_VDD | 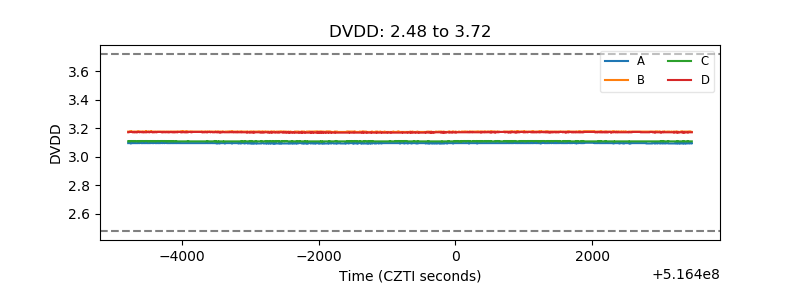 |
| Temperature 1 | 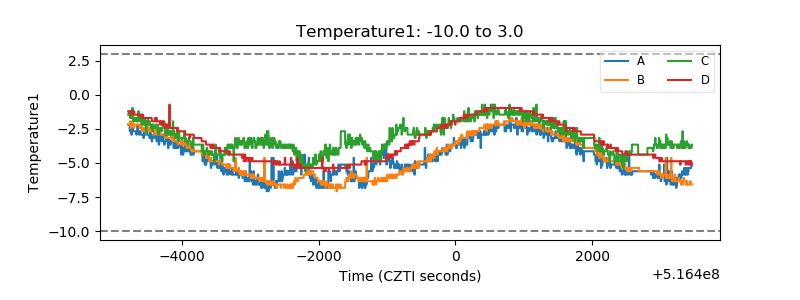 |
| Veto HV Monitor |  |
| Veto LLD | 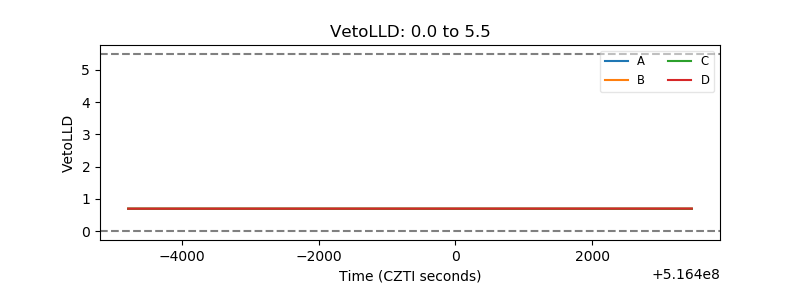 |
| Alpha Counter | 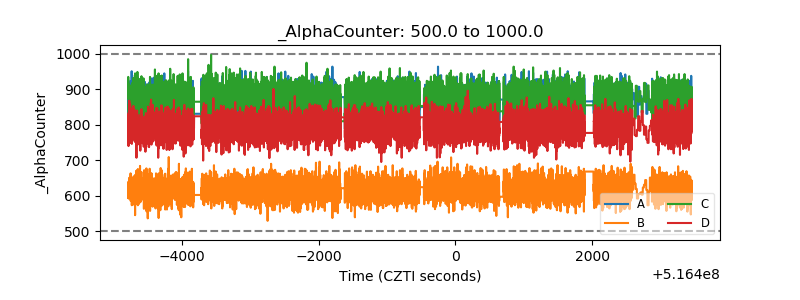 |
| _CPM_Rate | 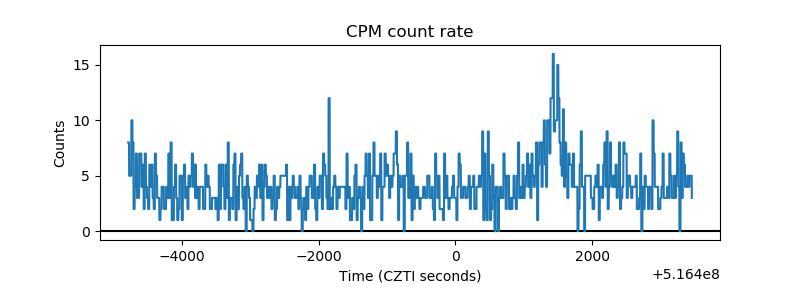 |
| CZT Counter | 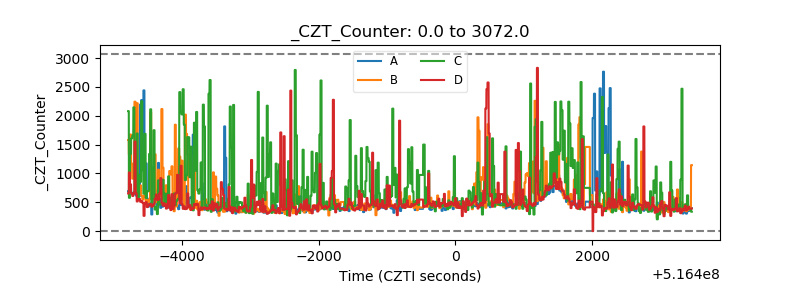 |
| +2.5 Volts monitor |  |
| +5 Volts monitor |  |
| _ROLL_ROT | 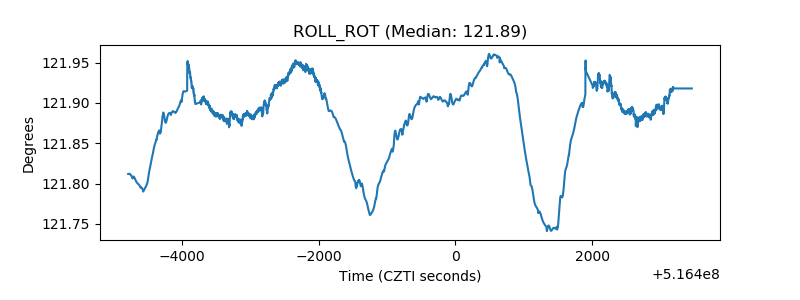 |
| _Roll_DEC | 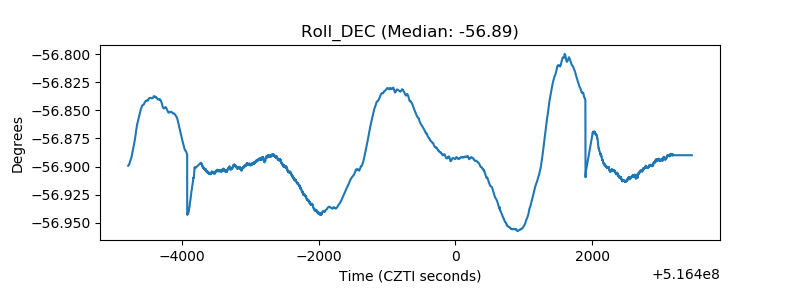 |
| _Roll_RA | 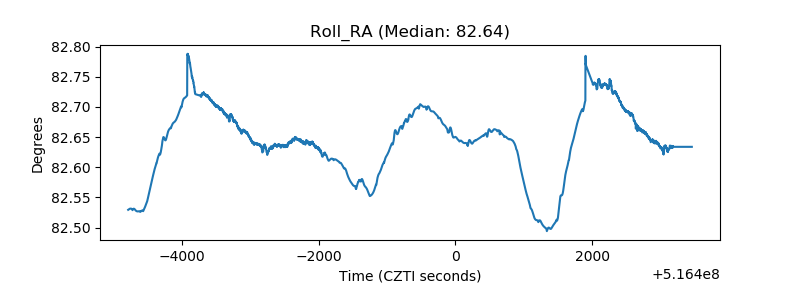 |
| Veto Counter | 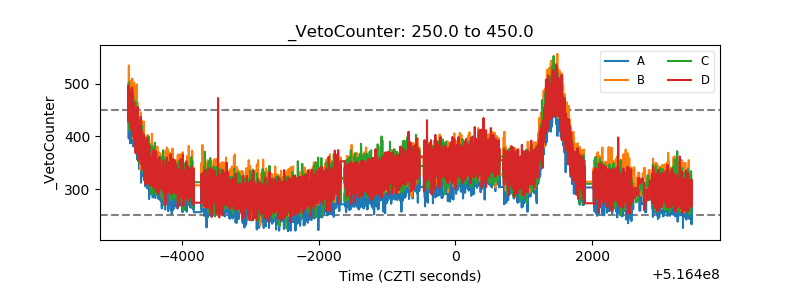 |