| Param | Original file | Final file |
|---|---|---|
| Filename | modeM0/AS1A14_113T09_9000006574_57489cztM0_level2.fits | modeM0/AS1A14_113T09_9000006574_57489cztM0_level2_quad_clean.evt |
| Size (bytes) | 1,229,929,920 | 231,240,960 |
| Size | 1.1 GB | 220.5 MB |
| Events in quadrant A | 8,669,760 | 1,472,526 |
| Events in quadrant B | 11,008,971 | 1,576,940 |
| Events in quadrant C | 13,438,243 | 1,374,332 |
| Events in quadrant D | 10,914,981 | 1,245,046 |
| Mode SS | |||
|---|---|---|---|
| Quadrant | BADHDUFLAG | Total packets | Discarded packets |
| A | 0 | 394 | 0 |
| B | 0 | 394 | 0 |
| C | 0 | 394 | 0 |
| D | 0 | 394 | 0 |
| Mode M9 | |||
|---|---|---|---|
| Quadrant | BADHDUFLAG | Total packets | Discarded packets |
| A | 0 | 15 | 0 |
| B | 0 | 15 | 0 |
| C | 0 | 15 | 0 |
| D | 0 | 15 | 0 |
| Mode M0 | |||
|---|---|---|---|
| Quadrant | BADHDUFLAG | Total packets | Discarded packets |
| A | 0 | 40519 | 3 |
| B | 0 | 46498 | 3 |
| C | 0 | 53545 | 3 |
| D | 0 | 46492 | 3 |
| Quadrant | Total seconds | Saturated seconds | Saturation percentage |
|---|---|---|---|
| A | 19316 | 175 | 0.905985% |
| B | 19317 | 786 | 4.068955% |
| C | 19317 | 976 | 5.052544% |
| D | 19317 | 601 | 3.111249% |
Noise dominated data is calculated using 1-second bins in cleaned event files. If a bin has >2000 counts, and if more than 50% of those come from <1% of pixels, then it is considered to be noise-dominated and hence unusable.
| Quadrant | # 1 sec bins | Bins with >0 counts | Bins with >2000 counts | High rate bins dominated by noise | Noise dominated (total time) | Noise dominated (detector-on time) | Marked lightcurve |
|---|---|---|---|---|---|---|---|
| A | 21115 | 19593 | 94 | 94 | 0.45% | 0.48% | 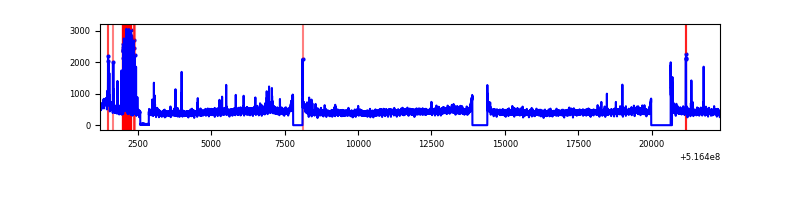 |
| B | 21116 | 19595 | 313 | 313 | 1.48% | 1.60% | 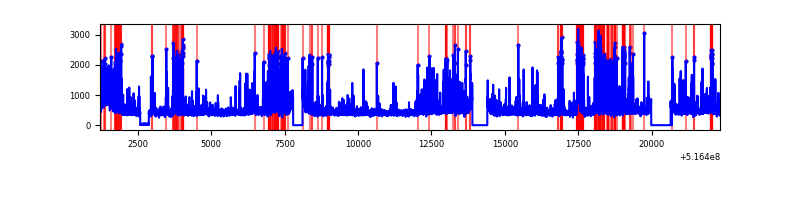 |
| C | 21116 | 19593 | 761 | 761 | 3.60% | 3.88% | 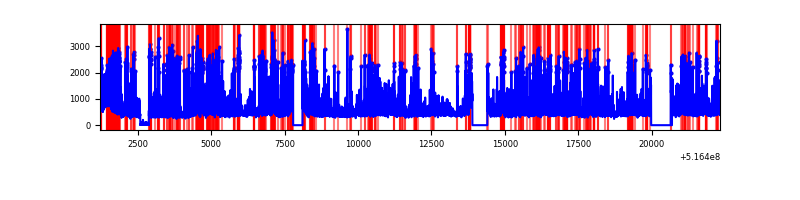 |
| D | 21116 | 19595 | 561 | 561 | 2.66% | 2.86% | 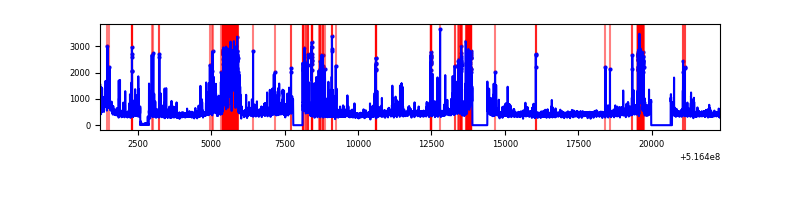 |
Top three noisy pixels from each quadrant. If the there are fewer than three noisy pixels in the level2.evt file, extra rows are filled as -1
| Pixel properties | Quadrant properties | ||||||
|---|---|---|---|---|---|---|---|
| Quadrant | DetID | PixID | Counts | Sigma | Mean | Median | Sigma |
| A | 13 | 248 | 405141 | 788.19 | 2090 | 2039 | 511.4 |
| A | 0 | 12 | 54924 | 103.41 | 2090 | 2039 | 511.4 |
| A | 7 | 64 | 31143 | 56.91 | 2090 | 2039 | 511.4 |
| B | 4 | 206 | 1893939 | 4354.79 | 2050 | 1971 | 434.5 |
| B | 5 | 185 | 214036 | 488.11 | 2050 | 1971 | 434.5 |
| B | 0 | 245 | 164482 | 374.05 | 2050 | 1971 | 434.5 |
| C | 15 | 224 | 4863460 | 9020.27 | 1988 | 1967 | 539.0 |
| C | 12 | 252 | 200983 | 369.26 | 1988 | 1967 | 539.0 |
| C | 14 | 254 | 181008 | 332.2 | 1988 | 1967 | 539.0 |
| D | 15 | 142 | 1284419 | 2288.32 | 1998 | 1912 | 560.5 |
| D | 7 | 96 | 589337 | 1048.12 | 1998 | 1912 | 560.5 |
| D | 8 | 240 | 367902 | 653.02 | 1998 | 1912 | 560.5 |
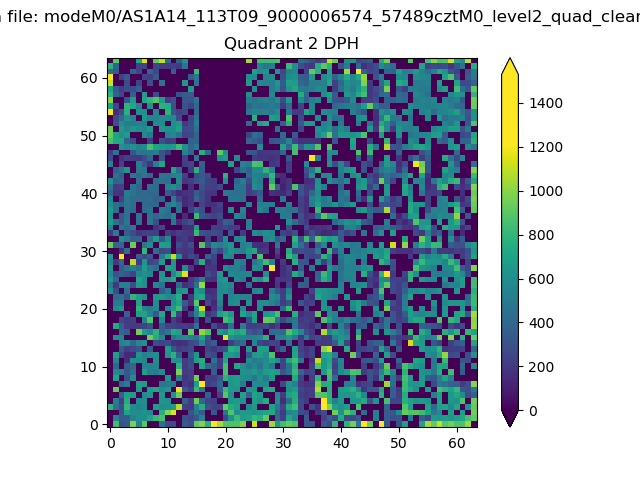
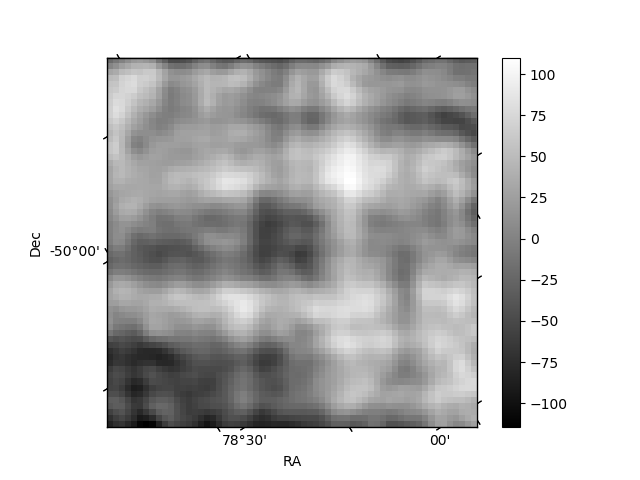
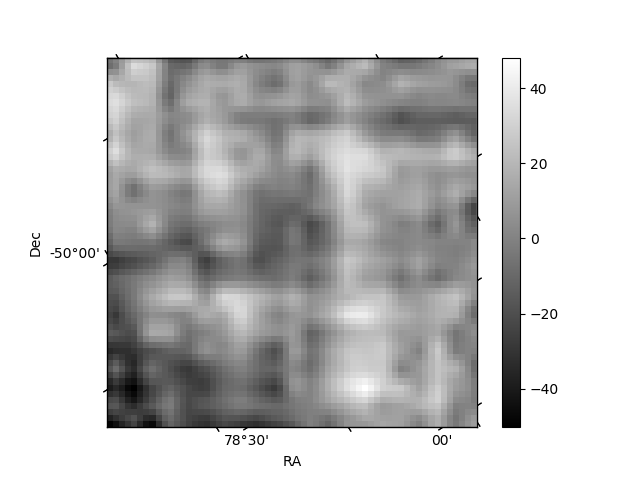
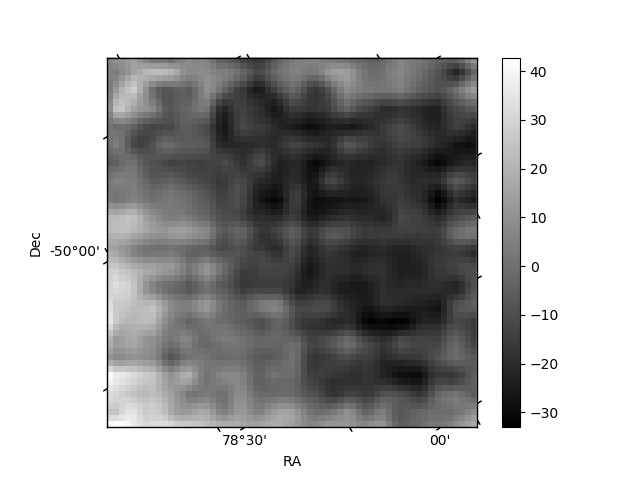
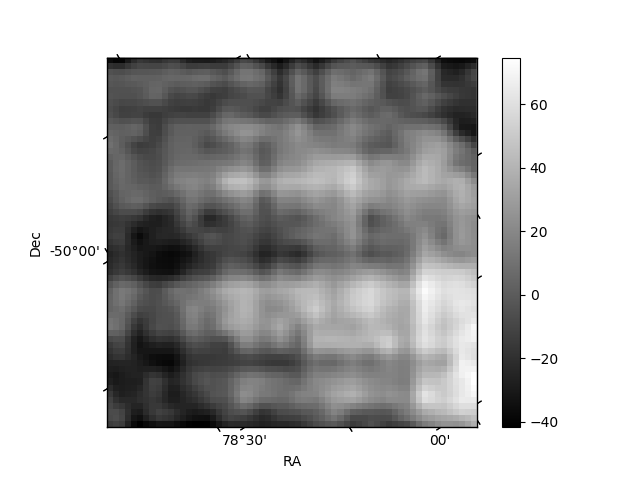
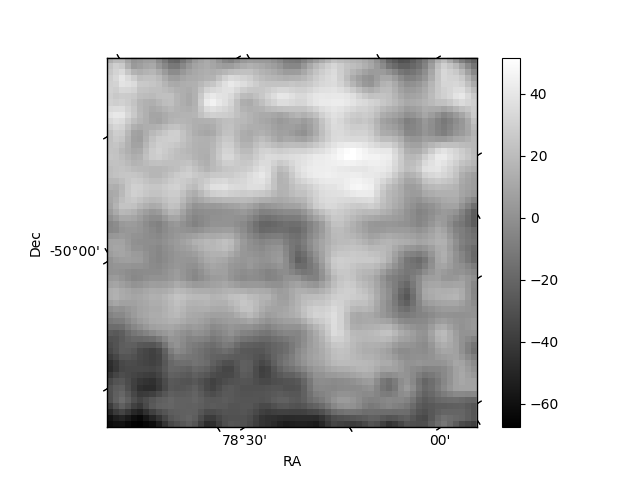
Histogram calculated using DETX and DETY for each event in the final _common_clean file
| Quadrant A | 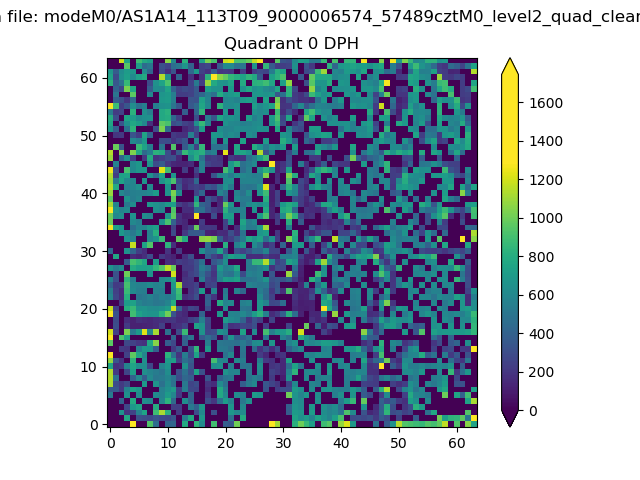 |
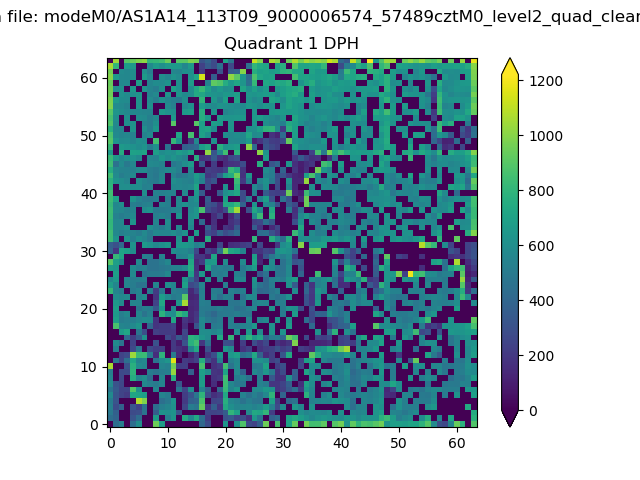 |
Quadrant B |
|---|---|---|---|
| Quadrant D | 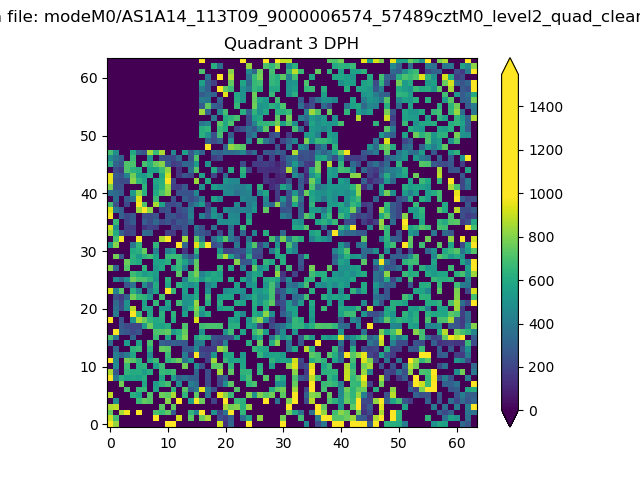 |
 |
Quadrant C |
| Plot type | Count rate plots | Images |
|---|---|---|
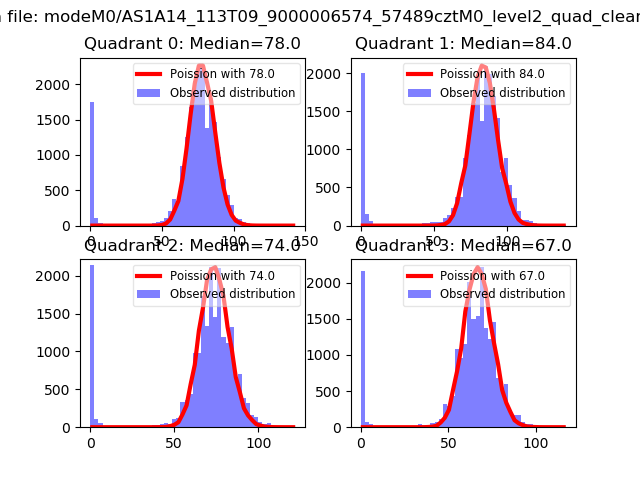
| Comparison with Poisson distribution Blue bars denote a histogram of data divided into 1 sec bins. Red curve is a Poisson curve with rate = median count rate of data. |
 |
 |
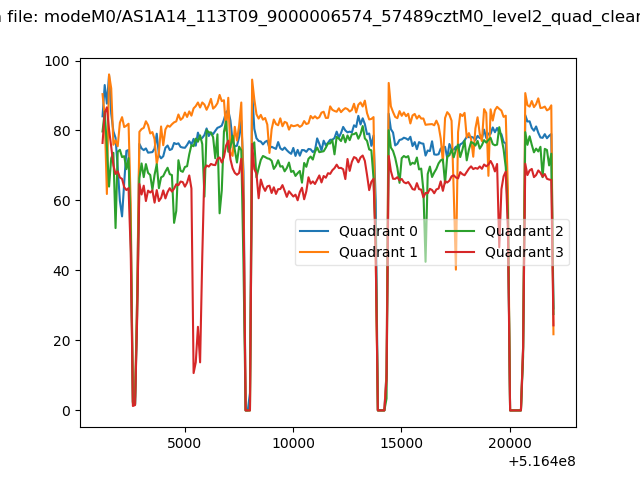
| Quadrant-wise count rates Data is divided into 100 sec bins |
 |
|
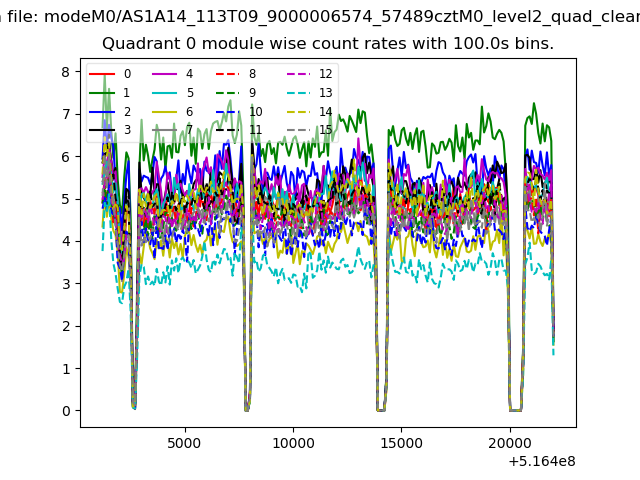
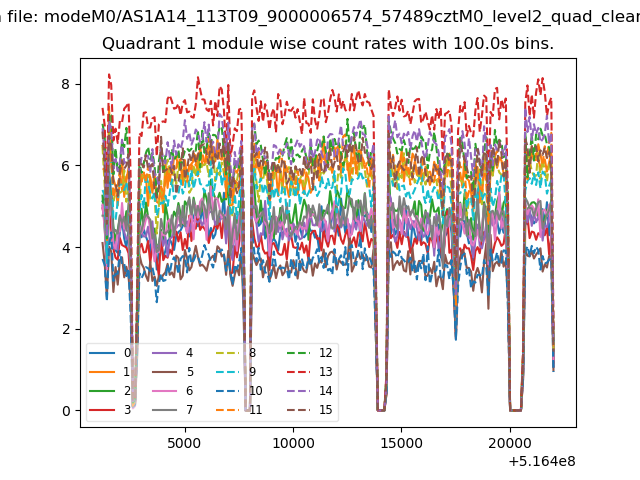
| Module-wise count rates for Quadrant A Data is divided into 100 sec bins |
 |
 |
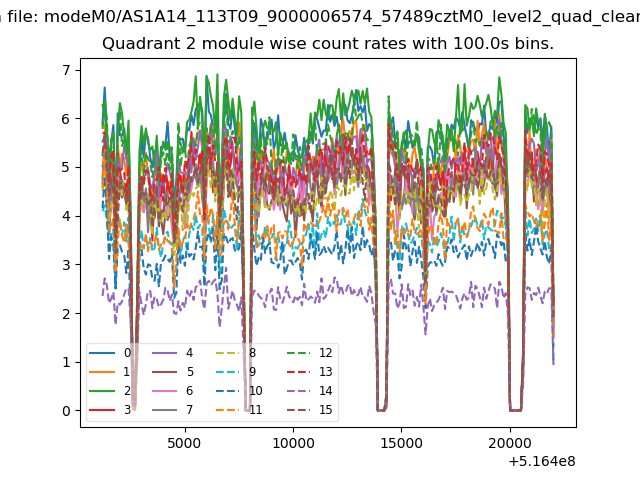
| Module-wise count rates for Quadrant B Data is divided into 100 sec bins |
 |
 |
| Module-wise count rates for Quadrant C Data is divided into 100 sec bins |
 |
 |
| Module-wise count rates for Quadrant D Data is divided into 100 sec bins |
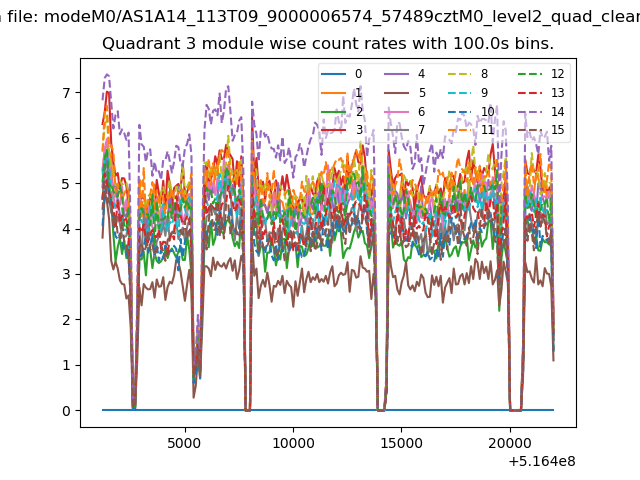 |
 |
| Parameter | Plot |
|---|---|
| CZT HV Monitor | 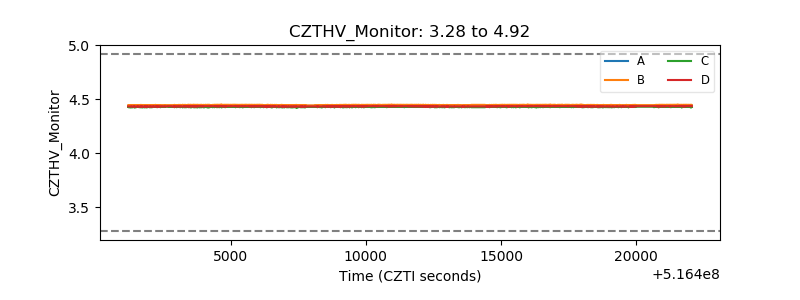 |
| D_VDD | 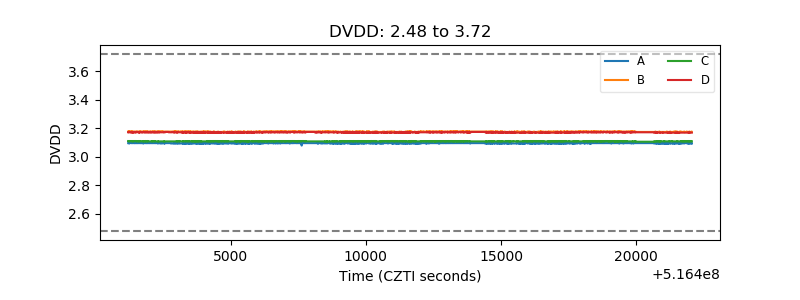 |
| Temperature 1 | 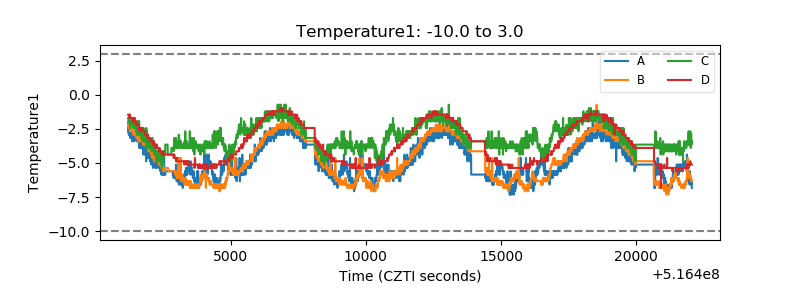 |
| Veto HV Monitor | 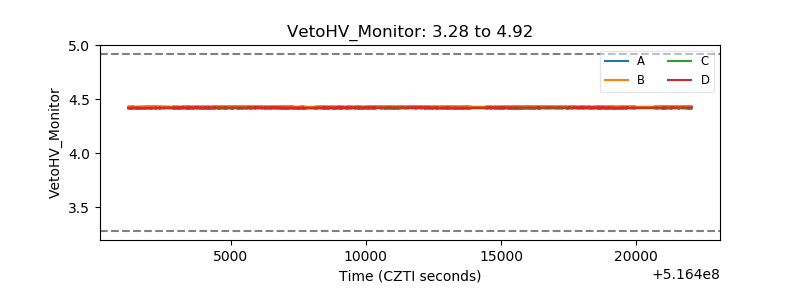 |
| Veto LLD | 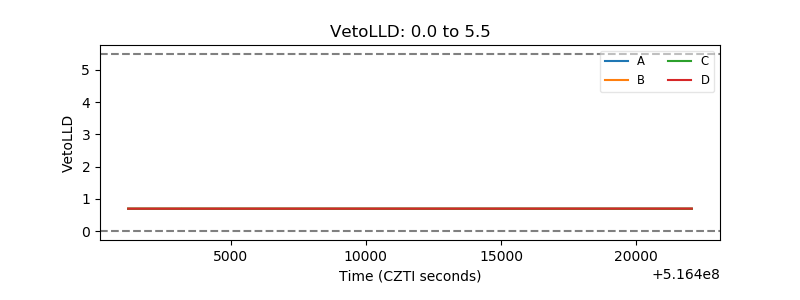 |
| Alpha Counter | 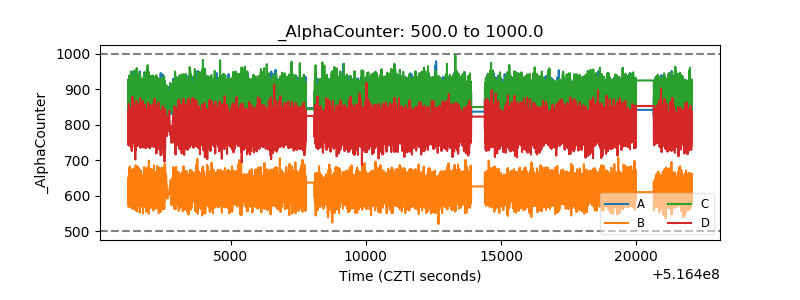 |
| _CPM_Rate | 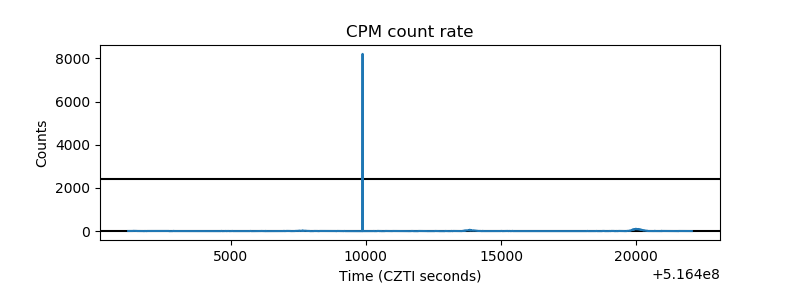 |
| CZT Counter | 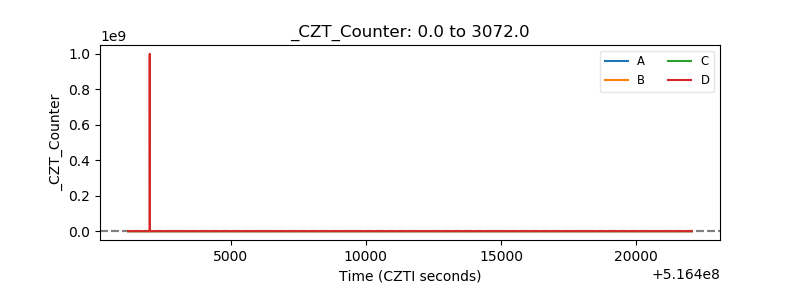 |
| +2.5 Volts monitor | 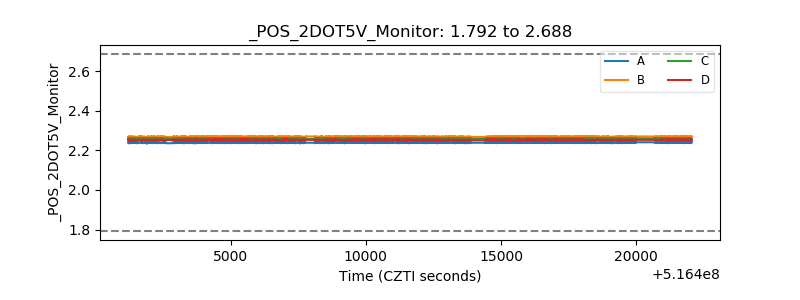 |
| +5 Volts monitor | 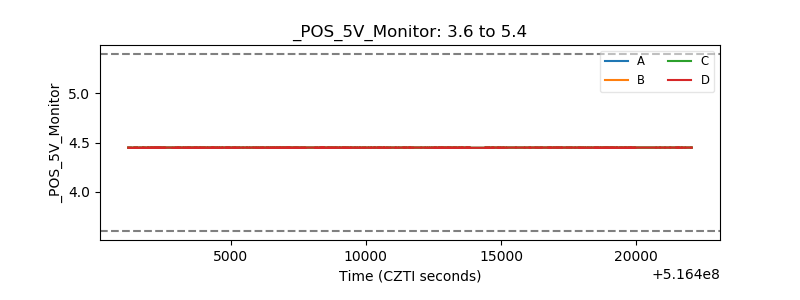 |
| _ROLL_ROT | 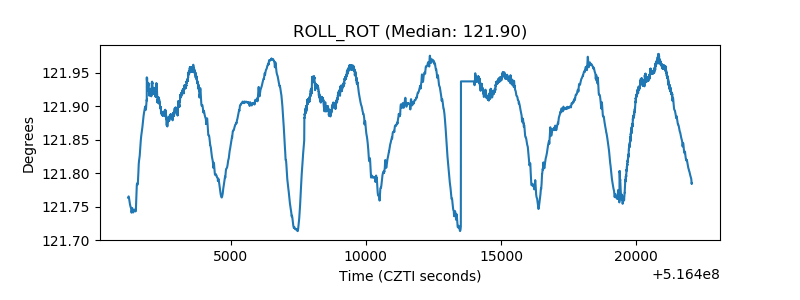 |
| _Roll_DEC | 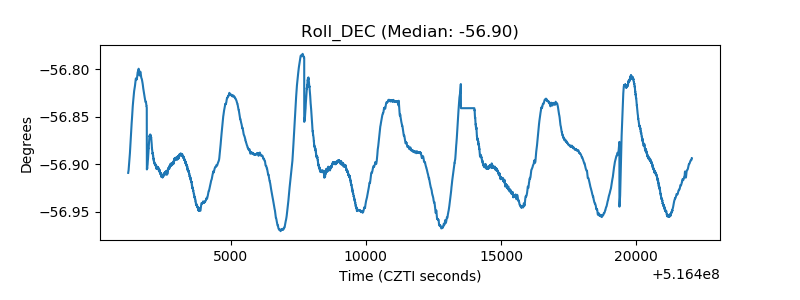 |
| _Roll_RA | 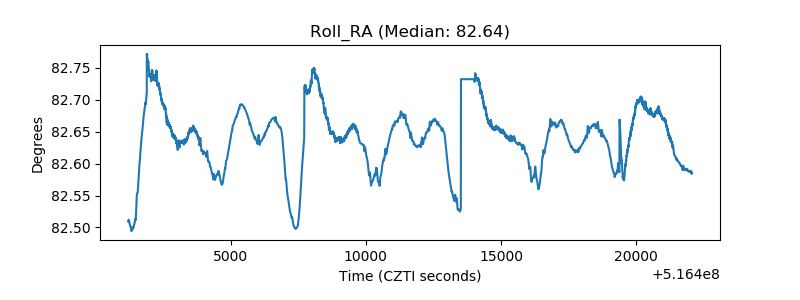 |
| Veto Counter | 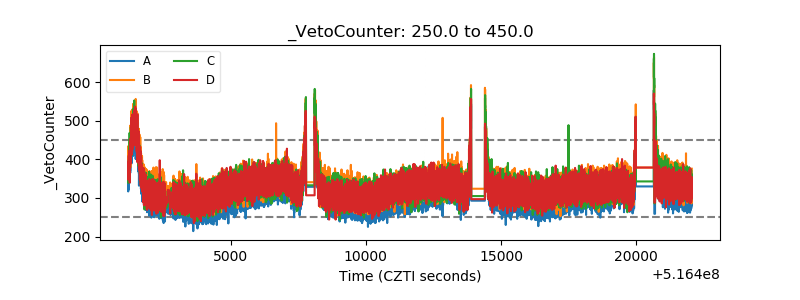 |