| Param | Original file | Final file |
|---|---|---|
| Filename | modeM0/AS1A14_113T09_9000006574_57490cztM0_level2.fits | modeM0/AS1A14_113T09_9000006574_57490cztM0_level2_quad_clean.evt |
| Size (bytes) | 425,505,600 | 99,803,520 |
| Size | 405.8 MB | 95.2 MB |
| Events in quadrant A | 3,024,412 | 658,928 |
| Events in quadrant B | 4,331,004 | 677,172 |
| Events in quadrant C | 4,358,799 | 617,915 |
| Events in quadrant D | 3,496,313 | 583,698 |
| Mode SS | |||
|---|---|---|---|
| Quadrant | BADHDUFLAG | Total packets | Discarded packets |
| A | 0 | 142 | 0 |
| B | 0 | 142 | 0 |
| C | 0 | 142 | 0 |
| D | 0 | 142 | 0 |
| Mode M9 | |||
|---|---|---|---|
| Quadrant | BADHDUFLAG | Total packets | Discarded packets |
| A | 0 | 10 | 0 |
| B | 0 | 11 | 0 |
| C | 0 | 11 | 0 |
| D | 0 | 11 | 0 |
| Mode M0 | |||
|---|---|---|---|
| Quadrant | BADHDUFLAG | Total packets | Discarded packets |
| A | 0 | 14139 | 2 |
| B | 0 | 17700 | 2 |
| C | 0 | 17762 | 2 |
| D | 0 | 15396 | 2 |
| Quadrant | Total seconds | Saturated seconds | Saturation percentage |
|---|---|---|---|
| A | 6945 | 54 | 0.777538% |
| B | 6945 | 398 | 5.730742% |
| C | 6945 | 180 | 2.591793% |
| D | 6945 | 138 | 1.987041% |
Noise dominated data is calculated using 1-second bins in cleaned event files. If a bin has >2000 counts, and if more than 50% of those come from <1% of pixels, then it is considered to be noise-dominated and hence unusable.
| Quadrant | # 1 sec bins | Bins with >0 counts | Bins with >2000 counts | High rate bins dominated by noise | Noise dominated (total time) | Noise dominated (detector-on time) | Marked lightcurve |
|---|---|---|---|---|---|---|---|
| A | 7790 | 6945 | 3 | 3 | 0.04% | 0.04% | 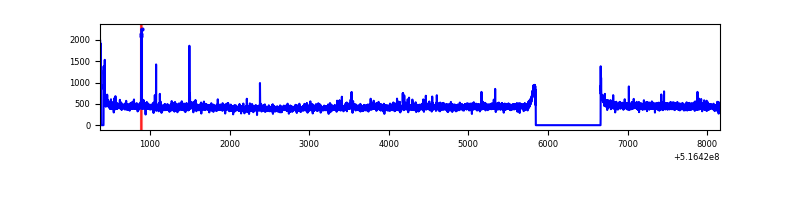 |
| B | 7789 | 6945 | 237 | 237 | 3.04% | 3.41% | 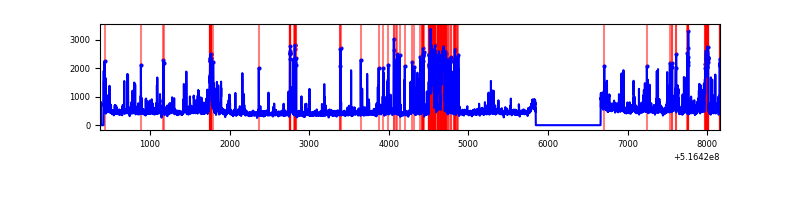 |
| C | 7790 | 6946 | 113 | 113 | 1.45% | 1.63% | 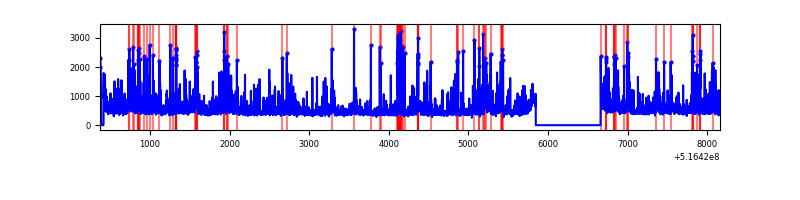 |
| D | 7790 | 6946 | 85 | 85 | 1.09% | 1.22% | 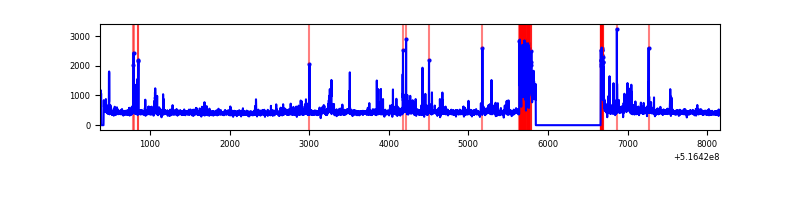 |
Top three noisy pixels from each quadrant. If the there are fewer than three noisy pixels in the level2.evt file, extra rows are filled as -1
| Pixel properties | Quadrant properties | ||||||
|---|---|---|---|---|---|---|---|
| Quadrant | DetID | PixID | Counts | Sigma | Mean | Median | Sigma |
| A | 7 | 64 | 32897 | 173.47 | 752 | 734 | 185.4 |
| A | 3 | 62 | 17869 | 92.42 | 752 | 734 | 185.4 |
| A | 4 | 3 | 17286 | 89.27 | 752 | 734 | 185.4 |
| B | 4 | 206 | 831014 | 5349.14 | 730 | 703 | 155.2 |
| B | 5 | 185 | 259780 | 1669.06 | 730 | 703 | 155.2 |
| B | 0 | 213 | 94820 | 606.33 | 730 | 703 | 155.2 |
| C | 15 | 224 | 1079477 | 5384.25 | 731 | 725 | 200.4 |
| C | 14 | 254 | 183613 | 912.83 | 731 | 725 | 200.4 |
| C | 12 | 250 | 83706 | 414.17 | 731 | 725 | 200.4 |
| D | 15 | 142 | 269082 | 1320.31 | 728 | 697 | 203.3 |
| D | 8 | 240 | 114173 | 558.24 | 728 | 697 | 203.3 |
| D | 12 | 248 | 68867 | 335.36 | 728 | 697 | 203.3 |
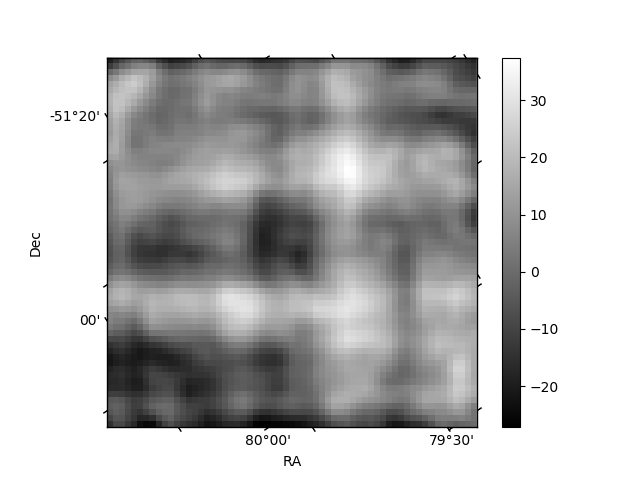
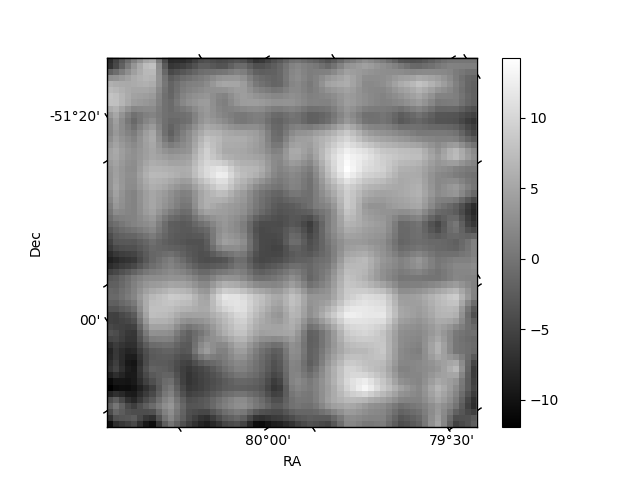
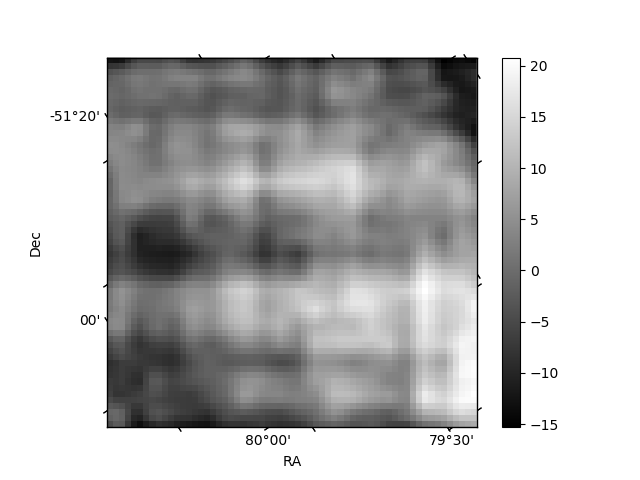
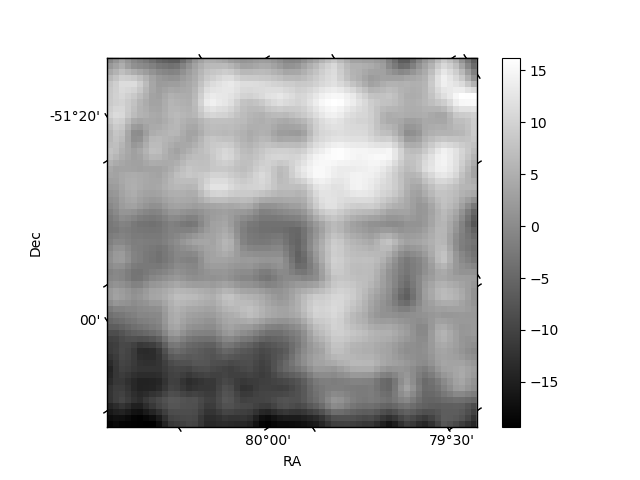
Histogram calculated using DETX and DETY for each event in the final _common_clean file
| Quadrant A | 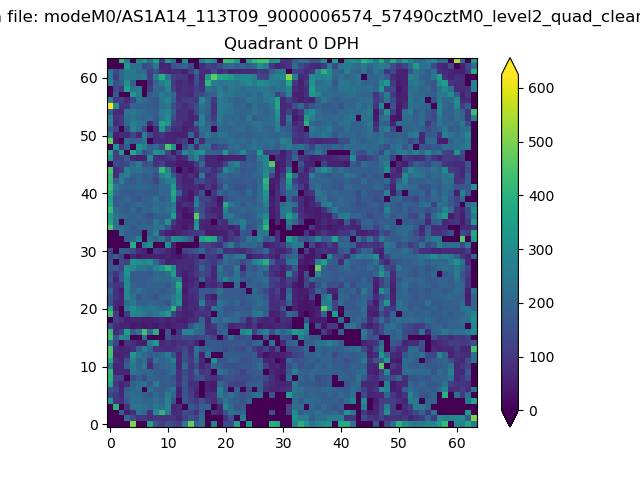 |
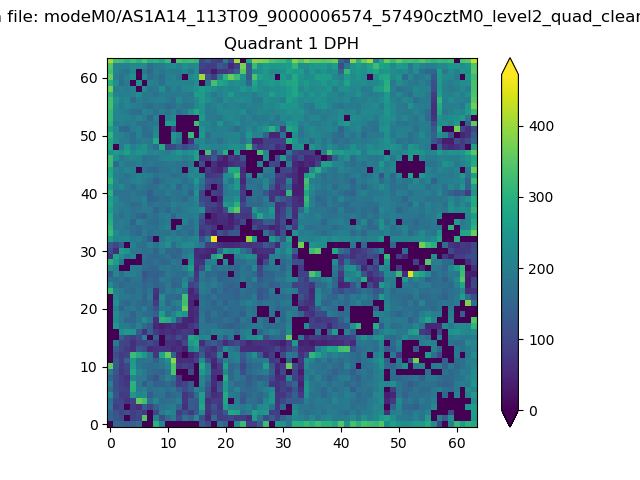 |
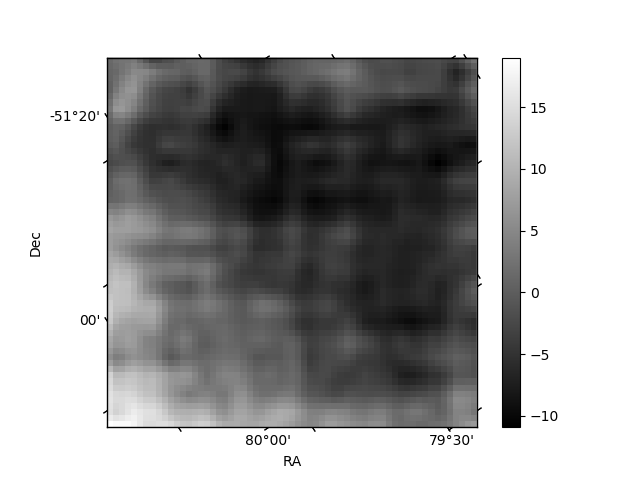
Quadrant B |
|---|---|---|---|
| Quadrant D | 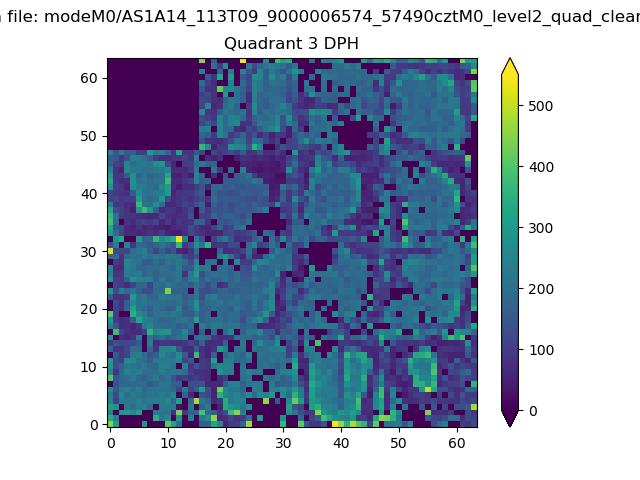 |
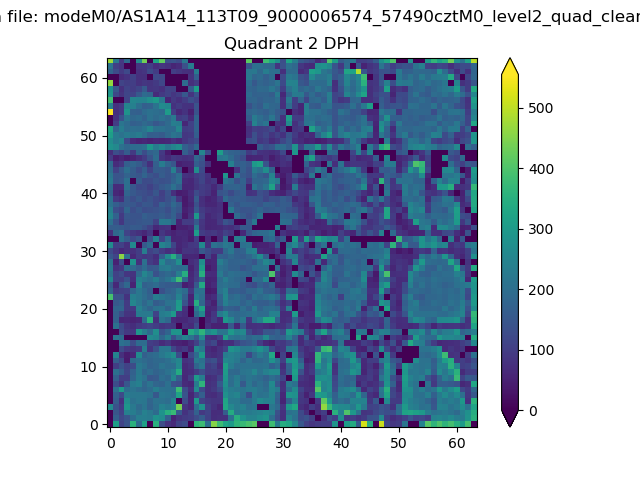 |
Quadrant C |
| Plot type | Count rate plots | Images |
|---|---|---|
| Comparison with Poisson distribution Blue bars denote a histogram of data divided into 1 sec bins. Red curve is a Poisson curve with rate = median count rate of data. |
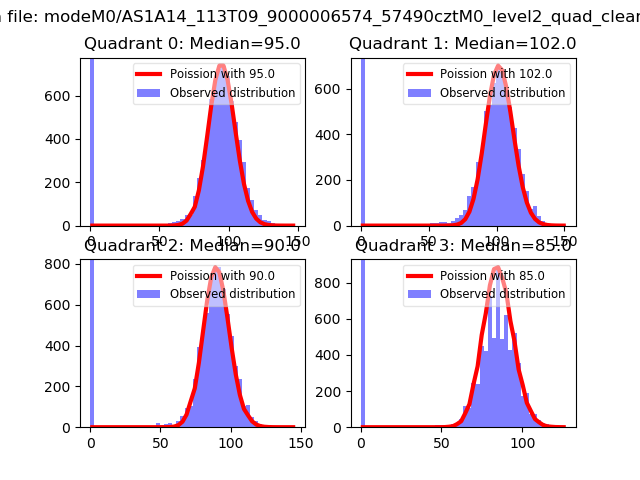 |
 |
| Quadrant-wise count rates Data is divided into 100 sec bins |
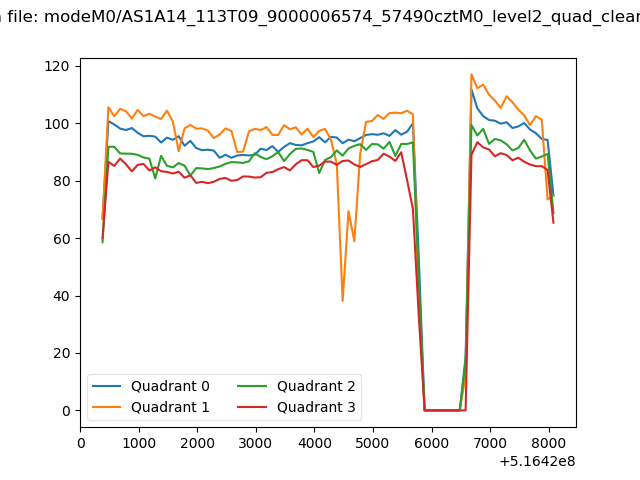 |
|
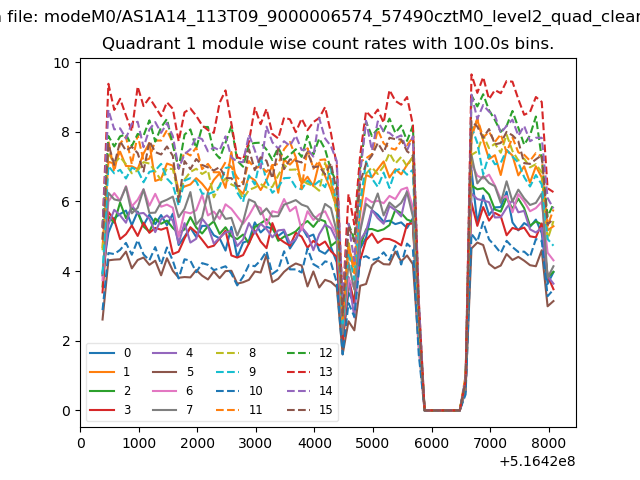
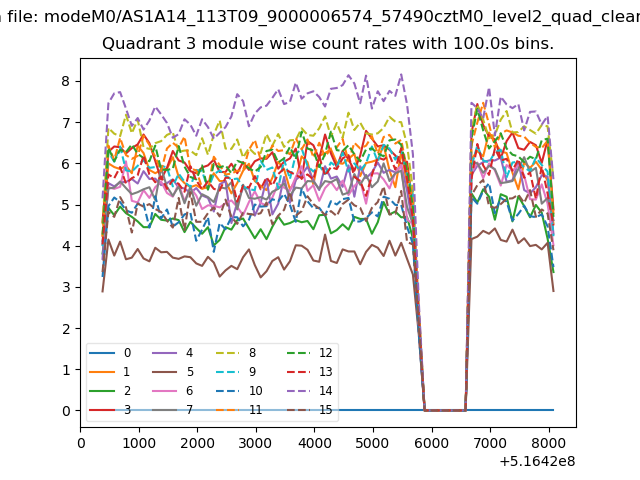
| Module-wise count rates for Quadrant A Data is divided into 100 sec bins |
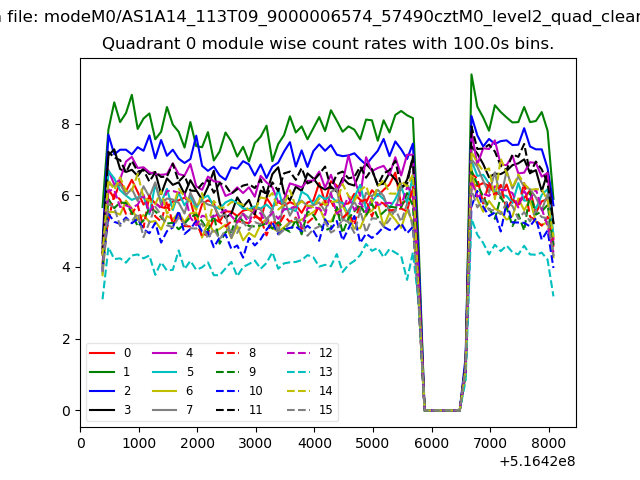 |
 |
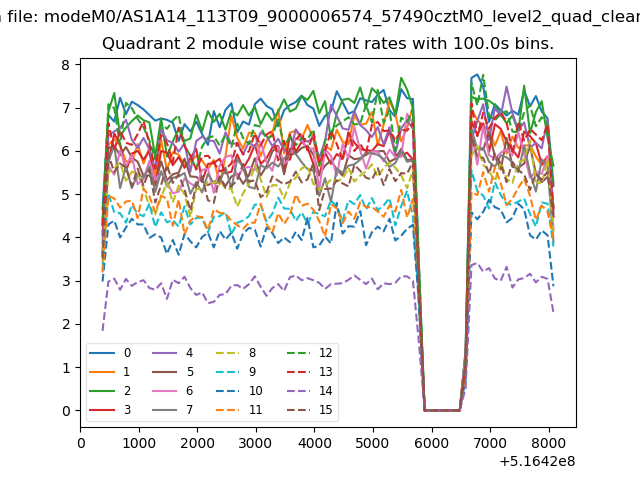
| Module-wise count rates for Quadrant B Data is divided into 100 sec bins |
 |
 |
| Module-wise count rates for Quadrant C Data is divided into 100 sec bins |
 |
 |
| Module-wise count rates for Quadrant D Data is divided into 100 sec bins |
 |
 |
| Parameter | Plot |
|---|---|
| CZT HV Monitor | 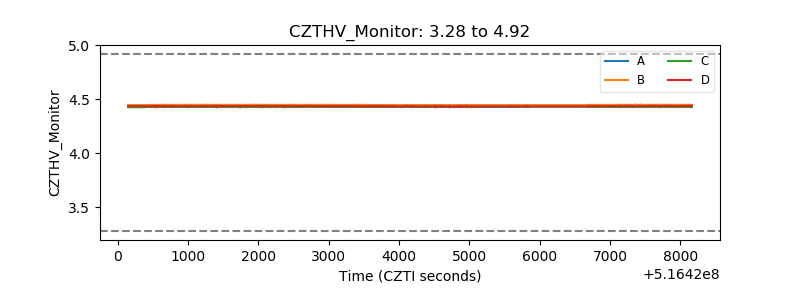 |
| D_VDD | 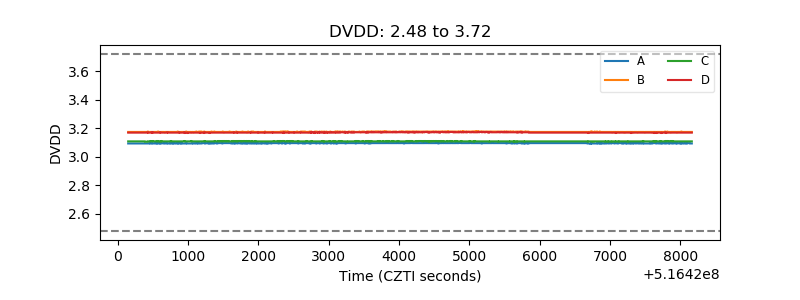 |
| Temperature 1 | 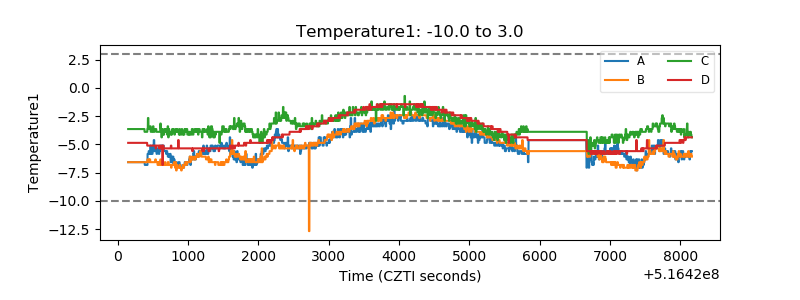 |
| Veto HV Monitor | 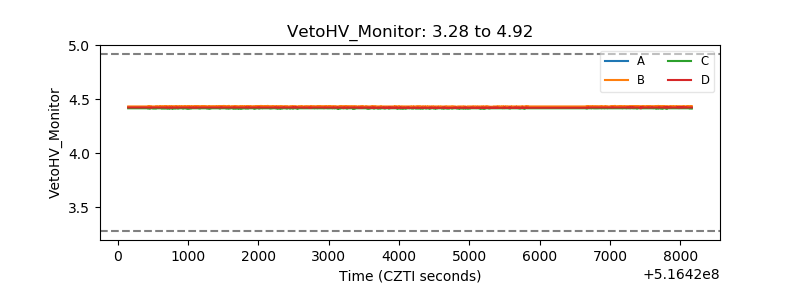 |
| Veto LLD | 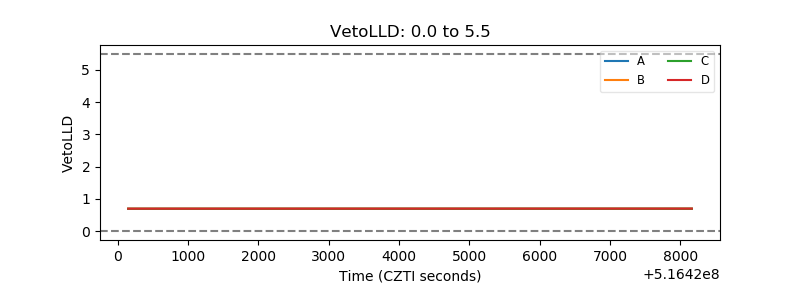 |
| Alpha Counter | 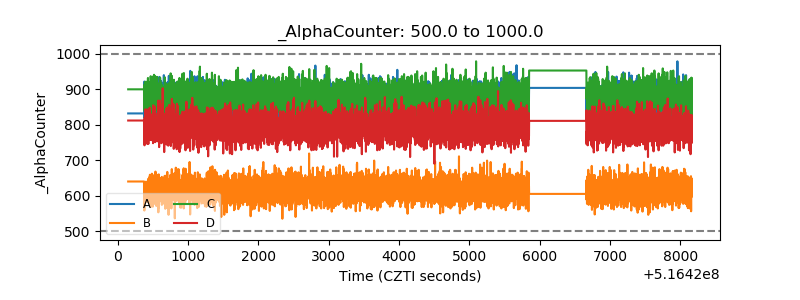 |
| _CPM_Rate | 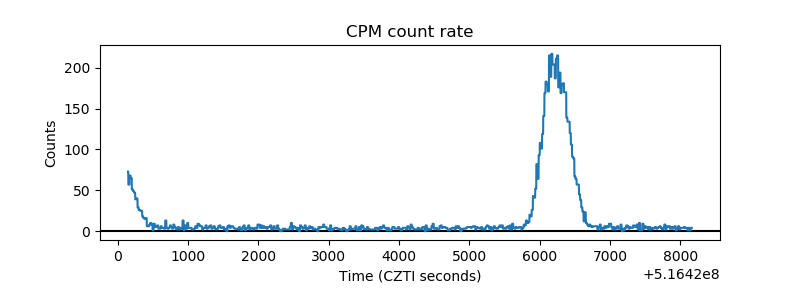 |
| CZT Counter | 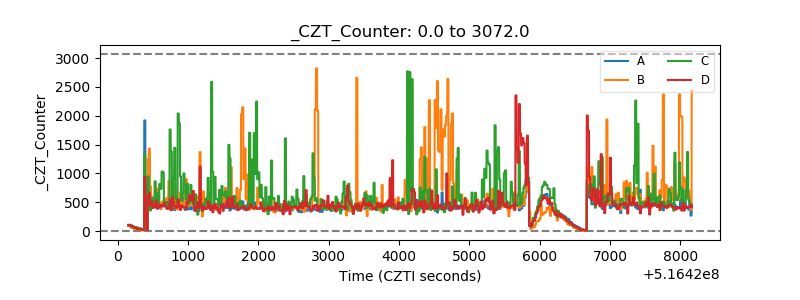 |
| +2.5 Volts monitor | 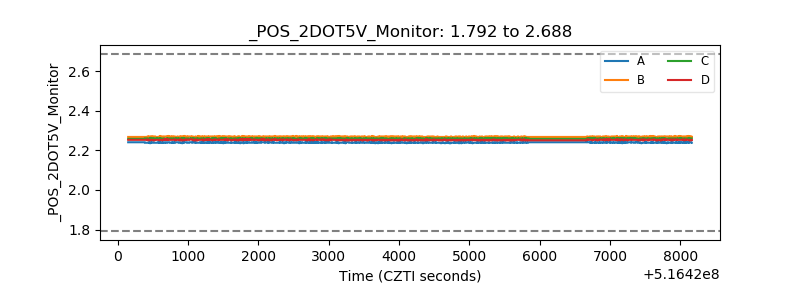 |
| +5 Volts monitor | 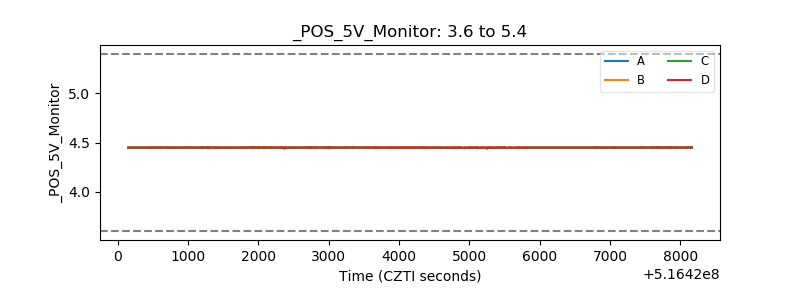 |
| _ROLL_ROT | 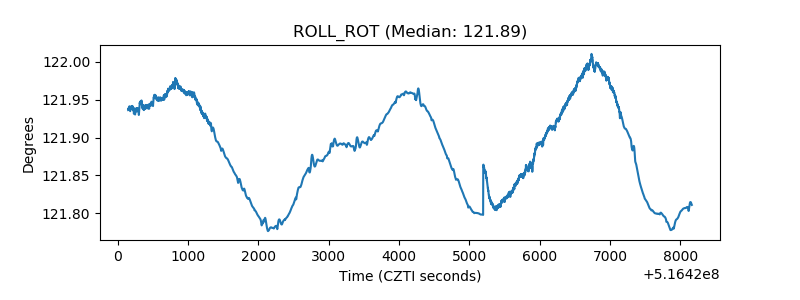 |
| _Roll_DEC | 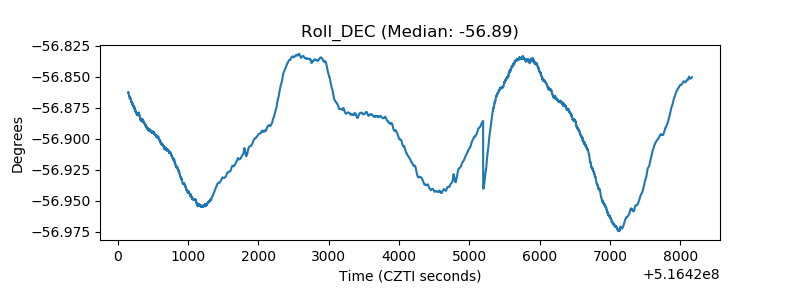 |
| _Roll_RA | 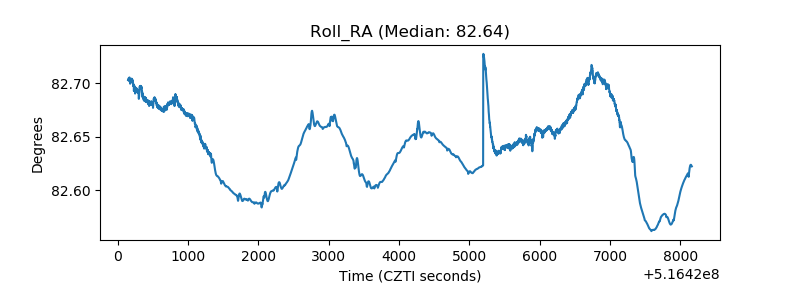 |
| Veto Counter | 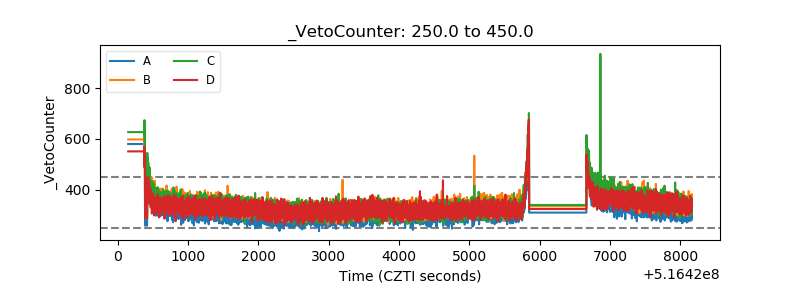 |