| Param | Original file | Final file |
|---|---|---|
| Filename | modeM0/AS1A14_113T09_9000006574_57494cztM0_level2.fits | modeM0/AS1A14_113T09_9000006574_57494cztM0_level2_quad_clean.evt |
| Size (bytes) | 465,399,360 | 101,243,520 |
| Size | 443.8 MB | 96.6 MB |
| Events in quadrant A | 3,208,154 | 680,600 |
| Events in quadrant B | 3,993,831 | 713,191 |
| Events in quadrant C | 6,314,606 | 588,376 |
| Events in quadrant D | 3,188,287 | 614,611 |
| Mode SS | |||
|---|---|---|---|
| Quadrant | BADHDUFLAG | Total packets | Discarded packets |
| A | 0 | 138 | 0 |
| B | 0 | 138 | 0 |
| C | 0 | 138 | 0 |
| D | 0 | 138 | 0 |
| Mode M9 | |||
|---|---|---|---|
| Quadrant | BADHDUFLAG | Total packets | Discarded packets |
| A | 0 | 11 | 0 |
| B | 0 | 11 | 0 |
| C | 0 | 11 | 0 |
| D | 0 | 11 | 0 |
| Mode M0 | |||
|---|---|---|---|
| Quadrant | BADHDUFLAG | Total packets | Discarded packets |
| A | 0 | 14248 | 2 |
| B | 0 | 16432 | 2 |
| C | 0 | 23516 | 2 |
| D | 0 | 14144 | 2 |
| Quadrant | Total seconds | Saturated seconds | Saturation percentage |
|---|---|---|---|
| A | 6722 | 61 | 0.907468% |
| B | 6722 | 242 | 3.600119% |
| C | 6722 | 887 | 13.195478% |
| D | 6722 | 70 | 1.041357% |
Noise dominated data is calculated using 1-second bins in cleaned event files. If a bin has >2000 counts, and if more than 50% of those come from <1% of pixels, then it is considered to be noise-dominated and hence unusable.
| Quadrant | # 1 sec bins | Bins with >0 counts | Bins with >2000 counts | High rate bins dominated by noise | Noise dominated (total time) | Noise dominated (detector-on time) | Marked lightcurve |
|---|---|---|---|---|---|---|---|
| A | 7842 | 6722 | 7 | 7 | 0.09% | 0.10% | 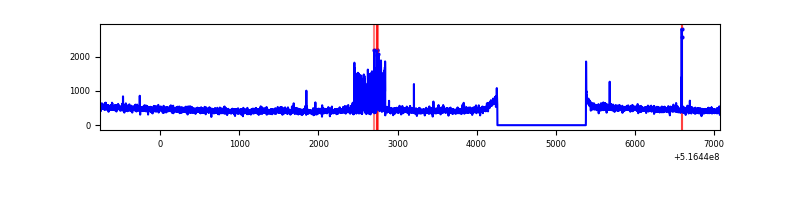 |
| B | 7842 | 6722 | 118 | 118 | 1.50% | 1.76% | 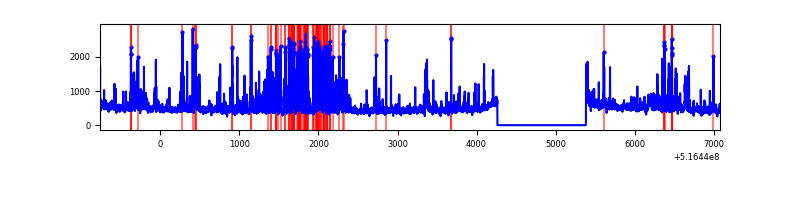 |
| C | 7841 | 6721 | 847 | 847 | 10.80% | 12.60% | 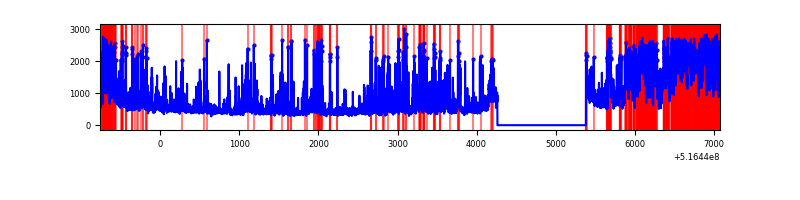 |
| D | 7842 | 6722 | 18 | 18 | 0.23% | 0.27% | 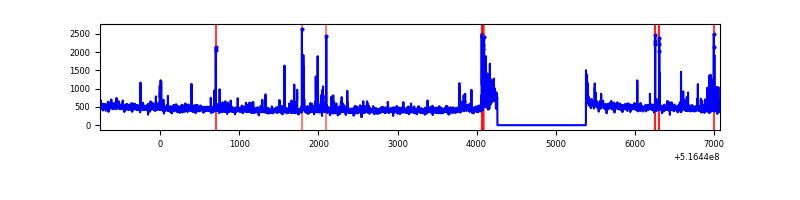 |
Top three noisy pixels from each quadrant. If the there are fewer than three noisy pixels in the level2.evt file, extra rows are filled as -1
| Pixel properties | Quadrant properties | ||||||
|---|---|---|---|---|---|---|---|
| Quadrant | DetID | PixID | Counts | Sigma | Mean | Median | Sigma |
| A | 13 | 153 | 201805 | 1087.81 | 758 | 739 | 184.8 |
| A | 0 | 12 | 37606 | 199.46 | 758 | 739 | 184.8 |
| A | 4 | 3 | 11757 | 59.61 | 758 | 739 | 184.8 |
| B | 4 | 206 | 716794 | 4579.05 | 732 | 705 | 156.4 |
| B | 5 | 185 | 131362 | 835.49 | 732 | 705 | 156.4 |
| B | 0 | 213 | 62416 | 394.61 | 732 | 705 | 156.4 |
| C | 9 | 38 | 1890593 | 9766.02 | 708 | 699 | 193.5 |
| C | 15 | 224 | 1256294 | 6488.28 | 708 | 699 | 193.5 |
| C | 13 | 3 | 203167 | 1046.25 | 708 | 699 | 193.5 |
| D | 5 | 173 | 53128 | 250.63 | 741 | 707 | 209.2 |
| D | 8 | 240 | 46324 | 218.1 | 741 | 707 | 209.2 |
| D | 15 | 201 | 40248 | 189.05 | 741 | 707 | 209.2 |
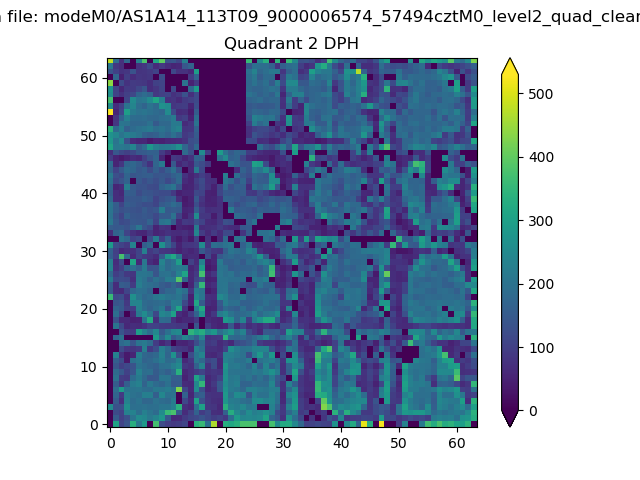
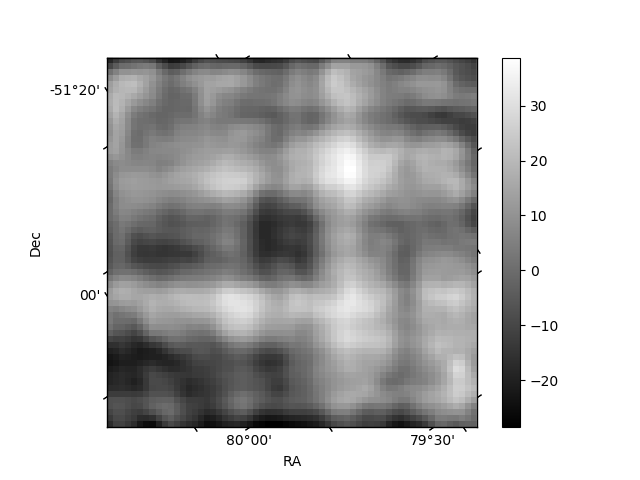
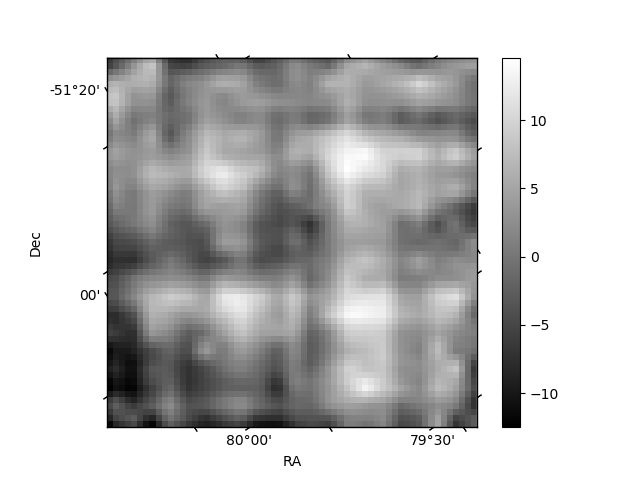
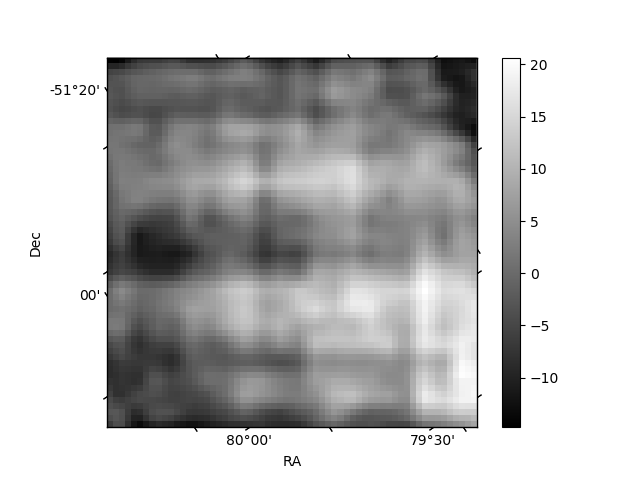
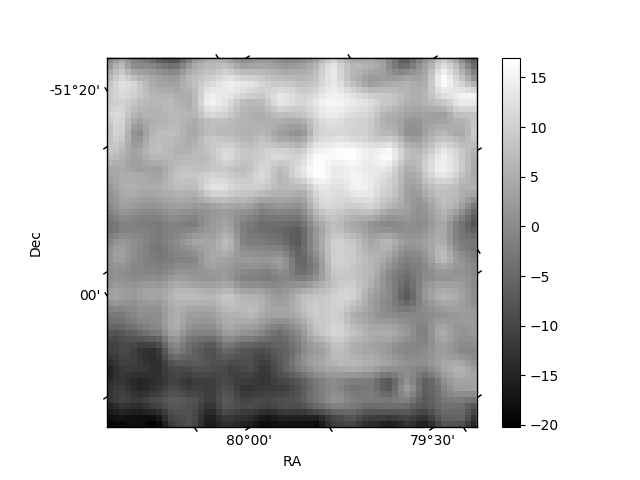
Histogram calculated using DETX and DETY for each event in the final _common_clean file
| Quadrant A | 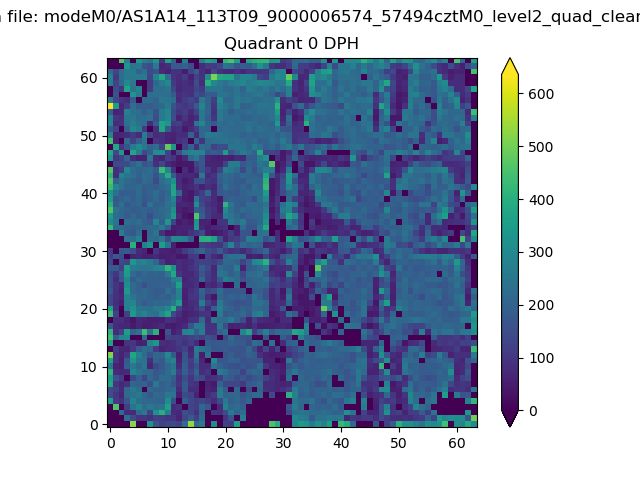 |
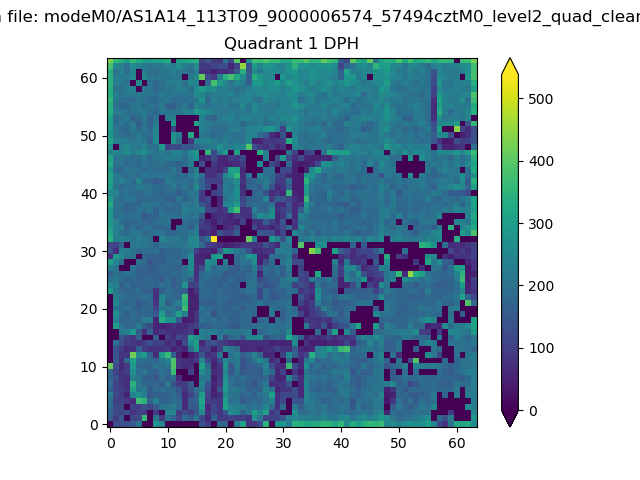 |
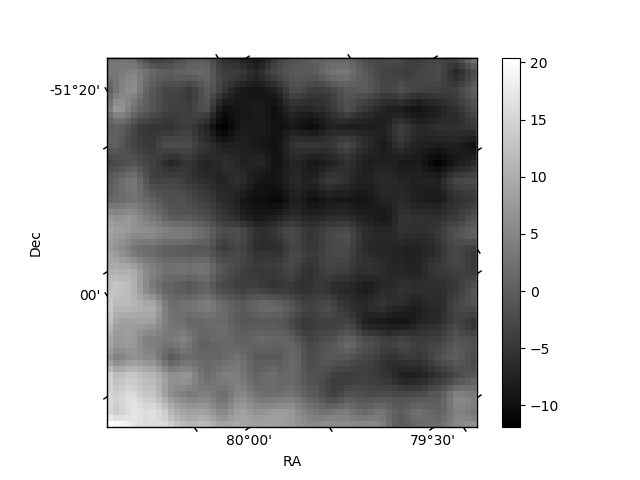
Quadrant B |
|---|---|---|---|
| Quadrant D | 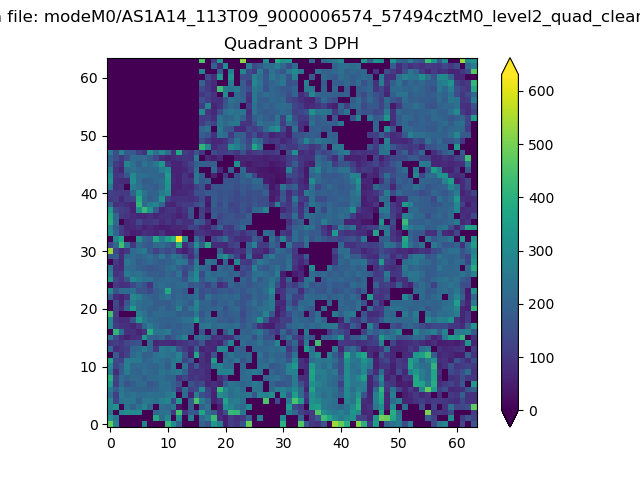 |
 |
Quadrant C |
| Plot type | Count rate plots | Images |
|---|---|---|
| Comparison with Poisson distribution Blue bars denote a histogram of data divided into 1 sec bins. Red curve is a Poisson curve with rate = median count rate of data. |
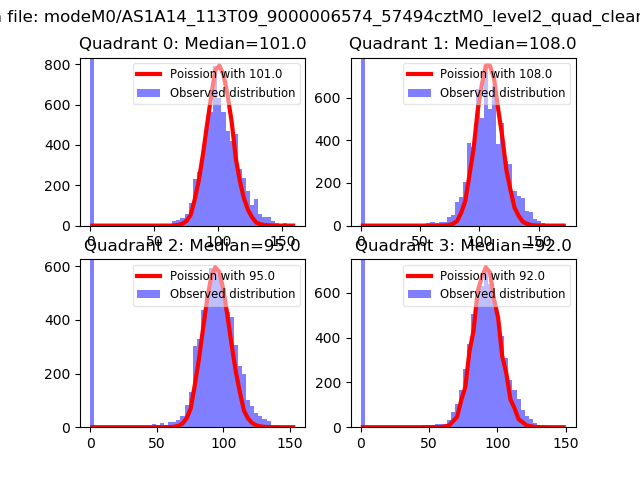 |
 |
| Quadrant-wise count rates Data is divided into 100 sec bins |
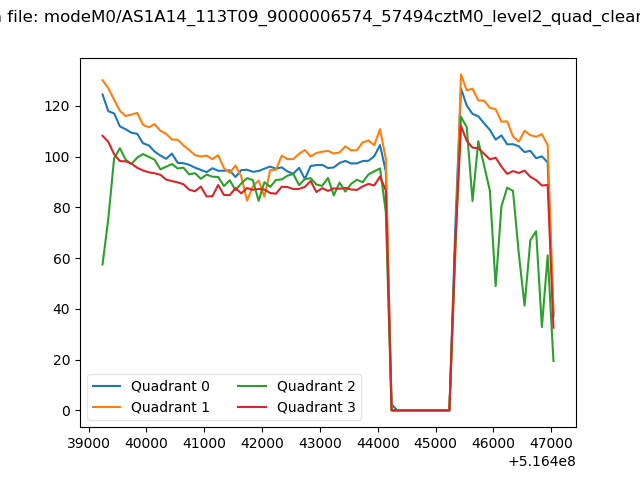 |
|
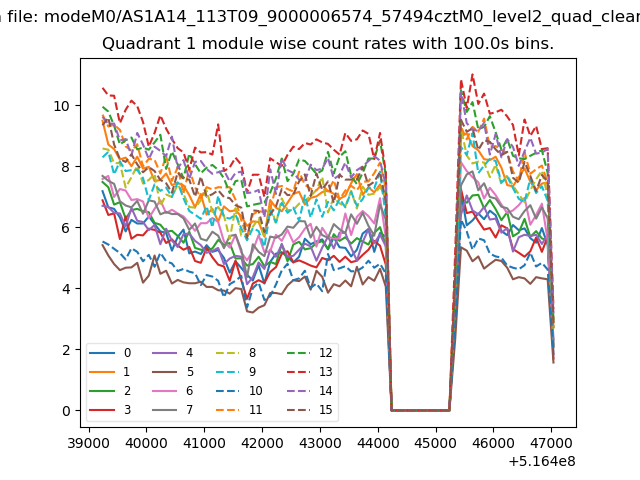
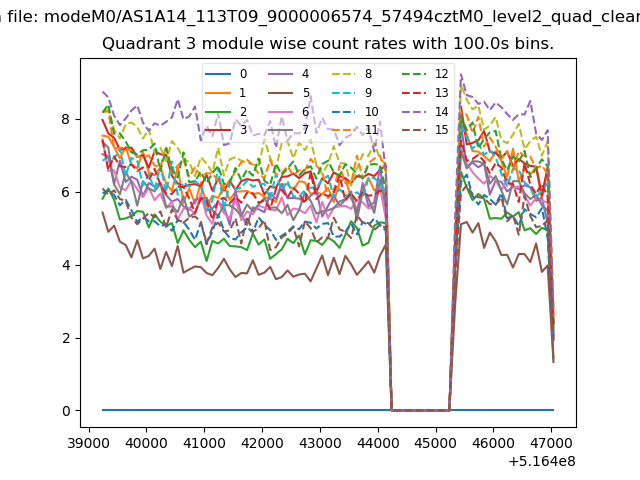
| Module-wise count rates for Quadrant A Data is divided into 100 sec bins |
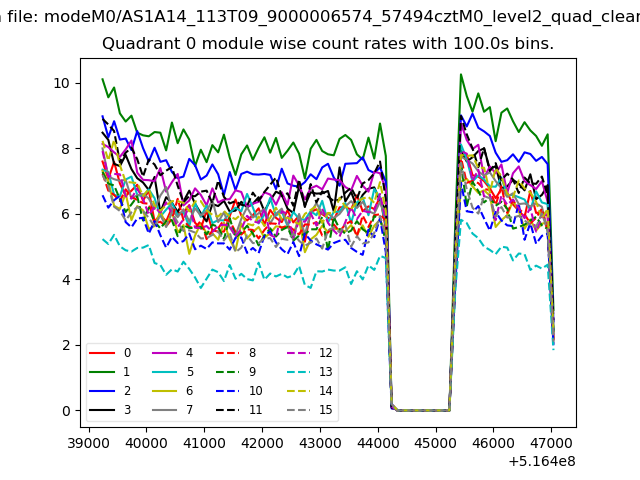 |
 |
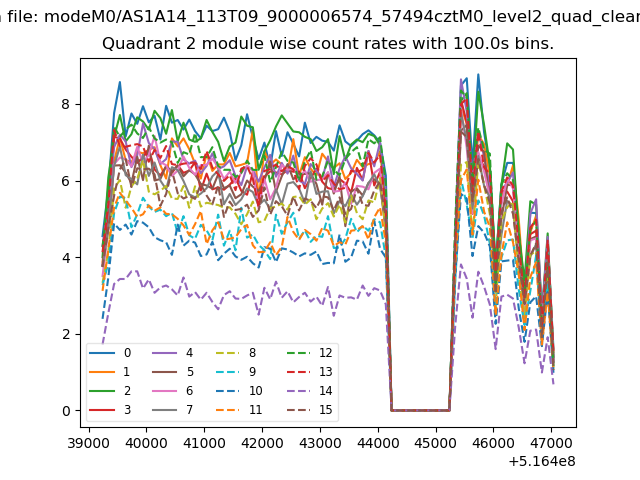
| Module-wise count rates for Quadrant B Data is divided into 100 sec bins |
 |
 |
| Module-wise count rates for Quadrant C Data is divided into 100 sec bins |
 |
 |
| Module-wise count rates for Quadrant D Data is divided into 100 sec bins |
 |
 |
| Parameter | Plot |
|---|---|
| CZT HV Monitor | 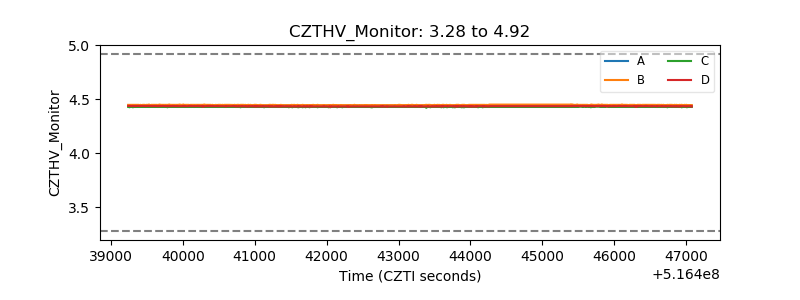 |
| D_VDD | 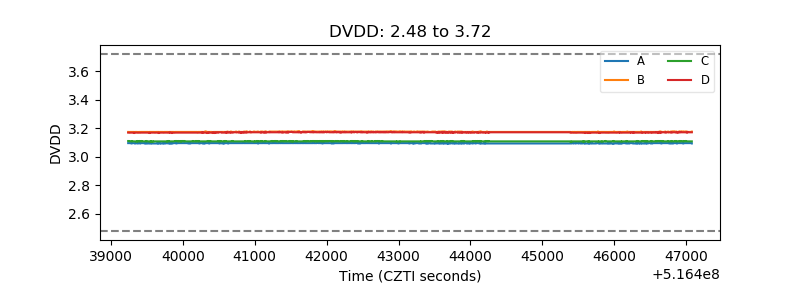 |
| Temperature 1 | 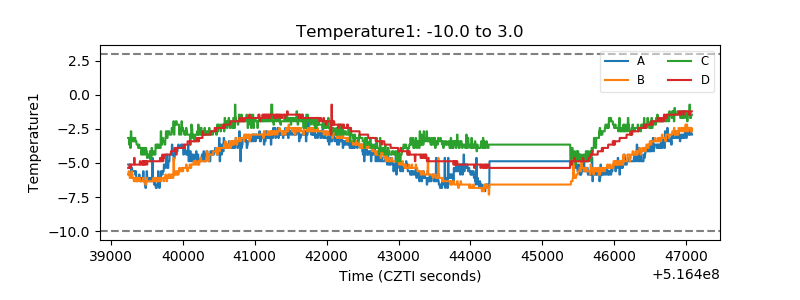 |
| Veto HV Monitor | 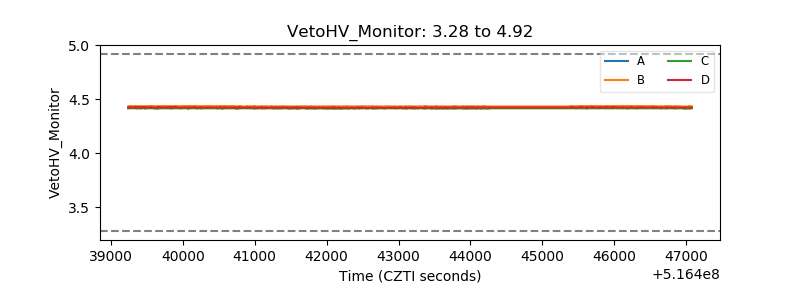 |
| Veto LLD | 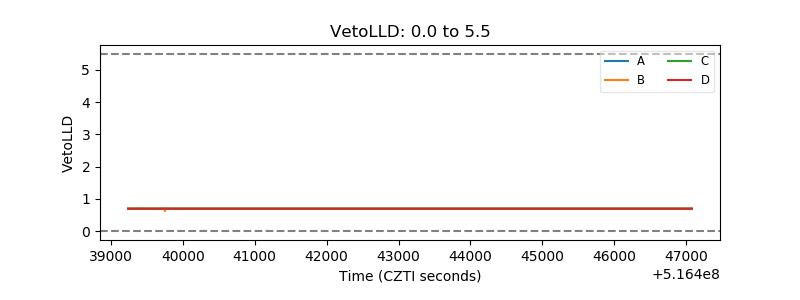 |
| Alpha Counter | 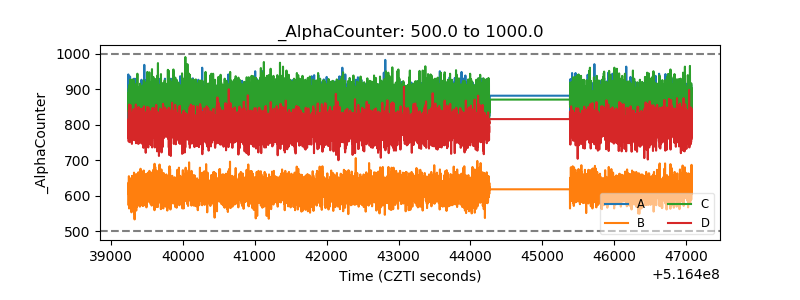 |
| _CPM_Rate | 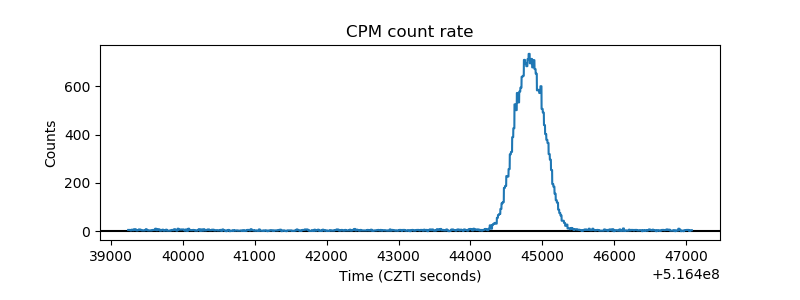 |
| CZT Counter | 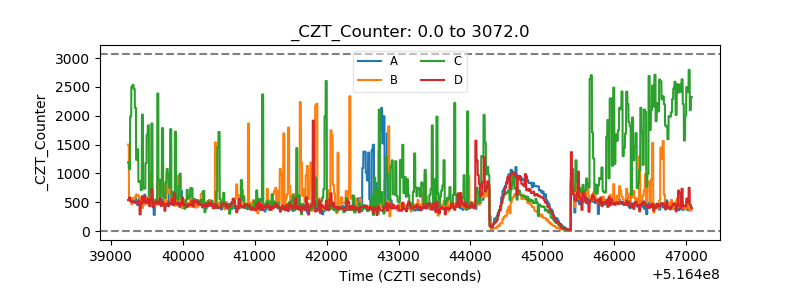 |
| +2.5 Volts monitor |  |
| +5 Volts monitor | 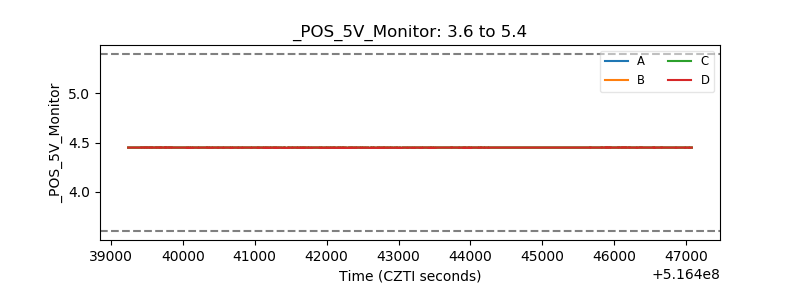 |
| _ROLL_ROT | 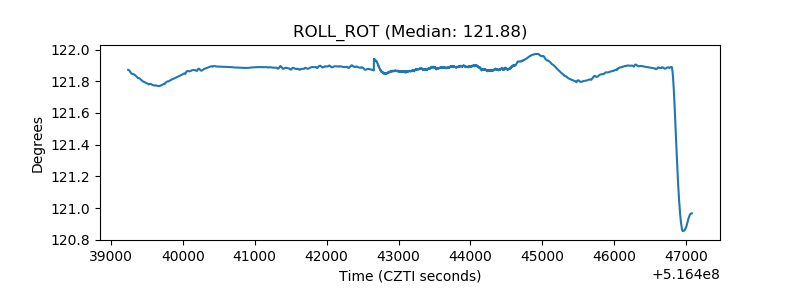 |
| _Roll_DEC | 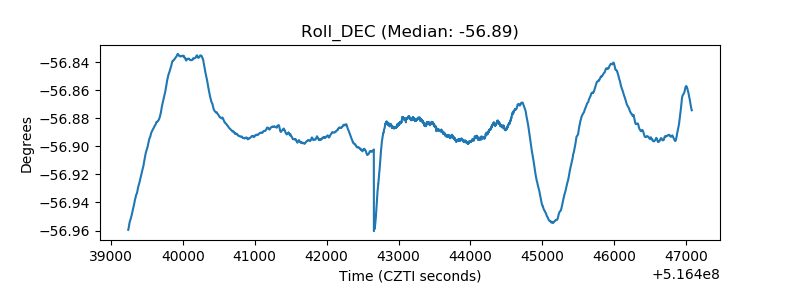 |
| _Roll_RA | 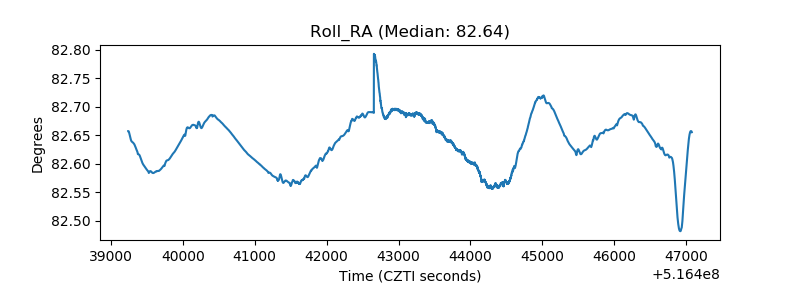 |
| Veto Counter | 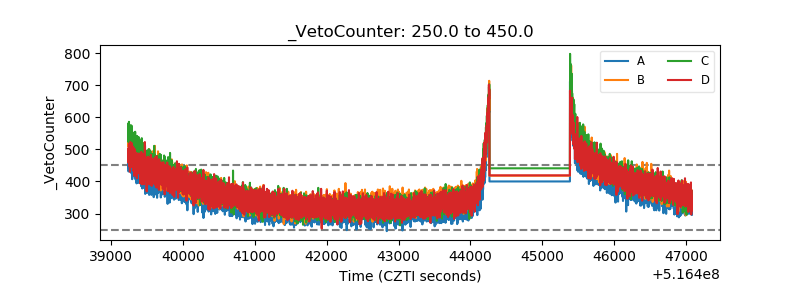 |