| Param | Original file | Final file |
|---|---|---|
| Filename | modeM0/AS1A14_113T09_9000006574_57496cztM0_level2.fits | modeM0/AS1A14_113T09_9000006574_57496cztM0_level2_quad_clean.evt |
| Size (bytes) | 507,283,200 | 88,536,960 |
| Size | 483.8 MB | 84.4 MB |
| Events in quadrant A | 2,886,979 | 612,232 |
| Events in quadrant B | 5,633,000 | 564,279 |
| Events in quadrant C | 4,802,188 | 557,242 |
| Events in quadrant D | 4,971,980 | 512,486 |
| Mode SS | |||
|---|---|---|---|
| Quadrant | BADHDUFLAG | Total packets | Discarded packets |
| A | 0 | 126 | 0 |
| B | 0 | 126 | 0 |
| C | 0 | 126 | 0 |
| D | 0 | 126 | 0 |
| Mode M9 | |||
|---|---|---|---|
| Quadrant | BADHDUFLAG | Total packets | Discarded packets |
| A | 0 | 11 | 0 |
| B | 0 | 11 | 0 |
| C | 0 | 11 | 0 |
| D | 0 | 11 | 0 |
| Mode M0 | |||
|---|---|---|---|
| Quadrant | BADHDUFLAG | Total packets | Discarded packets |
| A | 0 | 13214 | 1 |
| B | 0 | 21023 | 1 |
| C | 0 | 18577 | 1 |
| D | 0 | 18983 | 1 |
| Quadrant | Total seconds | Saturated seconds | Saturation percentage |
|---|---|---|---|
| A | 6224 | 100 | 1.606684% |
| B | 6225 | 1035 | 16.626506% |
| C | 6225 | 468 | 7.518072% |
| D | 6225 | 645 | 10.361446% |
Noise dominated data is calculated using 1-second bins in cleaned event files. If a bin has >2000 counts, and if more than 50% of those come from <1% of pixels, then it is considered to be noise-dominated and hence unusable.
| Quadrant | # 1 sec bins | Bins with >0 counts | Bins with >2000 counts | High rate bins dominated by noise | Noise dominated (total time) | Noise dominated (detector-on time) | Marked lightcurve |
|---|---|---|---|---|---|---|---|
| A | 7303 | 6224 | 36 | 36 | 0.49% | 0.58% | 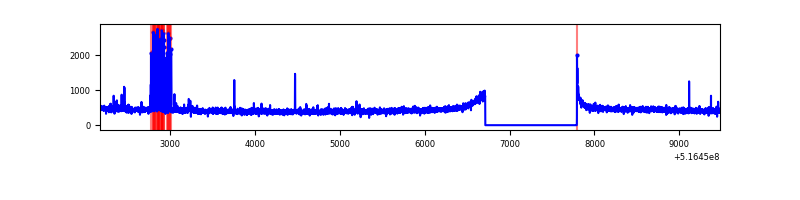 |
| B | 7304 | 6225 | 744 | 744 | 10.19% | 11.95% | 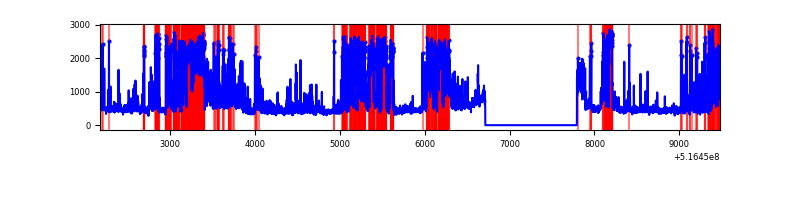 |
| C | 7304 | 6225 | 392 | 392 | 5.37% | 6.30% | 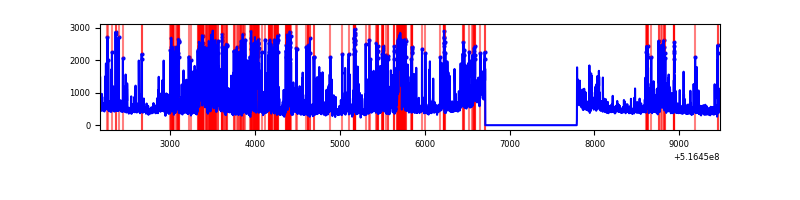 |
| D | 7304 | 6225 | 708 | 708 | 9.69% | 11.37% | 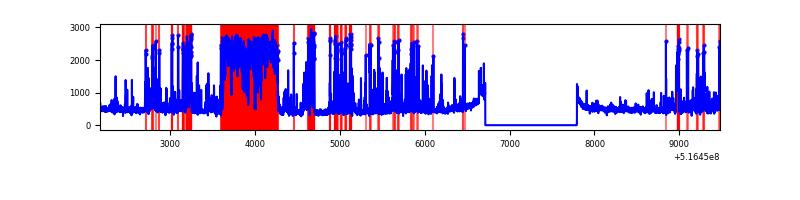 |
Top three noisy pixels from each quadrant. If the there are fewer than three noisy pixels in the level2.evt file, extra rows are filled as -1
| Pixel properties | Quadrant properties | ||||||
|---|---|---|---|---|---|---|---|
| Quadrant | DetID | PixID | Counts | Sigma | Mean | Median | Sigma |
| A | 13 | 153 | 166010 | 978.91 | 688 | 671 | 168.9 |
| A | 3 | 14 | 32205 | 186.7 | 688 | 671 | 168.9 |
| A | 7 | 14 | 8887 | 48.64 | 688 | 671 | 168.9 |
| B | 4 | 206 | 2518349 | 18848.29 | 627 | 606 | 133.6 |
| B | 5 | 185 | 320603 | 2395.56 | 627 | 606 | 133.6 |
| B | 10 | 247 | 78681 | 584.48 | 627 | 606 | 133.6 |
| C | 15 | 224 | 2041229 | 11663.36 | 637 | 630 | 175.0 |
| C | 14 | 254 | 111167 | 631.79 | 637 | 630 | 175.0 |
| C | 12 | 252 | 67021 | 379.47 | 637 | 630 | 175.0 |
| D | 8 | 240 | 1805540 | 9766.43 | 652 | 623 | 184.8 |
| D | 3 | 12 | 215706 | 1163.82 | 652 | 623 | 184.8 |
| D | 15 | 201 | 98612 | 530.22 | 652 | 623 | 184.8 |
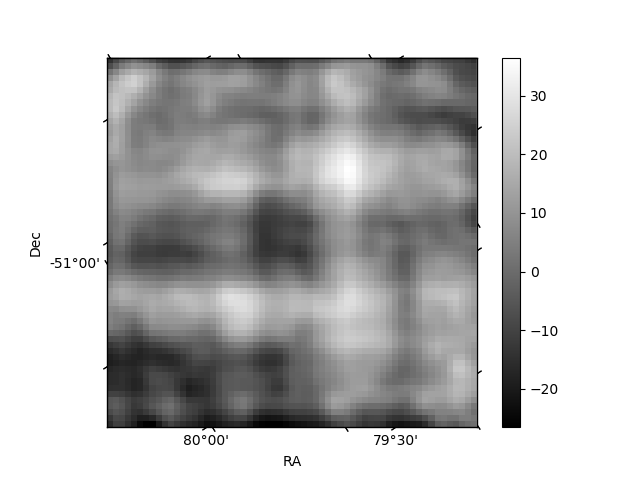
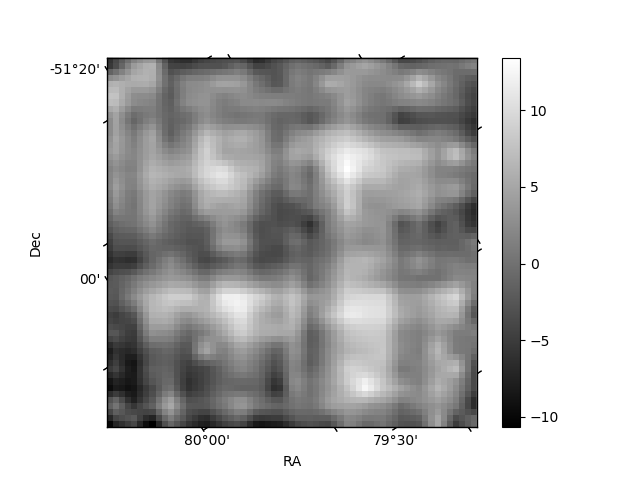
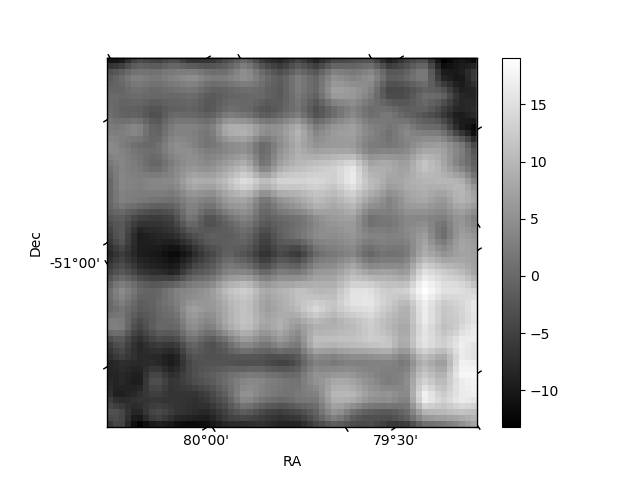
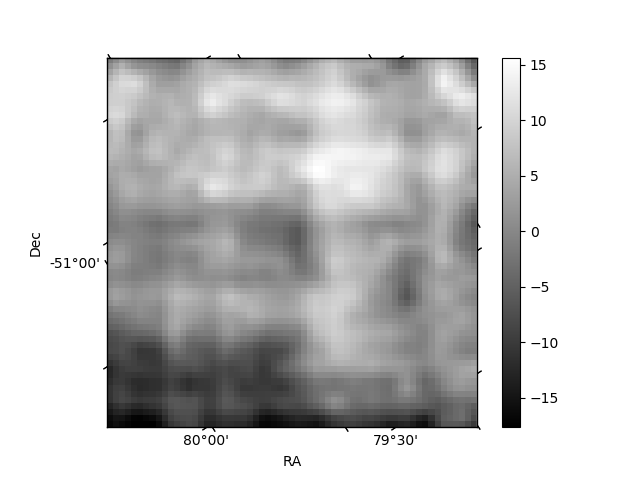
Histogram calculated using DETX and DETY for each event in the final _common_clean file
| Quadrant A | 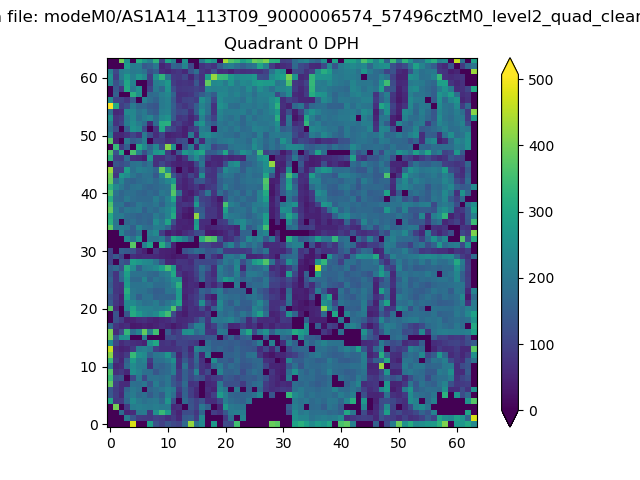 |
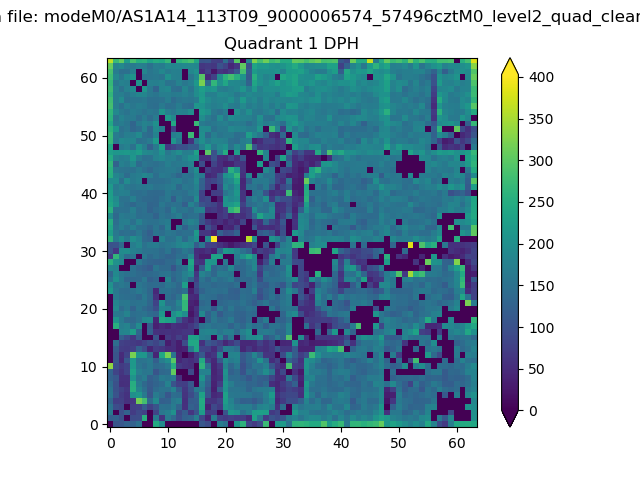 |
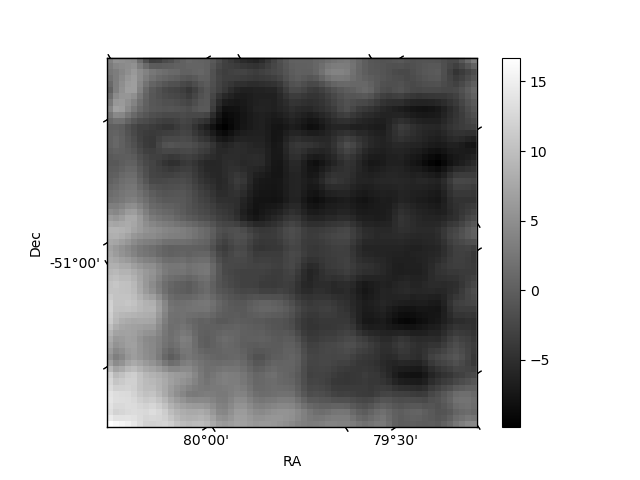
Quadrant B |
|---|---|---|---|
| Quadrant D | 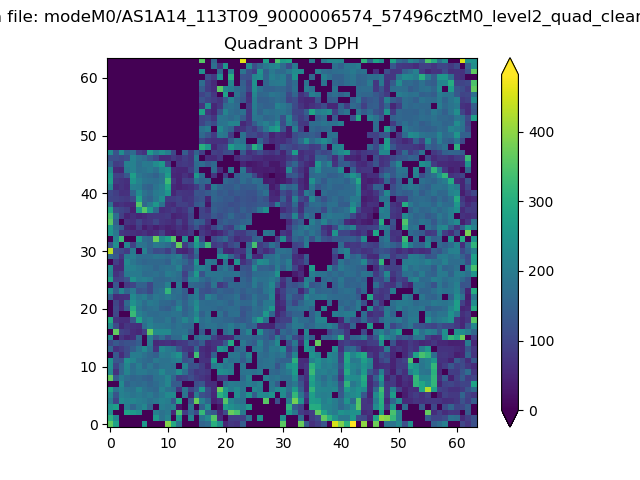 |
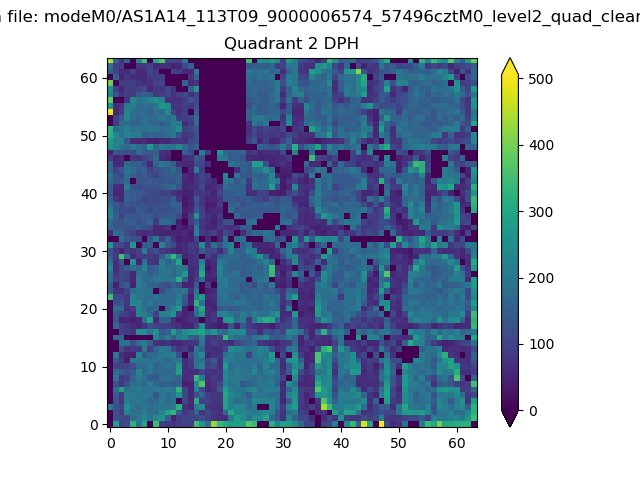 |
Quadrant C |
| Plot type | Count rate plots | Images |
|---|---|---|
| Comparison with Poisson distribution Blue bars denote a histogram of data divided into 1 sec bins. Red curve is a Poisson curve with rate = median count rate of data. |
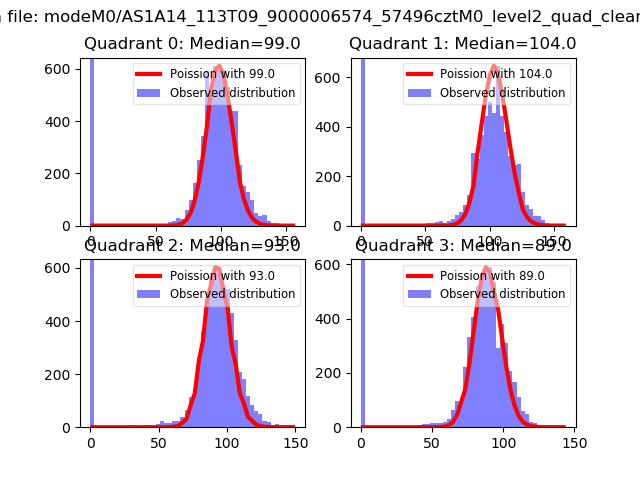 |
 |
| Quadrant-wise count rates Data is divided into 100 sec bins |
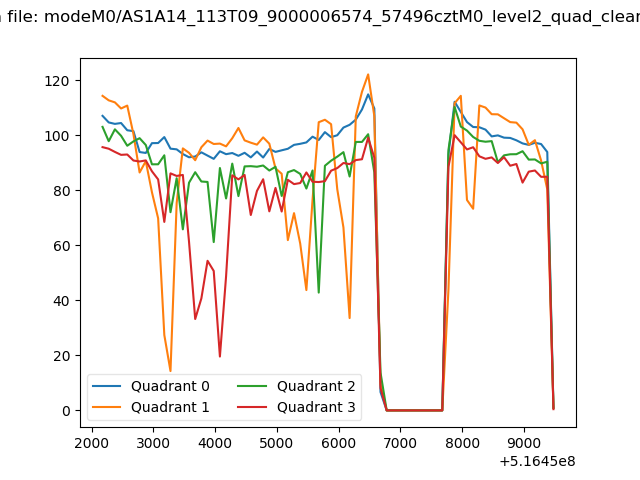 |
|
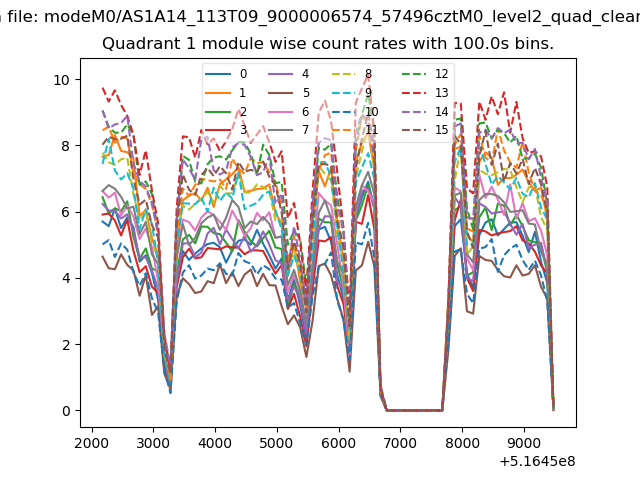
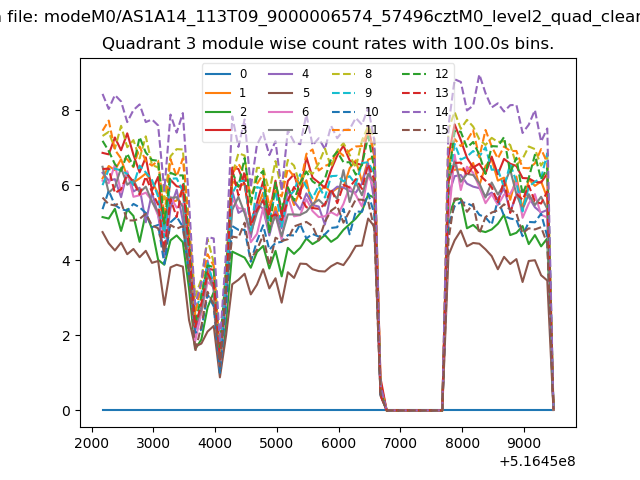
| Module-wise count rates for Quadrant A Data is divided into 100 sec bins |
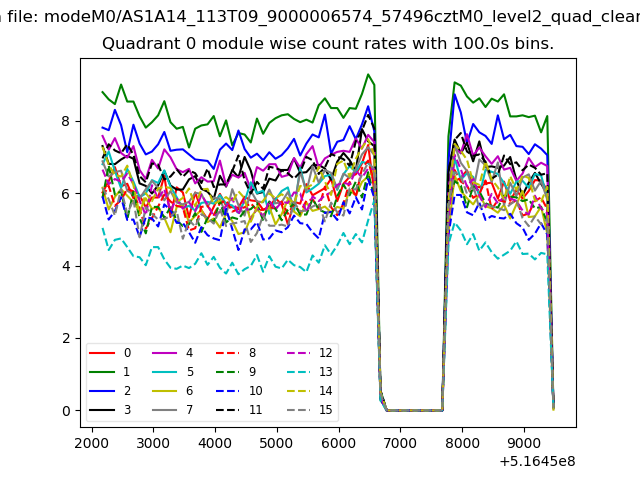 |
 |
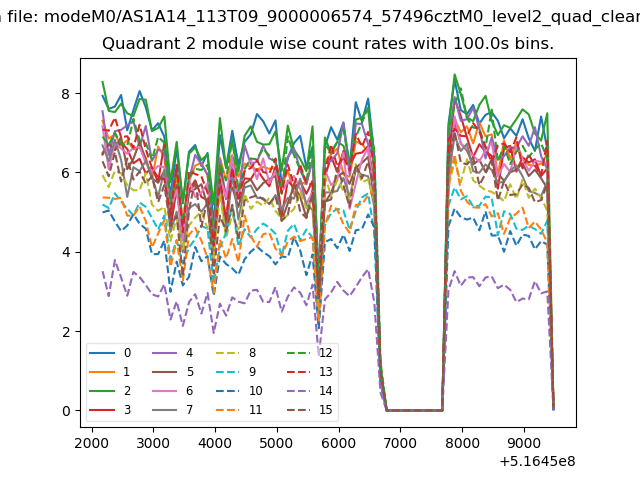
| Module-wise count rates for Quadrant B Data is divided into 100 sec bins |
 |
 |
| Module-wise count rates for Quadrant C Data is divided into 100 sec bins |
 |
 |
| Module-wise count rates for Quadrant D Data is divided into 100 sec bins |
 |
 |
| Parameter | Plot |
|---|---|
| CZT HV Monitor |  |
| D_VDD | 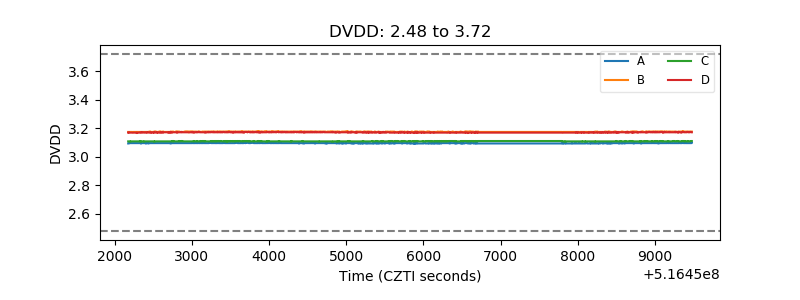 |
| Temperature 1 | 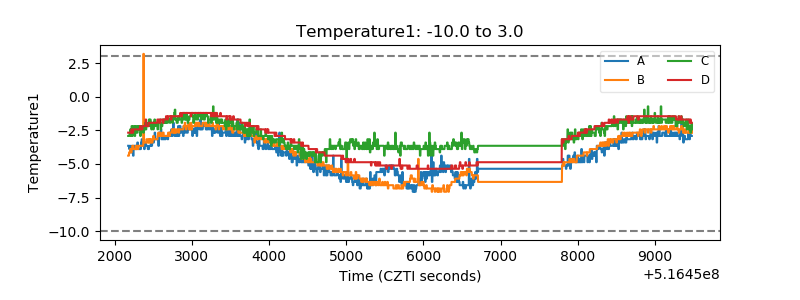 |
| Veto HV Monitor | 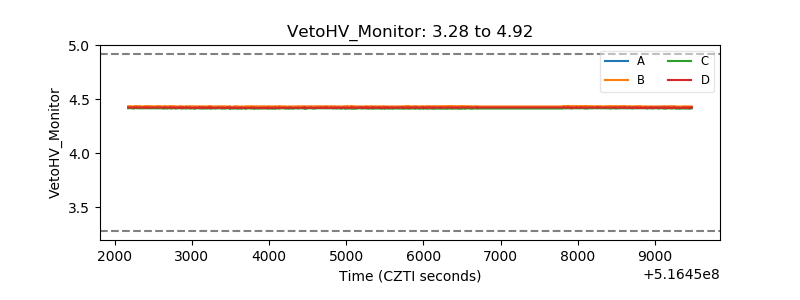 |
| Veto LLD | 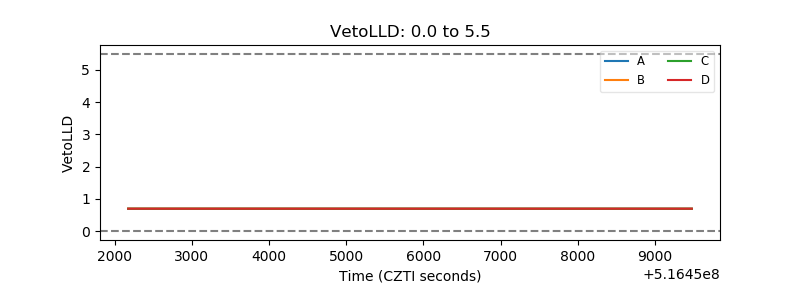 |
| Alpha Counter | 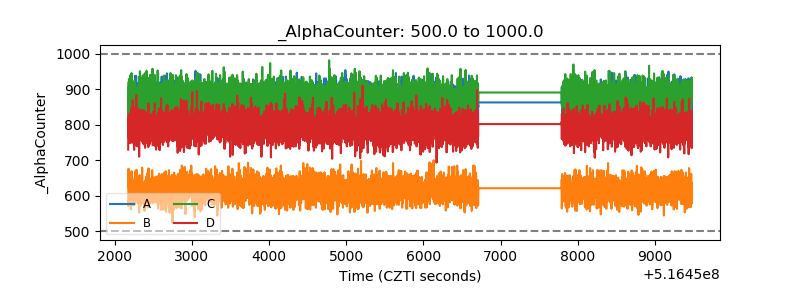 |
| _CPM_Rate | 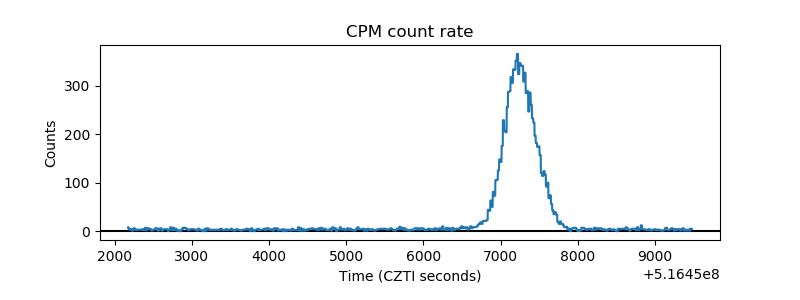 |
| CZT Counter | 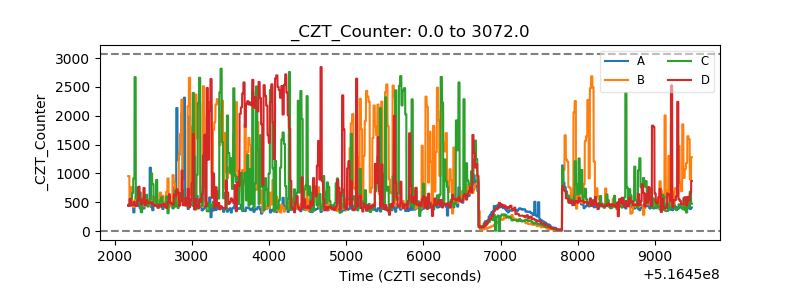 |
| +2.5 Volts monitor |  |
| +5 Volts monitor |  |
| _ROLL_ROT | 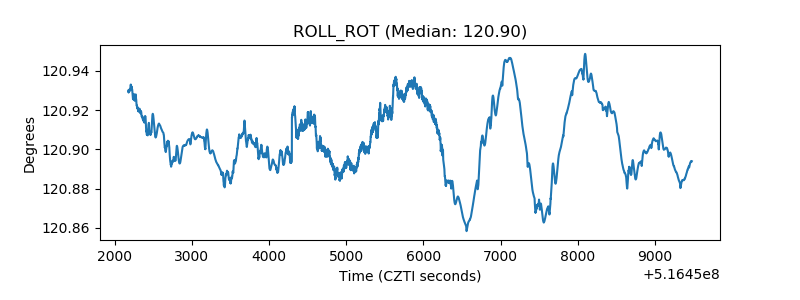 |
| _Roll_DEC | 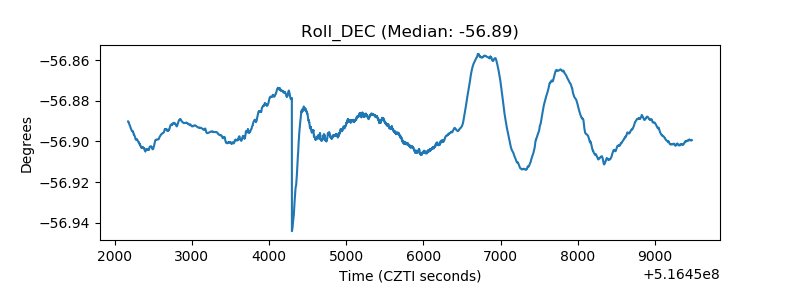 |
| _Roll_RA | 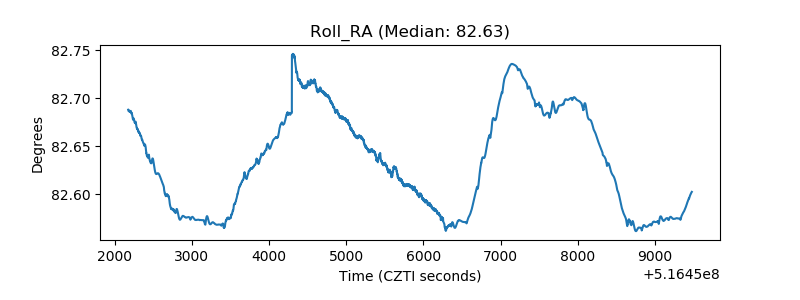 |
| Veto Counter | 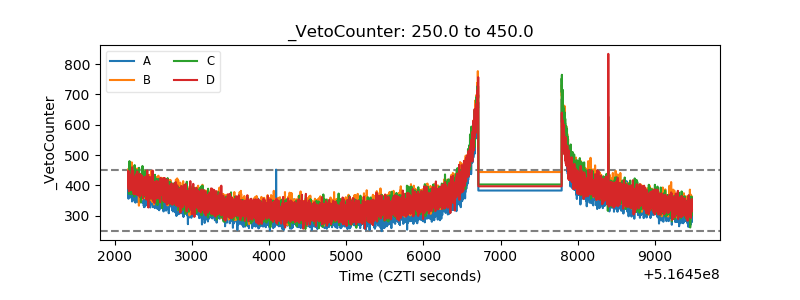 |