| Param | Original file | Final file |
|---|---|---|
| Filename | modeM0/AS1A14_113T09_9000006574_57498cztM0_level2.fits | modeM0/AS1A14_113T09_9000006574_57498cztM0_level2_quad_clean.evt |
| Size (bytes) | 465,652,800 | 94,504,320 |
| Size | 444.1 MB | 90.1 MB |
| Events in quadrant A | 2,857,418 | 632,032 |
| Events in quadrant B | 5,264,194 | 627,437 |
| Events in quadrant C | 3,933,724 | 588,973 |
| Events in quadrant D | 4,667,061 | 551,708 |
| Mode SS | |||
|---|---|---|---|
| Quadrant | BADHDUFLAG | Total packets | Discarded packets |
| A | 0 | 134 | 0 |
| B | 0 | 134 | 0 |
| C | 0 | 134 | 0 |
| D | 0 | 134 | 0 |
| Mode M9 | |||
|---|---|---|---|
| Quadrant | BADHDUFLAG | Total packets | Discarded packets |
| A | 0 | 6 | 0 |
| B | 0 | 6 | 0 |
| C | 0 | 6 | 0 |
| D | 0 | 6 | 0 |
| Mode M0 | |||
|---|---|---|---|
| Quadrant | BADHDUFLAG | Total packets | Discarded packets |
| A | 0 | 13608 | 1 |
| B | 0 | 20351 | 1 |
| C | 0 | 16565 | 1 |
| D | 0 | 18422 | 1 |
| Quadrant | Total seconds | Saturated seconds | Saturation percentage |
|---|---|---|---|
| A | 6617 | 30 | 0.453378% |
| B | 6618 | 702 | 10.607434% |
| C | 6618 | 223 | 3.369598% |
| D | 6618 | 322 | 4.865518% |
Noise dominated data is calculated using 1-second bins in cleaned event files. If a bin has >2000 counts, and if more than 50% of those come from <1% of pixels, then it is considered to be noise-dominated and hence unusable.
| Quadrant | # 1 sec bins | Bins with >0 counts | Bins with >2000 counts | High rate bins dominated by noise | Noise dominated (total time) | Noise dominated (detector-on time) | Marked lightcurve |
|---|---|---|---|---|---|---|---|
| A | 7217 | 6618 | 1 | 1 | 0.01% | 0.02% | 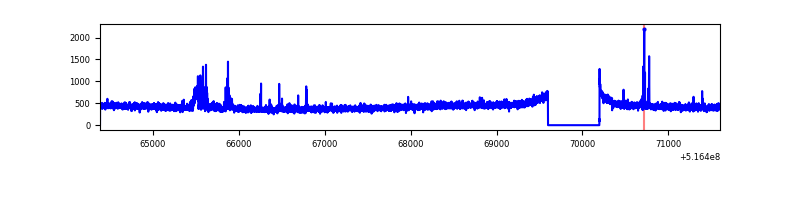 |
| B | 7218 | 6619 | 417 | 417 | 5.78% | 6.30% | 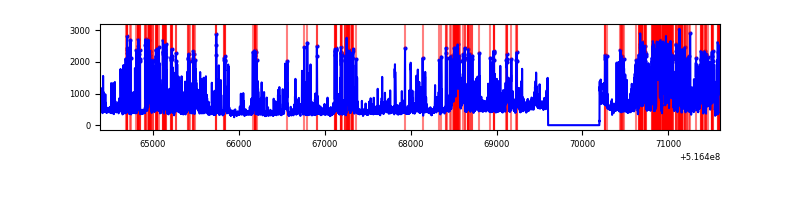 |
| C | 7218 | 6619 | 194 | 194 | 2.69% | 2.93% | 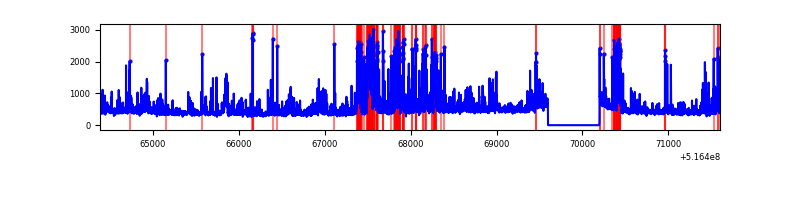 |
| D | 7218 | 6619 | 329 | 329 | 4.56% | 4.97% | 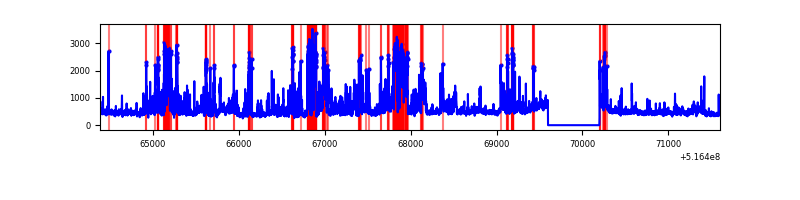 |
Top three noisy pixels from each quadrant. If the there are fewer than three noisy pixels in the level2.evt file, extra rows are filled as -1
| Pixel properties | Quadrant properties | ||||||
|---|---|---|---|---|---|---|---|
| Quadrant | DetID | PixID | Counts | Sigma | Mean | Median | Sigma |
| A | 13 | 248 | 71697 | 405.39 | 712 | 694 | 175.1 |
| A | 10 | 251 | 18415 | 101.18 | 712 | 694 | 175.1 |
| A | 4 | 3 | 9674 | 51.27 | 712 | 694 | 175.1 |
| B | 4 | 206 | 1985834 | 13703.4 | 677 | 651 | 144.9 |
| B | 0 | 213 | 273612 | 1884.21 | 677 | 651 | 144.9 |
| B | 5 | 185 | 135272 | 929.27 | 677 | 651 | 144.9 |
| C | 15 | 224 | 975190 | 5268.64 | 676 | 669 | 185.0 |
| C | 14 | 254 | 131476 | 707.19 | 676 | 669 | 185.0 |
| C | 13 | 16 | 82726 | 443.63 | 676 | 669 | 185.0 |
| D | 15 | 142 | 1136350 | 5932.11 | 673 | 641 | 191.5 |
| D | 8 | 240 | 487231 | 2541.59 | 673 | 641 | 191.5 |
| D | 2 | 31 | 158228 | 823.12 | 673 | 641 | 191.5 |
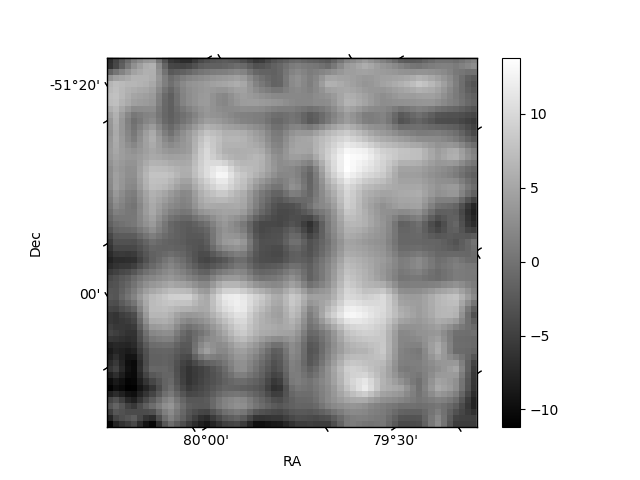
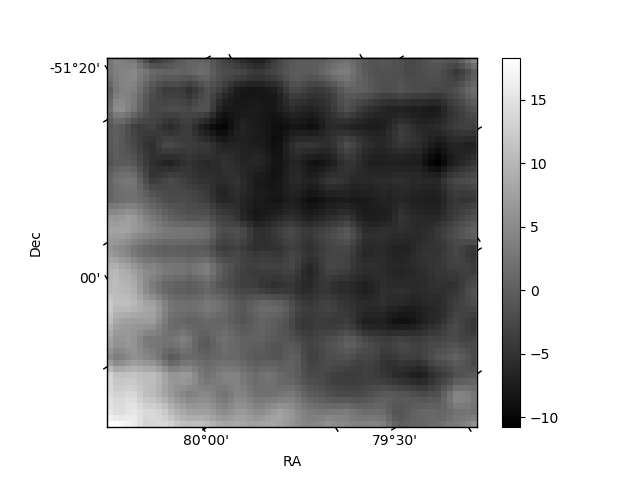
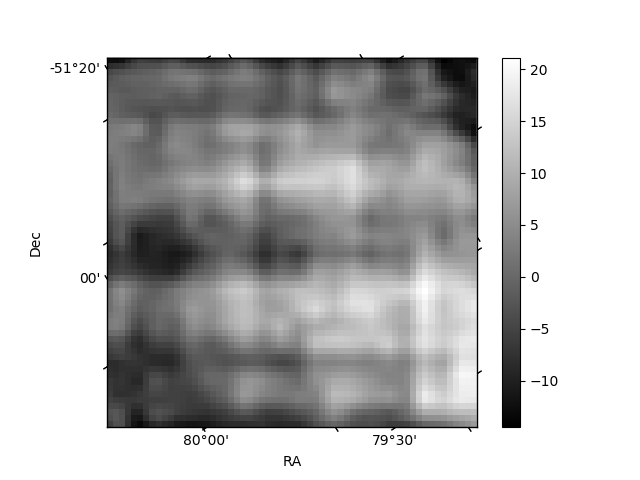
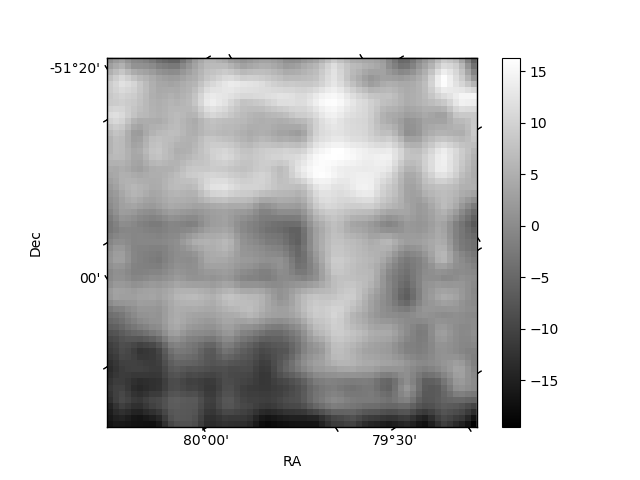
Histogram calculated using DETX and DETY for each event in the final _common_clean file
| Quadrant A | 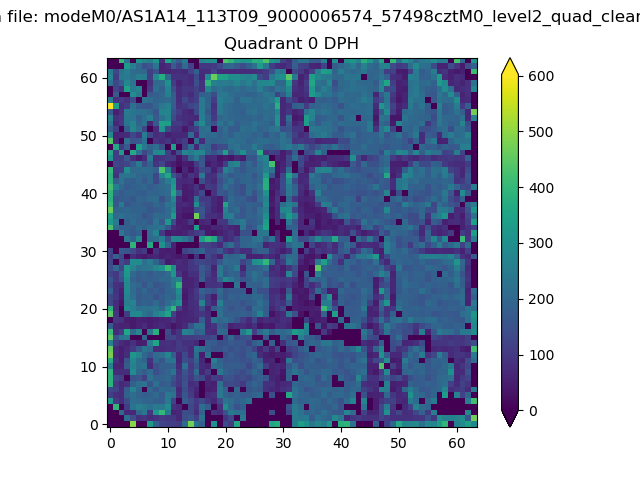 |
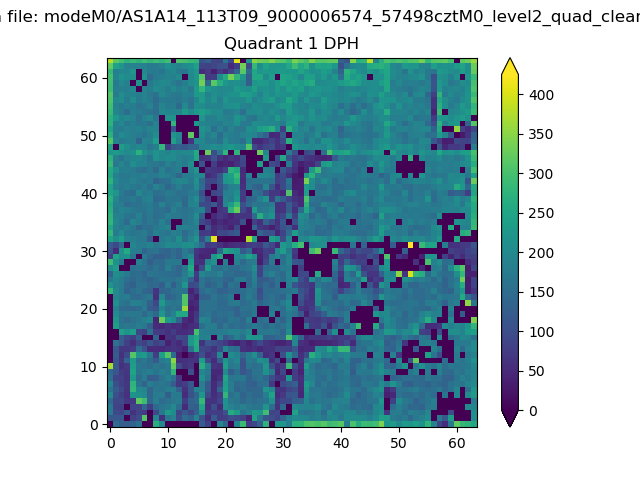 |
Quadrant B |
|---|---|---|---|
| Quadrant D | 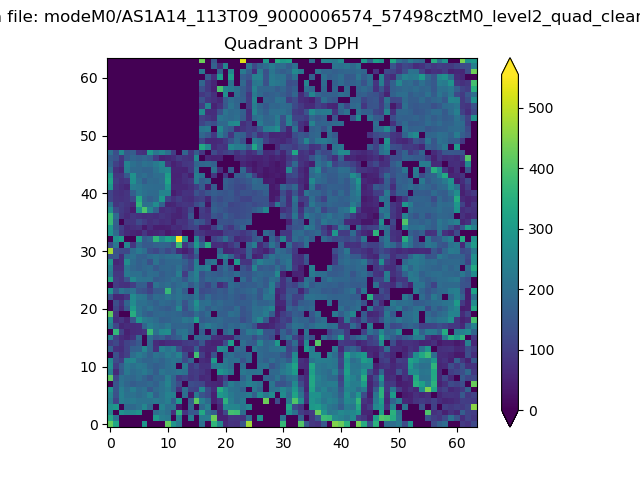 |
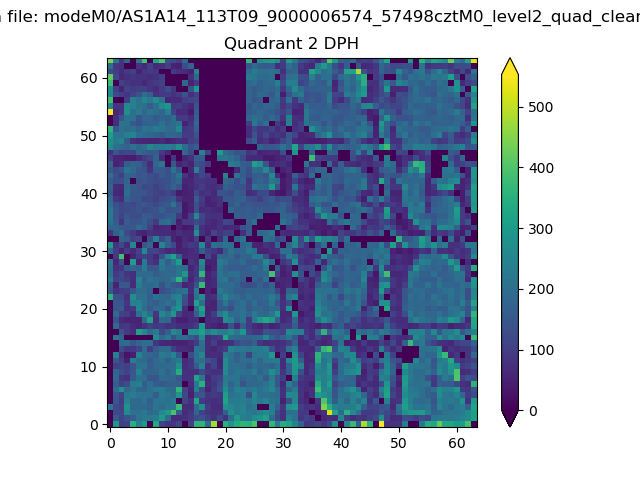 |
Quadrant C |
| Plot type | Count rate plots | Images |
|---|---|---|
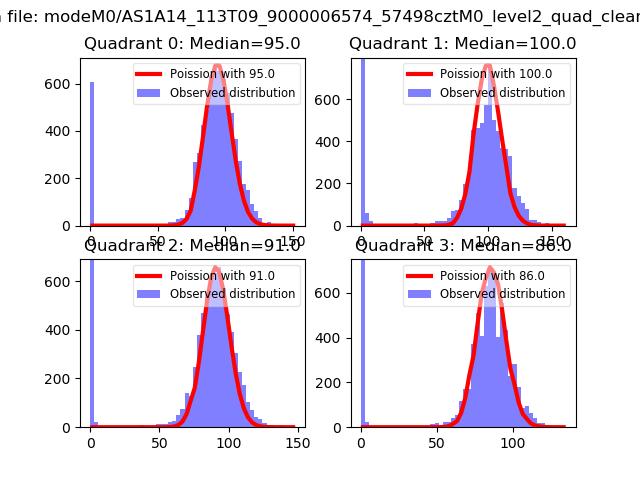
| Comparison with Poisson distribution Blue bars denote a histogram of data divided into 1 sec bins. Red curve is a Poisson curve with rate = median count rate of data. |
 |
 |
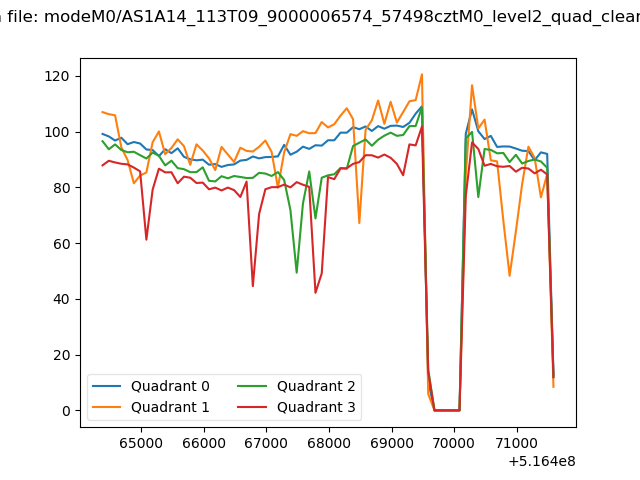
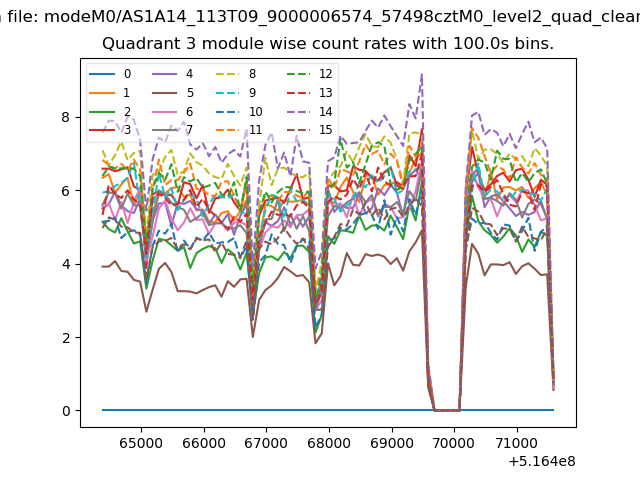
| Quadrant-wise count rates Data is divided into 100 sec bins |
 |
|
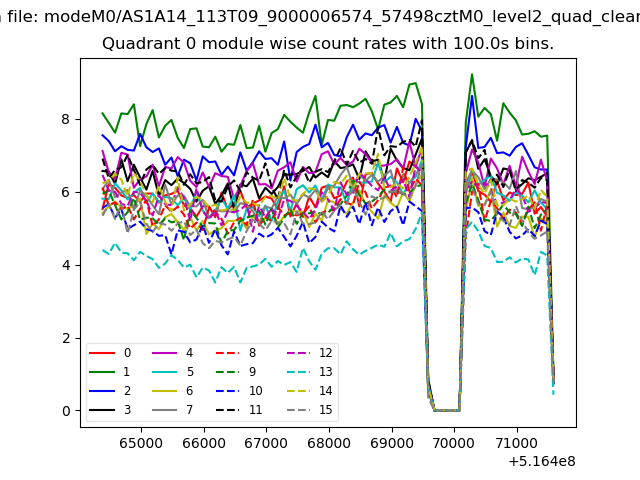
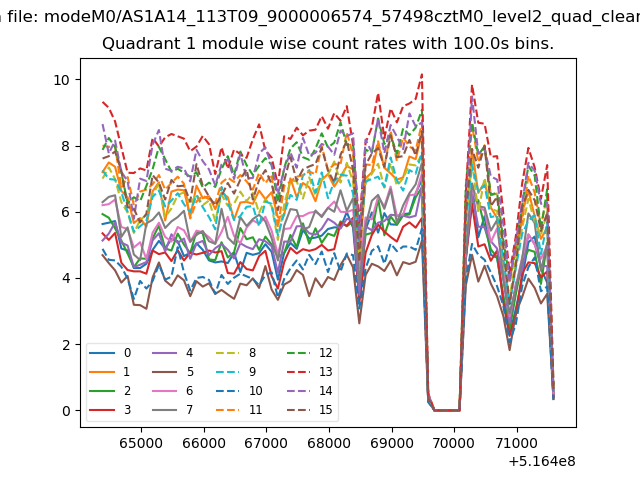
| Module-wise count rates for Quadrant A Data is divided into 100 sec bins |
 |
 |
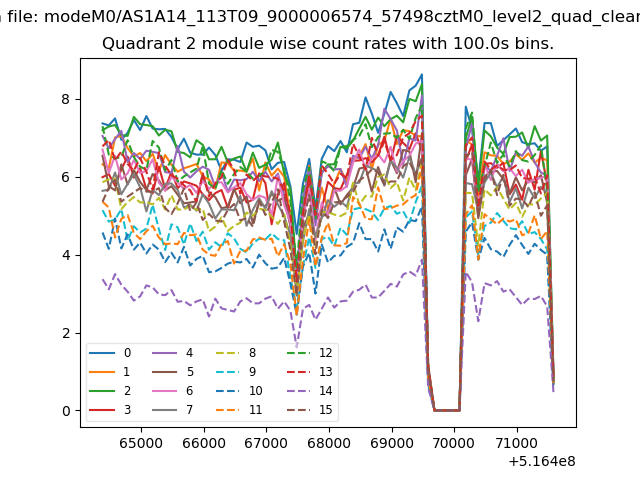
| Module-wise count rates for Quadrant B Data is divided into 100 sec bins |
 |
 |
| Module-wise count rates for Quadrant C Data is divided into 100 sec bins |
 |
 |
| Module-wise count rates for Quadrant D Data is divided into 100 sec bins |
 |
 |
| Parameter | Plot |
|---|---|
| CZT HV Monitor |  |
| D_VDD | 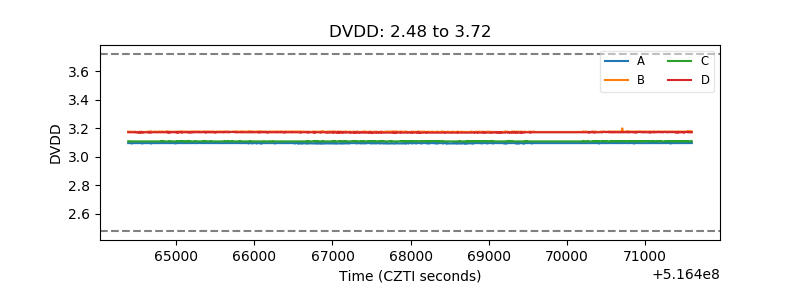 |
| Temperature 1 | 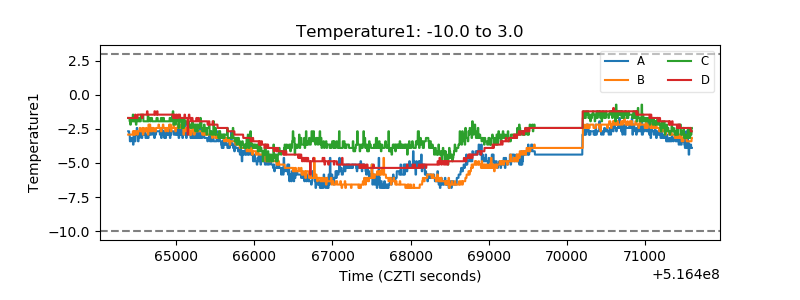 |
| Veto HV Monitor | 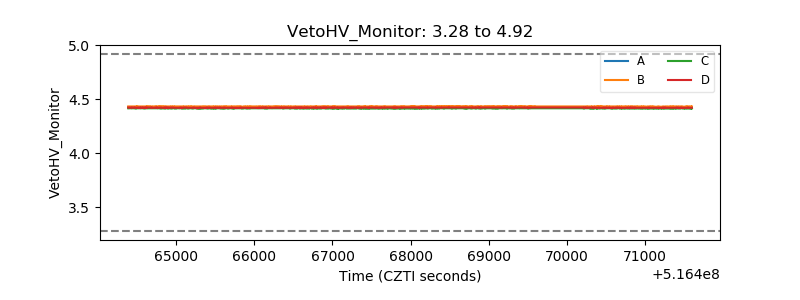 |
| Veto LLD | 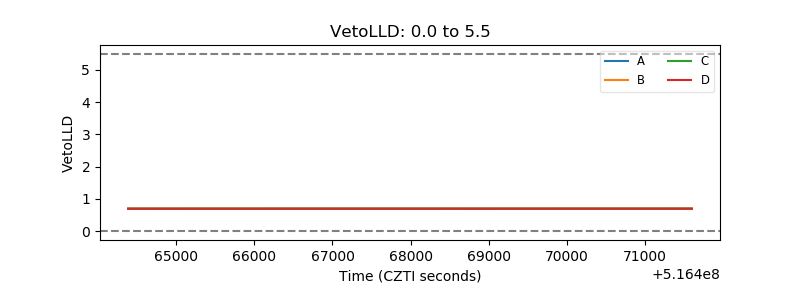 |
| Alpha Counter | 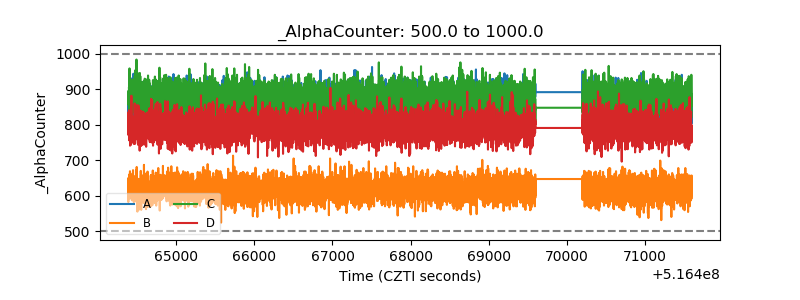 |
| _CPM_Rate | 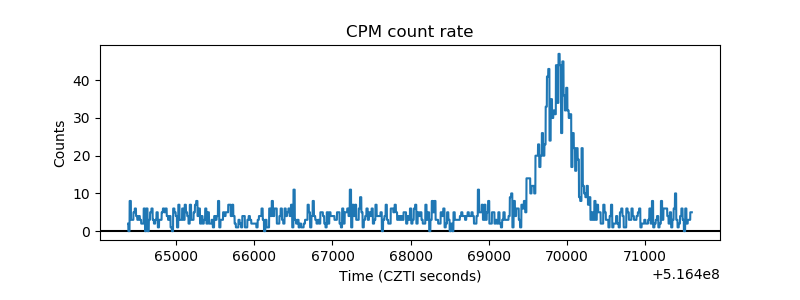 |
| CZT Counter | 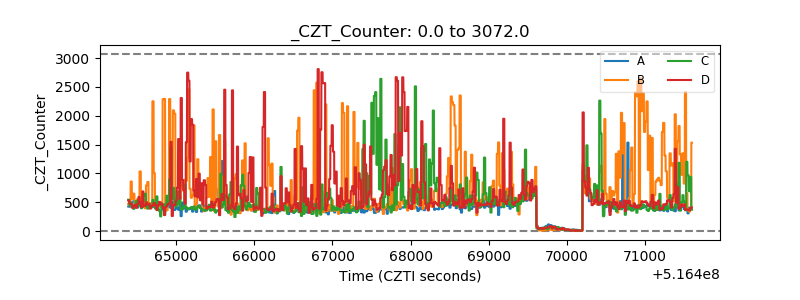 |
| +2.5 Volts monitor | 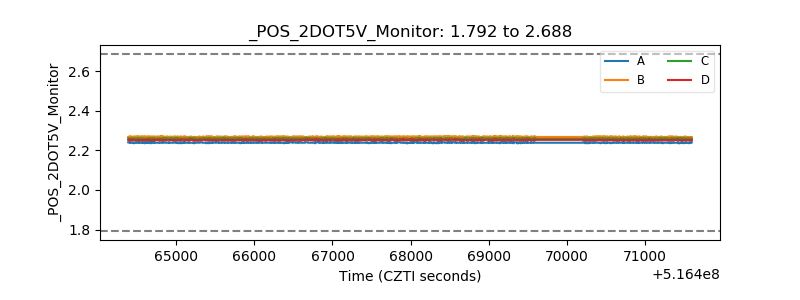 |
| +5 Volts monitor | 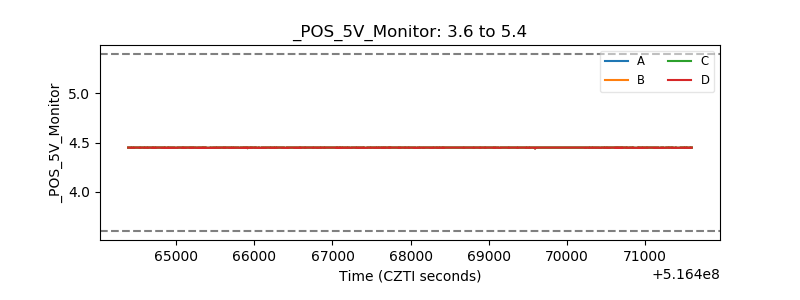 |
| _ROLL_ROT | 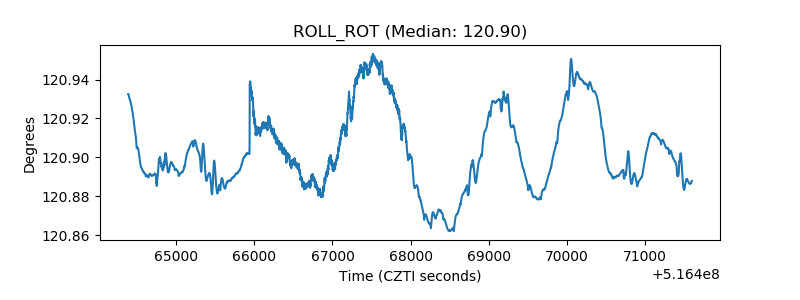 |
| _Roll_DEC | 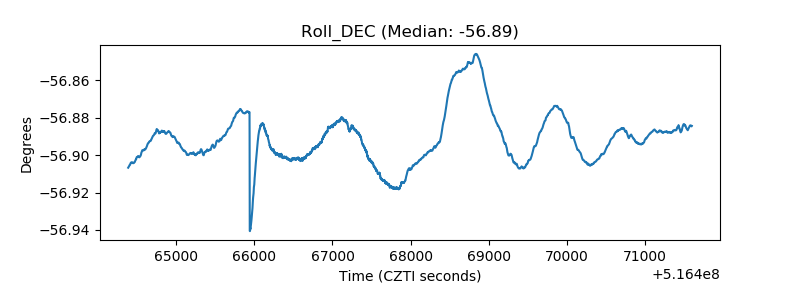 |
| _Roll_RA | 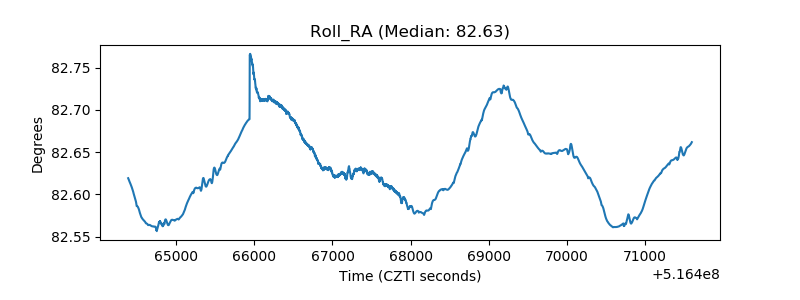 |
| Veto Counter | 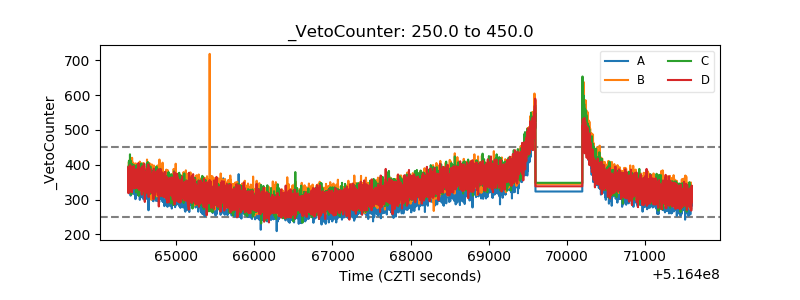 |