| Param | Original file | Final file |
|---|---|---|
| Filename | modeM0/AS1A14_113T09_9000006574_57499cztM0_level2.fits | modeM0/AS1A14_113T09_9000006574_57499cztM0_level2_quad_clean.evt |
| Size (bytes) | 870,773,760 | 170,242,560 |
| Size | 830.4 MB | 162.4 MB |
| Events in quadrant A | 6,263,194 | 1,114,119 |
| Events in quadrant B | 9,300,908 | 1,138,004 |
| Events in quadrant C | 8,114,865 | 1,056,357 |
| Events in quadrant D | 7,617,117 | 1,009,633 |
| Mode SS | |||
|---|---|---|---|
| Quadrant | BADHDUFLAG | Total packets | Discarded packets |
| A | 0 | 244 | 0 |
| B | 0 | 244 | 0 |
| C | 0 | 244 | 0 |
| D | 0 | 244 | 0 |
| Mode M9 | |||
|---|---|---|---|
| Quadrant | BADHDUFLAG | Total packets | Discarded packets |
| A | 0 | 6 | 0 |
| B | 0 | 6 | 0 |
| C | 0 | 6 | 0 |
| D | 0 | 6 | 0 |
| Mode M0 | |||
|---|---|---|---|
| Quadrant | BADHDUFLAG | Total packets | Discarded packets |
| A | 0 | 27881 | 3 |
| B | 0 | 36183 | 3 |
| C | 0 | 32890 | 3 |
| D | 0 | 31211 | 3 |
| Quadrant | Total seconds | Saturated seconds | Saturation percentage |
|---|---|---|---|
| A | 12092 | 464 | 3.837248% |
| B | 12093 | 1240 | 10.253866% |
| C | 12093 | 577 | 4.771355% |
| D | 12093 | 426 | 3.522699% |
Noise dominated data is calculated using 1-second bins in cleaned event files. If a bin has >2000 counts, and if more than 50% of those come from <1% of pixels, then it is considered to be noise-dominated and hence unusable.
| Quadrant | # 1 sec bins | Bins with >0 counts | Bins with >2000 counts | High rate bins dominated by noise | Noise dominated (total time) | Noise dominated (detector-on time) | Marked lightcurve |
|---|---|---|---|---|---|---|---|
| A | 12752 | 12095 | 229 | 229 | 1.80% | 1.89% | 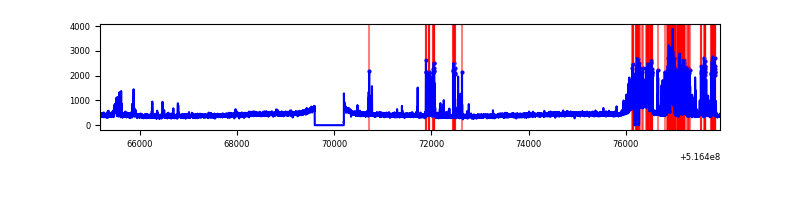 |
| B | 12753 | 12096 | 641 | 641 | 5.03% | 5.30% | 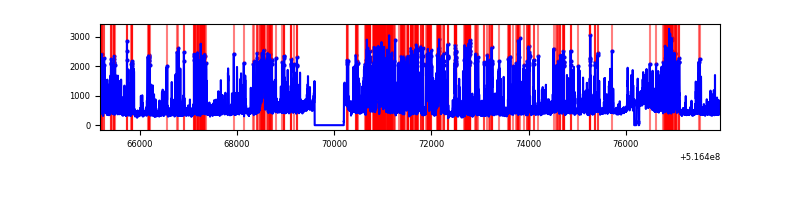 |
| C | 12753 | 12096 | 465 | 465 | 3.65% | 3.84% | 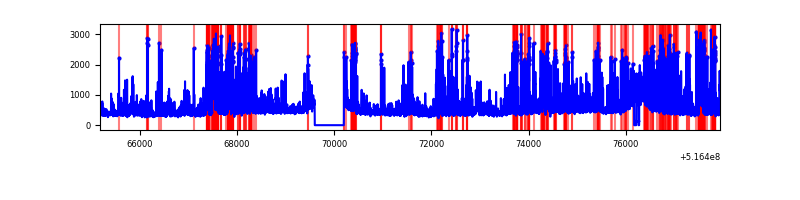 |
| D | 12753 | 12096 | 401 | 401 | 3.14% | 3.32% | 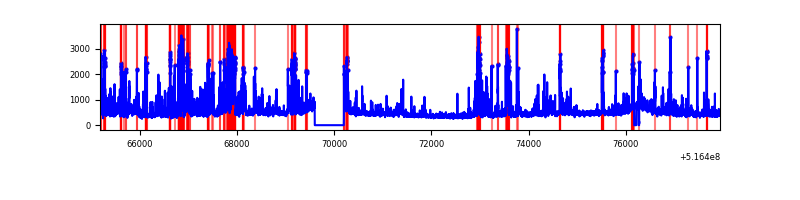 |
Top three noisy pixels from each quadrant. If the there are fewer than three noisy pixels in the level2.evt file, extra rows are filled as -1
| Pixel properties | Quadrant properties | ||||||
|---|---|---|---|---|---|---|---|
| Quadrant | DetID | PixID | Counts | Sigma | Mean | Median | Sigma |
| A | 13 | 248 | 1198713 | 3801.19 | 1290 | 1258 | 315.0 |
| A | 10 | 251 | 21120 | 63.05 | 1290 | 1258 | 315.0 |
| A | 13 | 153 | 16809 | 49.36 | 1290 | 1258 | 315.0 |
| B | 4 | 206 | 2688841 | 10022.21 | 1255 | 1204 | 268.2 |
| B | 0 | 213 | 809480 | 3014.06 | 1255 | 1204 | 268.2 |
| B | 5 | 185 | 325956 | 1211.0 | 1255 | 1204 | 268.2 |
| C | 15 | 224 | 2634410 | 7862.41 | 1242 | 1225 | 334.9 |
| C | 13 | 16 | 273598 | 813.28 | 1242 | 1225 | 334.9 |
| C | 14 | 254 | 141738 | 419.56 | 1242 | 1225 | 334.9 |
| D | 15 | 142 | 1497231 | 4204.54 | 1252 | 1191 | 355.8 |
| D | 8 | 240 | 384910 | 1078.42 | 1252 | 1191 | 355.8 |
| D | 2 | 31 | 285193 | 798.17 | 1252 | 1191 | 355.8 |
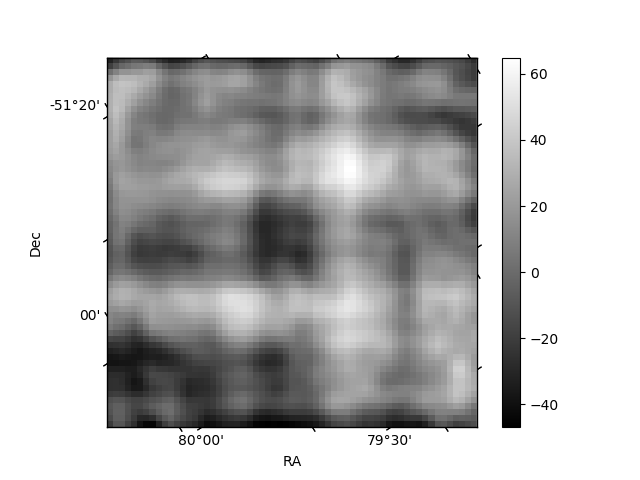
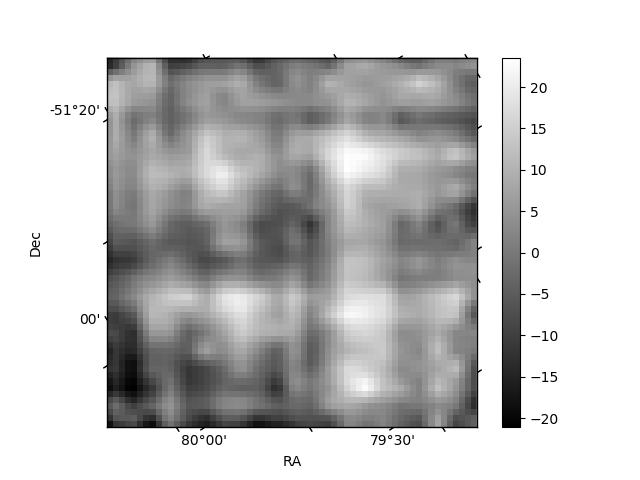
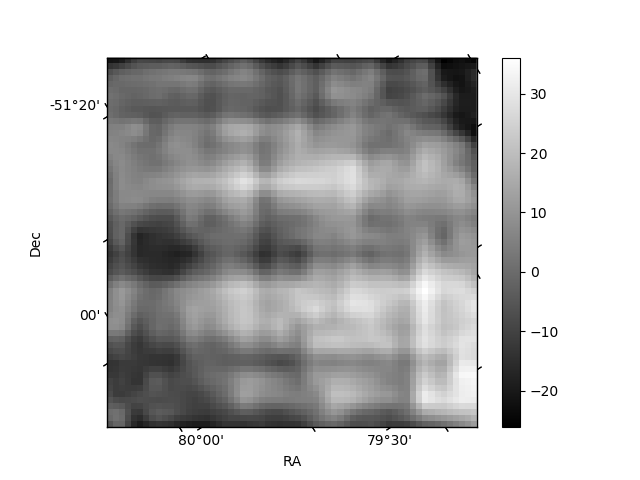
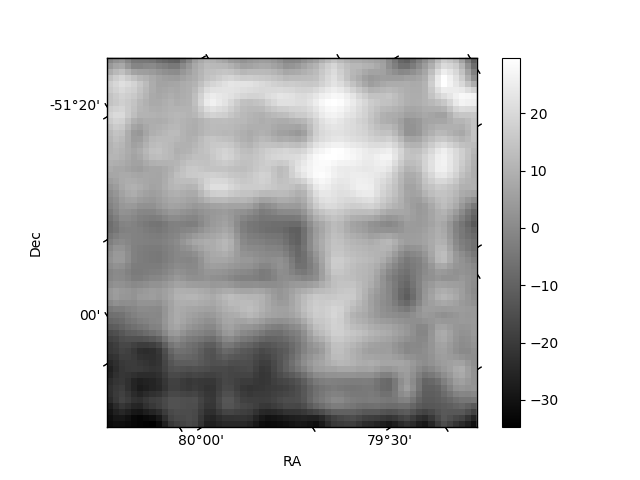
Histogram calculated using DETX and DETY for each event in the final _common_clean file
| Quadrant A | 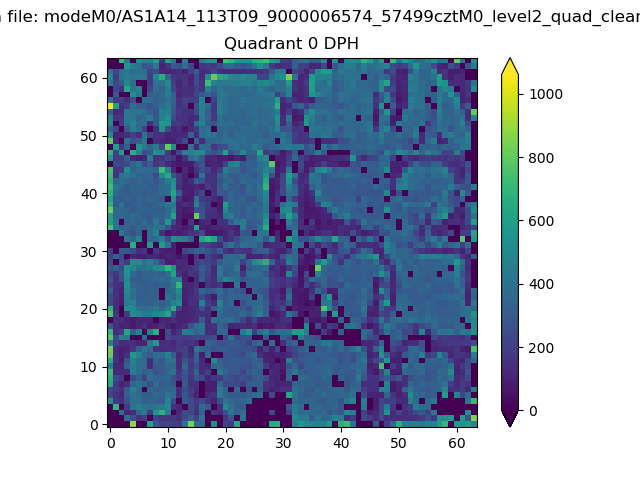 |
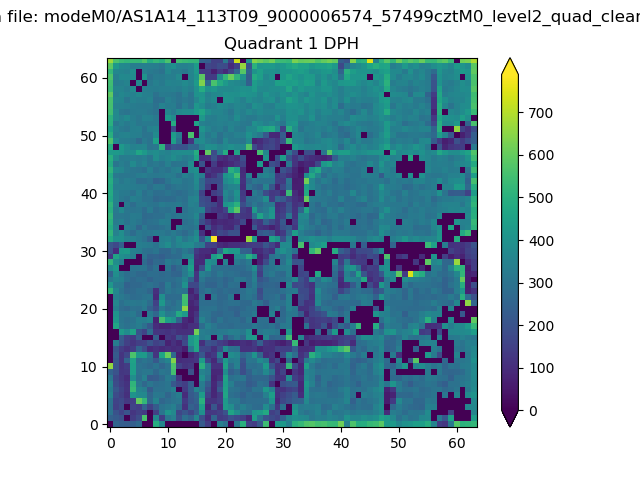 |
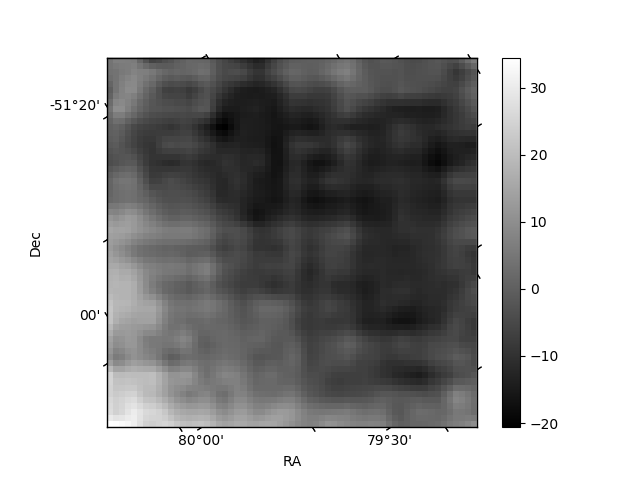
Quadrant B |
|---|---|---|---|
| Quadrant D | 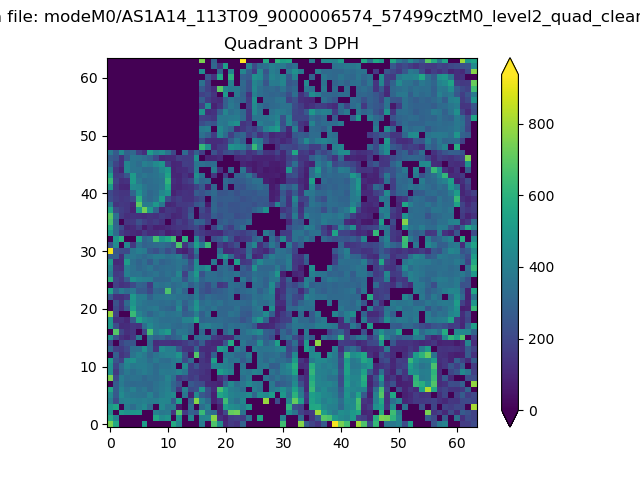 |
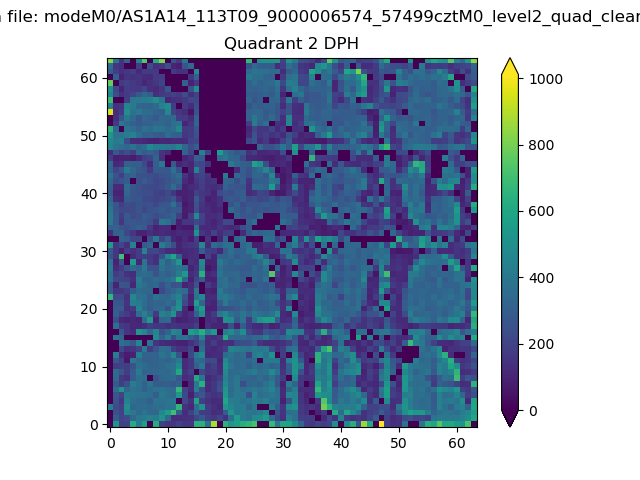 |
Quadrant C |
| Plot type | Count rate plots | Images |
|---|---|---|
| Comparison with Poisson distribution Blue bars denote a histogram of data divided into 1 sec bins. Red curve is a Poisson curve with rate = median count rate of data. |
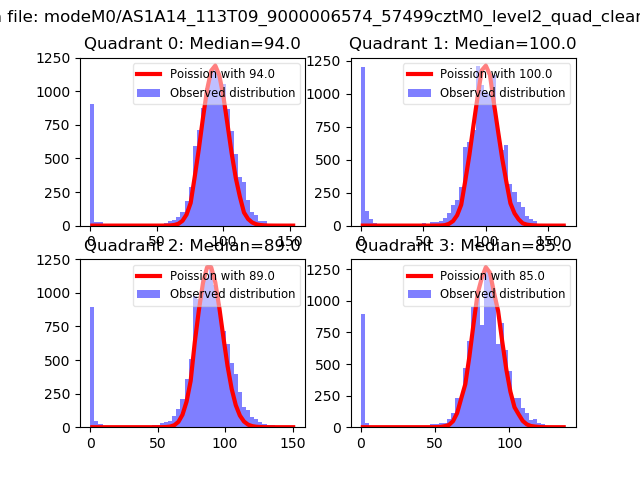 |
 |
| Quadrant-wise count rates Data is divided into 100 sec bins |
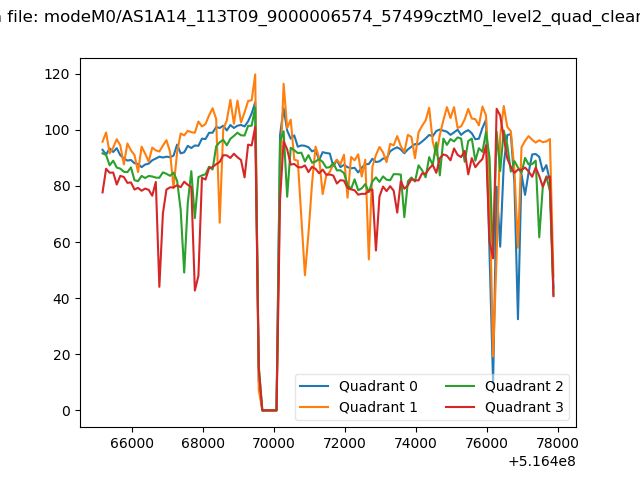 |
|
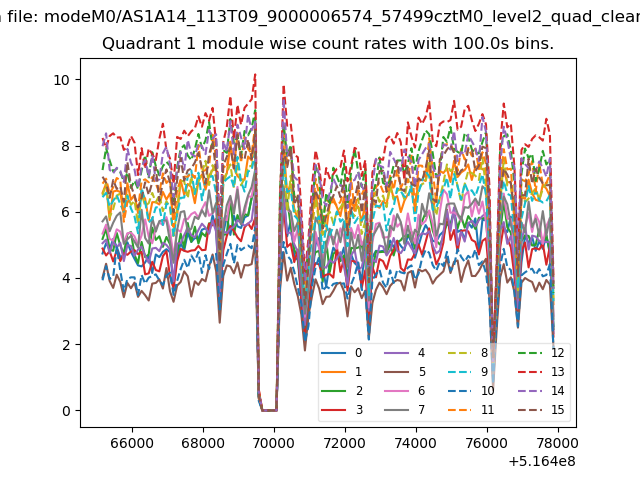
| Module-wise count rates for Quadrant A Data is divided into 100 sec bins |
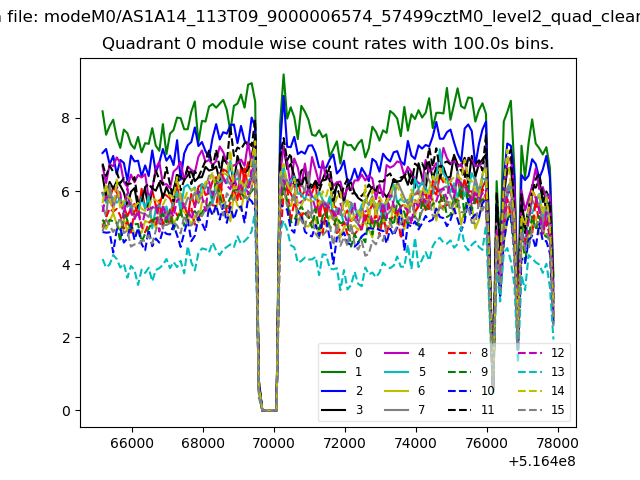 |
 |
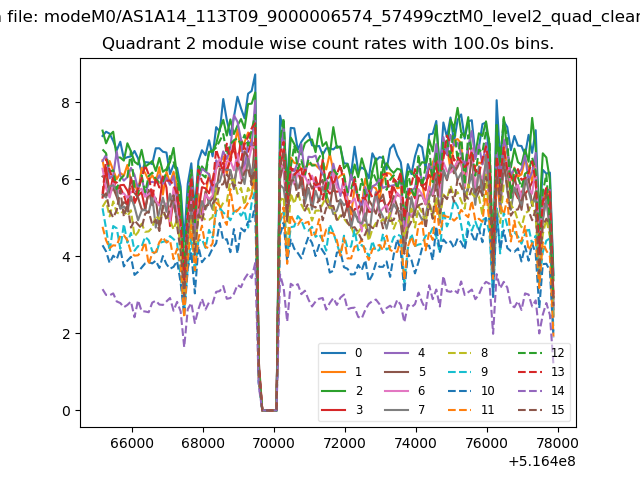
| Module-wise count rates for Quadrant B Data is divided into 100 sec bins |
 |
 |
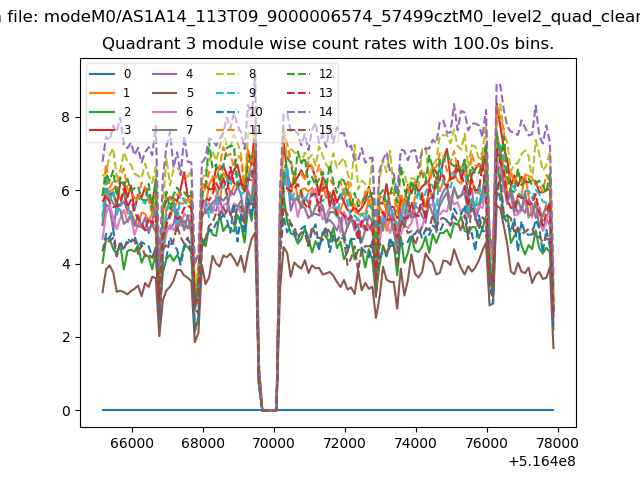
| Module-wise count rates for Quadrant C Data is divided into 100 sec bins |
 |
 |
| Module-wise count rates for Quadrant D Data is divided into 100 sec bins |
 |
 |
| Parameter | Plot |
|---|---|
| CZT HV Monitor | 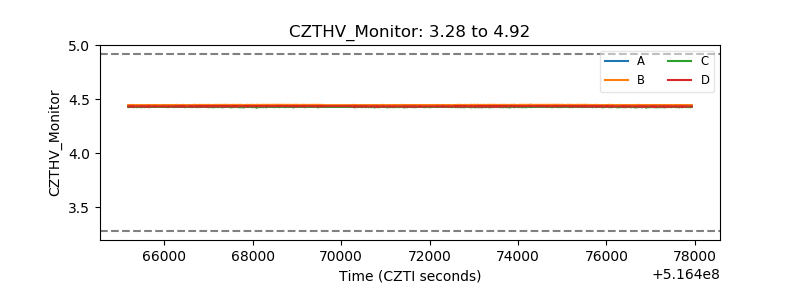 |
| D_VDD | 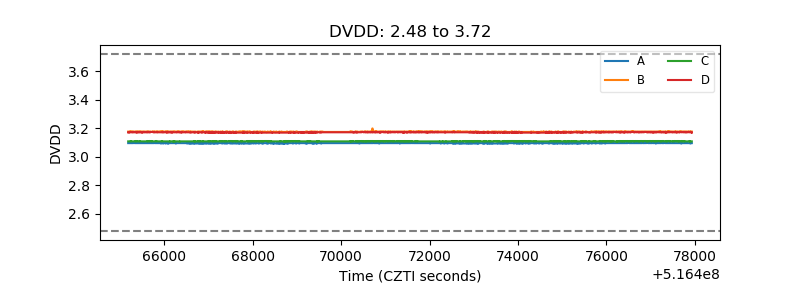 |
| Temperature 1 | 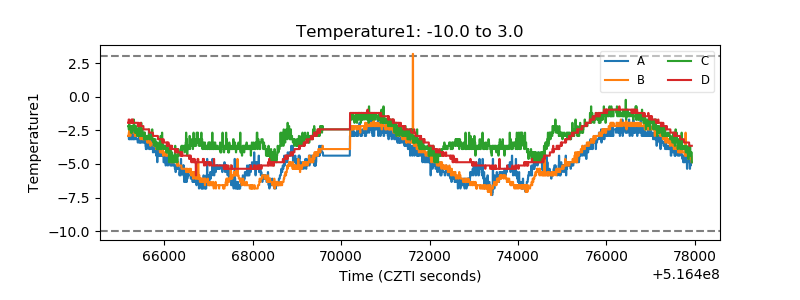 |
| Veto HV Monitor | 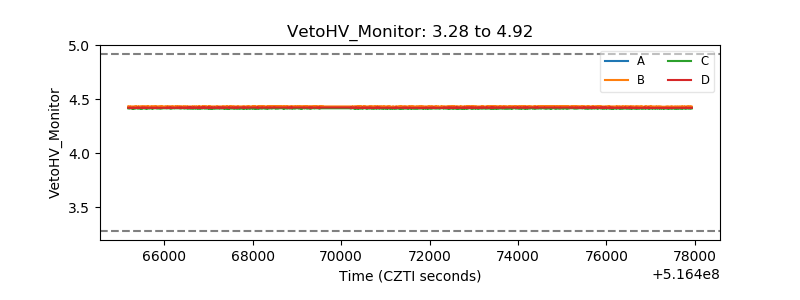 |
| Veto LLD | 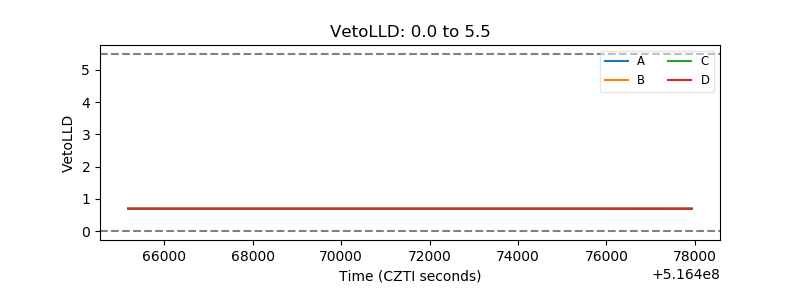 |
| Alpha Counter | 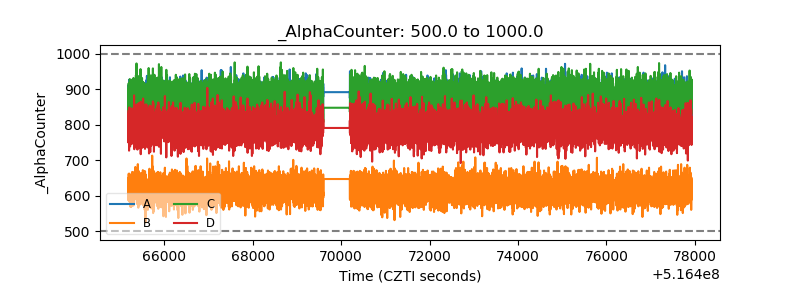 |
| _CPM_Rate | 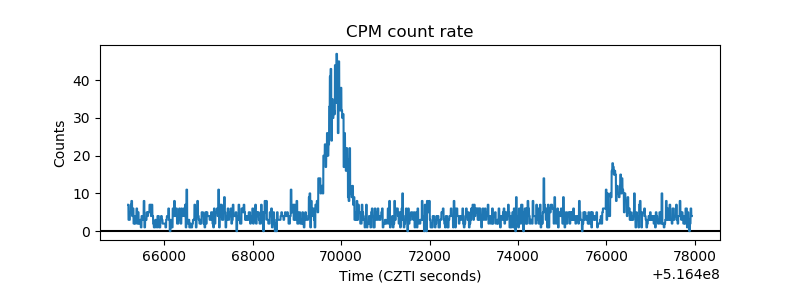 |
| CZT Counter | 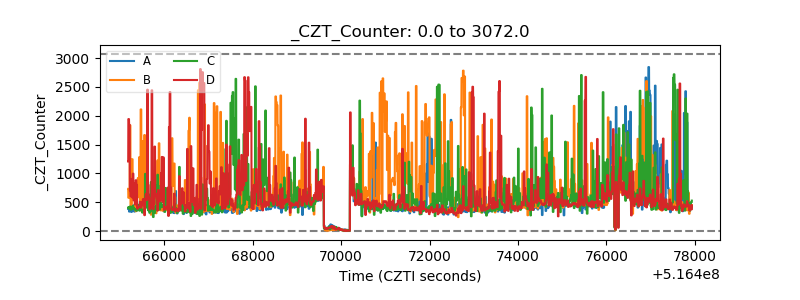 |
| +2.5 Volts monitor | 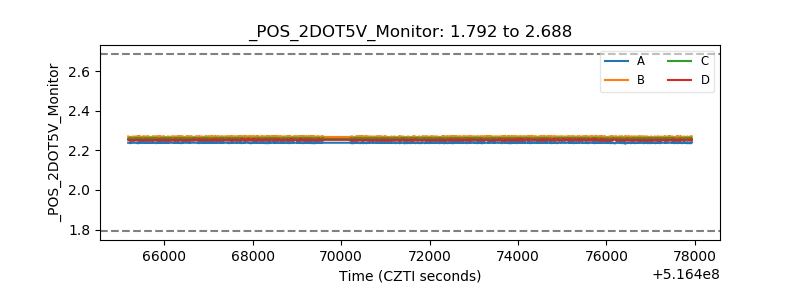 |
| +5 Volts monitor | 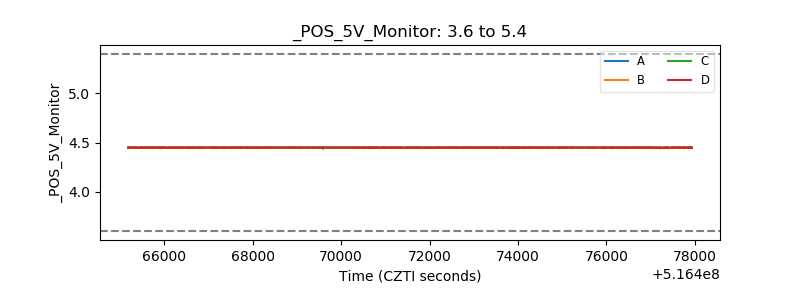 |
| _ROLL_ROT | 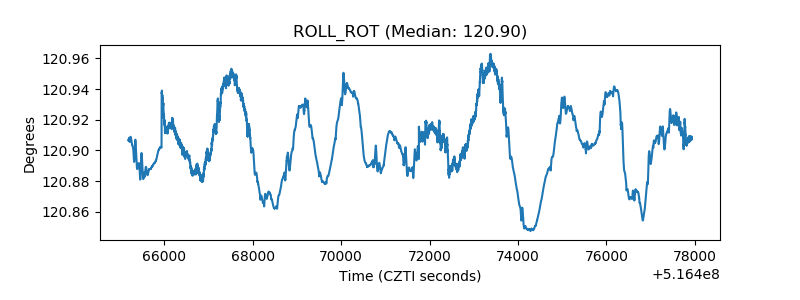 |
| _Roll_DEC | 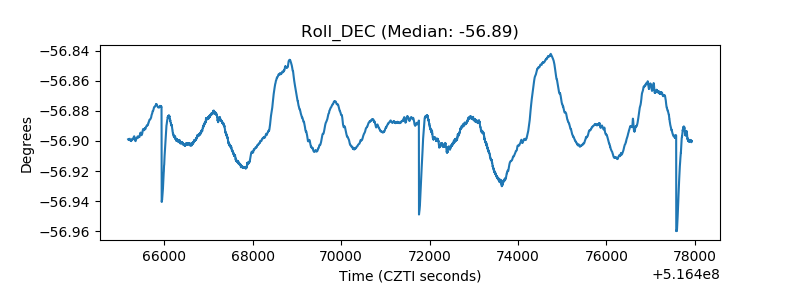 |
| _Roll_RA | 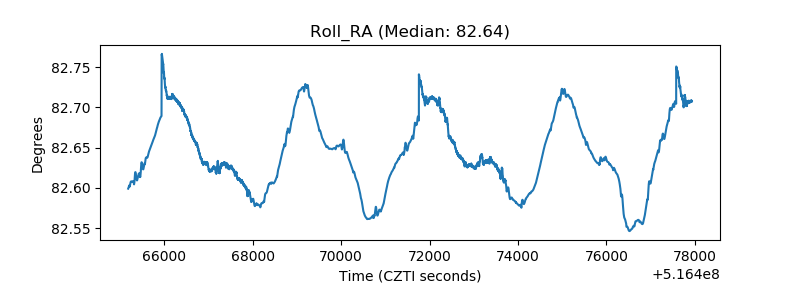 |
| Veto Counter | 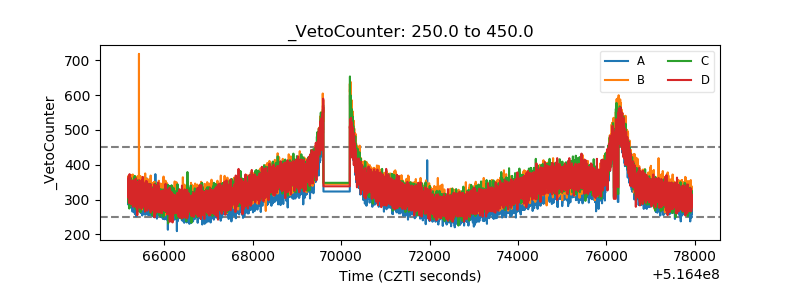 |