| Param | Original file | Final file |
|---|---|---|
| Filename | modeM0/AS1A14_113T09_9000006574_57500cztM0_level2.fits | modeM0/AS1A14_113T09_9000006574_57500cztM0_level2_quad_clean.evt |
| Size (bytes) | 560,122,560 | 111,329,280 |
| Size | 534.2 MB | 106.2 MB |
| Events in quadrant A | 4,755,639 | 713,763 |
| Events in quadrant B | 5,073,643 | 769,117 |
| Events in quadrant C | 5,445,790 | 684,259 |
| Events in quadrant D | 4,849,598 | 658,070 |
| Mode SS | |||
|---|---|---|---|
| Quadrant | BADHDUFLAG | Total packets | Discarded packets |
| A | 0 | 156 | 0 |
| B | 0 | 156 | 0 |
| C | 0 | 156 | 0 |
| D | 0 | 156 | 0 |
| Mode M0 | |||
|---|---|---|---|
| Quadrant | BADHDUFLAG | Total packets | Discarded packets |
| A | 0 | 19936 | 0 |
| B | 0 | 20564 | 1 |
| C | 0 | 21804 | 0 |
| D | 0 | 20032 | 0 |
| Quadrant | Total seconds | Saturated seconds | Saturation percentage |
|---|---|---|---|
| A | 7849 | 394 | 5.019748% |
| B | 7848 | 372 | 4.740061% |
| C | 7848 | 376 | 4.791030% |
| D | 7848 | 215 | 2.739551% |
Noise dominated data is calculated using 1-second bins in cleaned event files. If a bin has >2000 counts, and if more than 50% of those come from <1% of pixels, then it is considered to be noise-dominated and hence unusable.
| Quadrant | # 1 sec bins | Bins with >0 counts | Bins with >2000 counts | High rate bins dominated by noise | Noise dominated (total time) | Noise dominated (detector-on time) | Marked lightcurve |
|---|---|---|---|---|---|---|---|
| A | 7849 | 7849 | 274 | 274 | 3.49% | 3.49% | 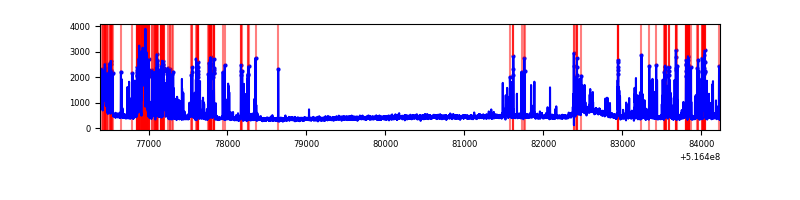 |
| B | 7848 | 7848 | 184 | 184 | 2.34% | 2.34% | 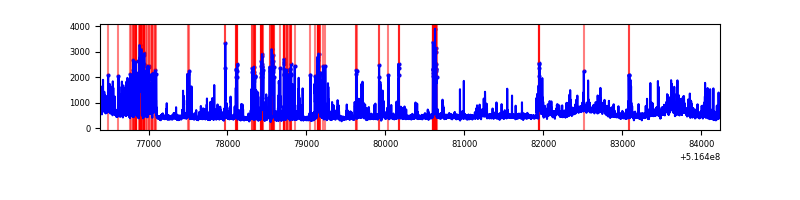 |
| C | 7848 | 7848 | 303 | 303 | 3.86% | 3.86% | 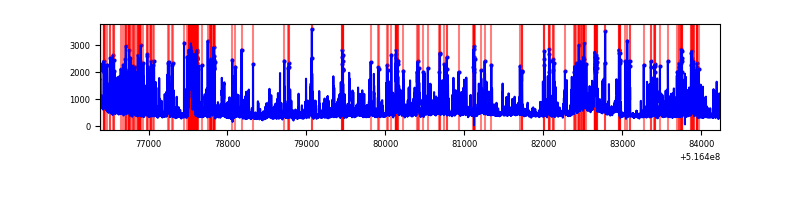 |
| D | 7848 | 7848 | 203 | 203 | 2.59% | 2.59% | 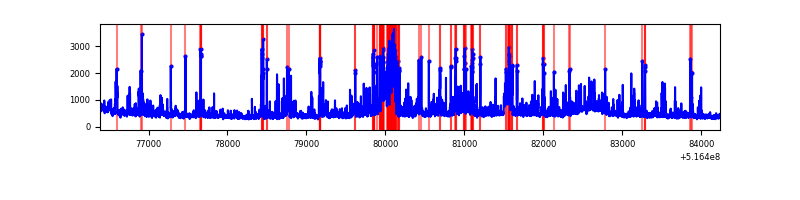 |
Top three noisy pixels from each quadrant. If the there are fewer than three noisy pixels in the level2.evt file, extra rows are filled as -1
| Pixel properties | Quadrant properties | ||||||
|---|---|---|---|---|---|---|---|
| Quadrant | DetID | PixID | Counts | Sigma | Mean | Median | Sigma |
| A | 13 | 248 | 1439781 | 6991.71 | 839 | 817 | 205.8 |
| A | 13 | 153 | 30304 | 143.27 | 839 | 817 | 205.8 |
| A | 7 | 14 | 13832 | 63.24 | 839 | 817 | 205.8 |
| B | 4 | 206 | 1142573 | 6323.44 | 833 | 801 | 180.6 |
| B | 5 | 185 | 152090 | 837.88 | 833 | 801 | 180.6 |
| B | 10 | 247 | 119649 | 658.21 | 833 | 801 | 180.6 |
| C | 15 | 224 | 1851603 | 8530.35 | 807 | 800 | 217.0 |
| C | 13 | 16 | 176486 | 809.73 | 807 | 800 | 217.0 |
| C | 14 | 254 | 144664 | 663.07 | 807 | 800 | 217.0 |
| D | 8 | 240 | 789294 | 3436.71 | 815 | 777 | 229.4 |
| D | 15 | 142 | 430844 | 1874.42 | 815 | 777 | 229.4 |
| D | 2 | 31 | 101789 | 440.26 | 815 | 777 | 229.4 |
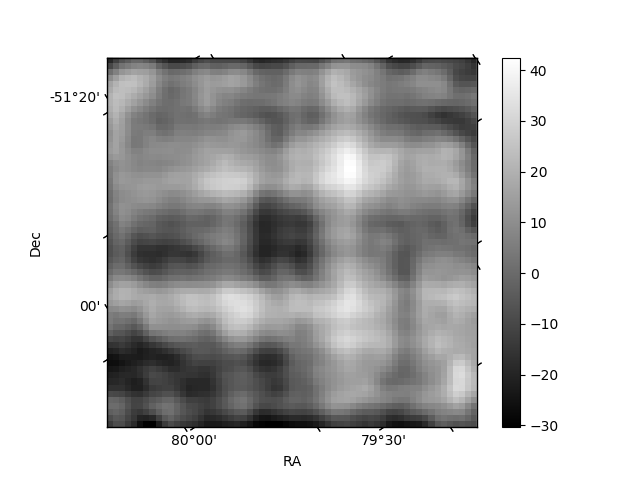
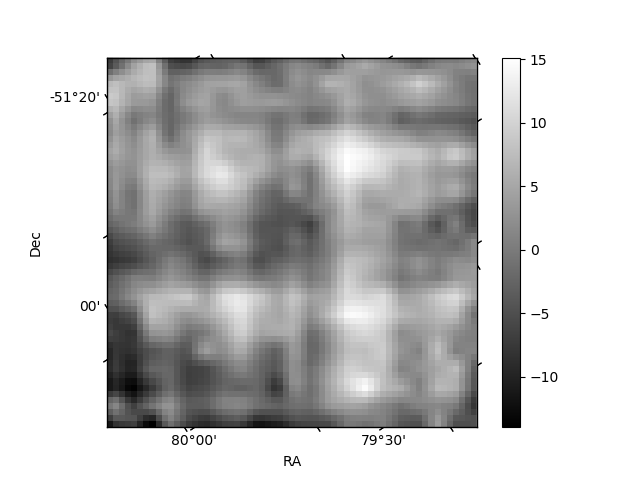
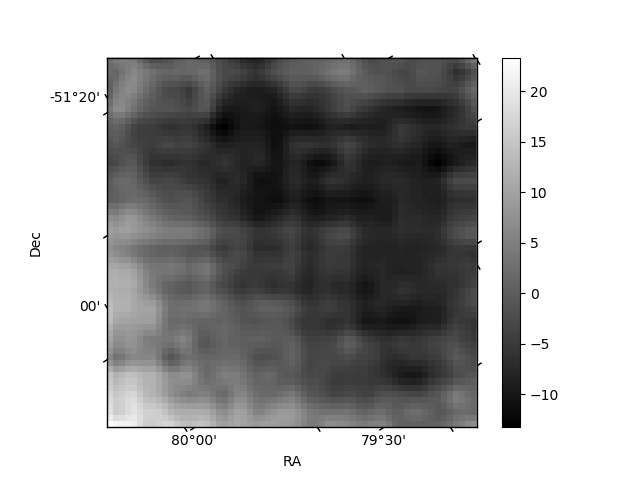
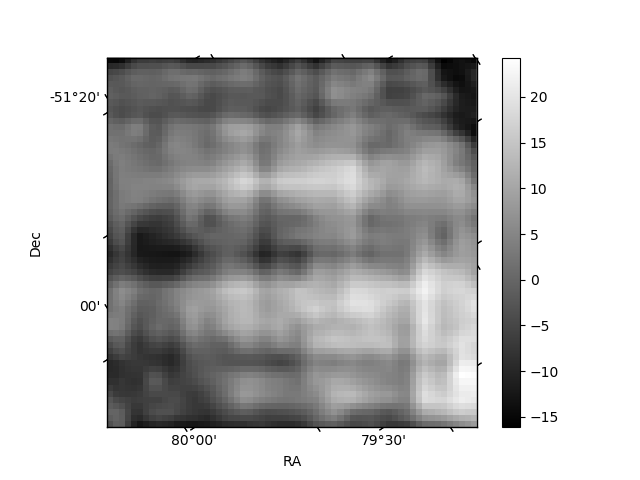
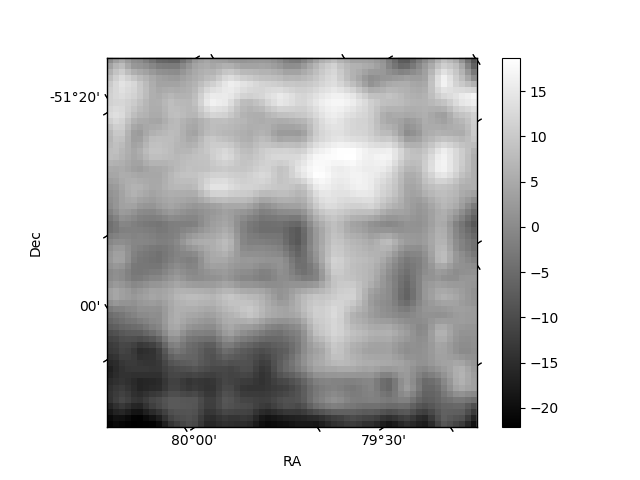
Histogram calculated using DETX and DETY for each event in the final _common_clean file
| Quadrant A | 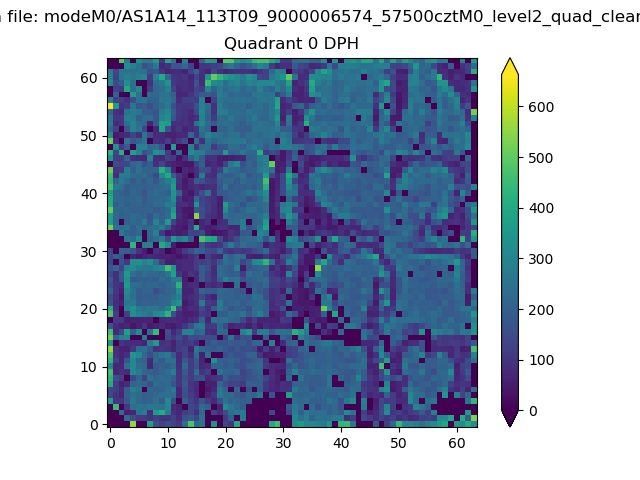 |
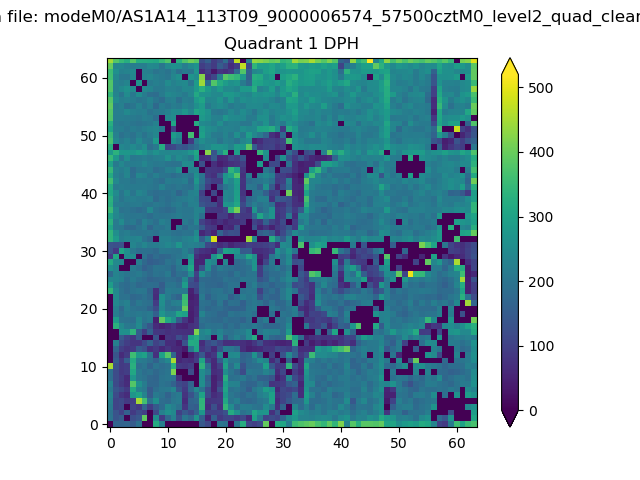 |
Quadrant B |
|---|---|---|---|
| Quadrant D | 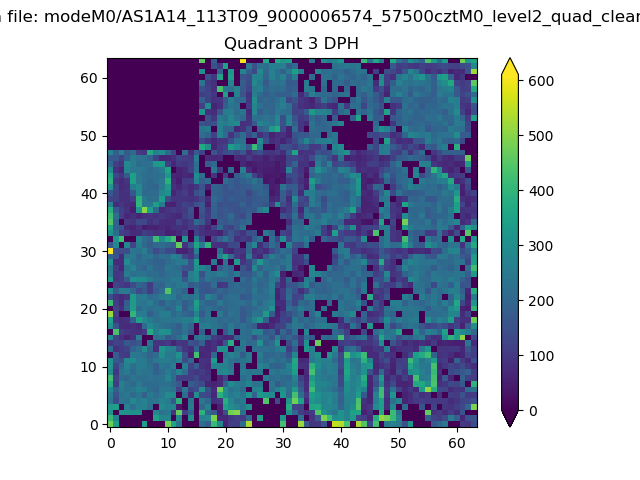 |
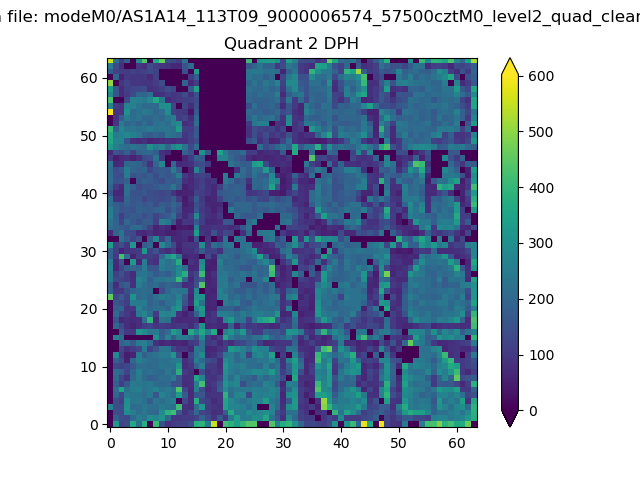 |
Quadrant C |
| Plot type | Count rate plots | Images |
|---|---|---|
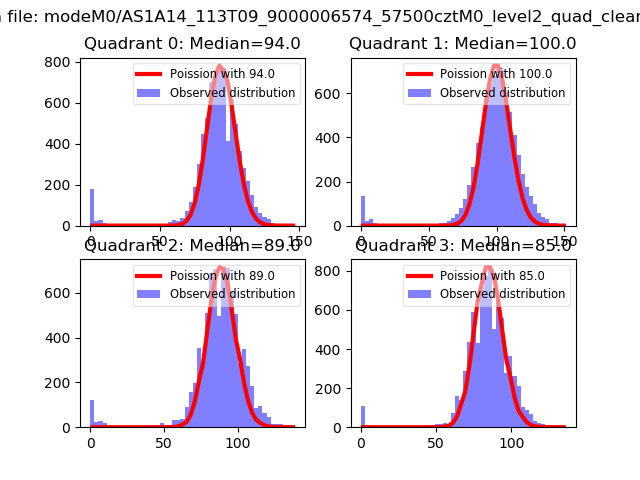
| Comparison with Poisson distribution Blue bars denote a histogram of data divided into 1 sec bins. Red curve is a Poisson curve with rate = median count rate of data. |
 |
 |
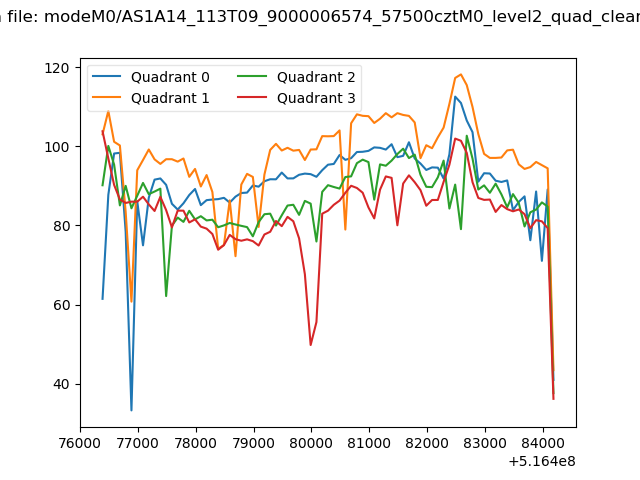
| Quadrant-wise count rates Data is divided into 100 sec bins |
 |
|
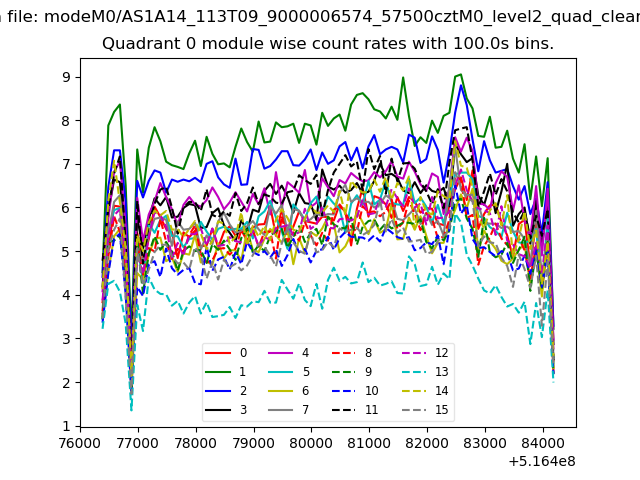
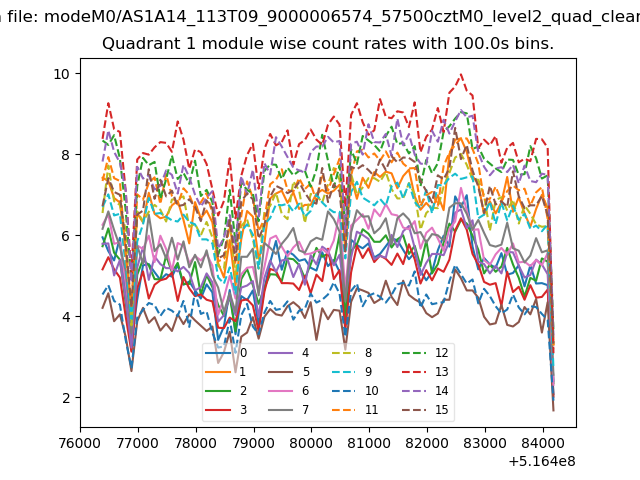
| Module-wise count rates for Quadrant A Data is divided into 100 sec bins |
 |
 |
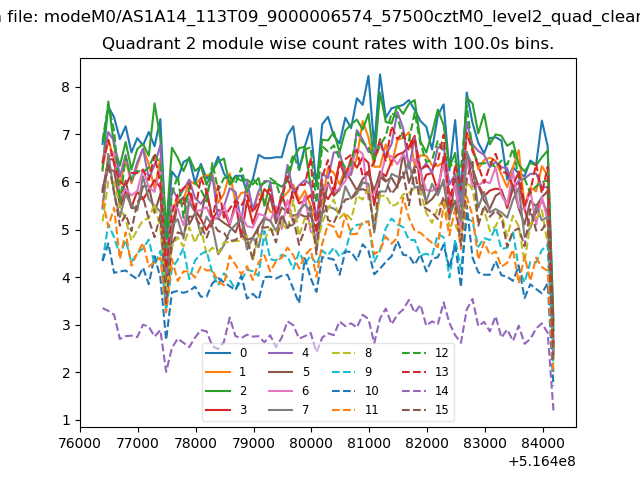
| Module-wise count rates for Quadrant B Data is divided into 100 sec bins |
 |
 |
| Module-wise count rates for Quadrant C Data is divided into 100 sec bins |
 |
 |
| Module-wise count rates for Quadrant D Data is divided into 100 sec bins |
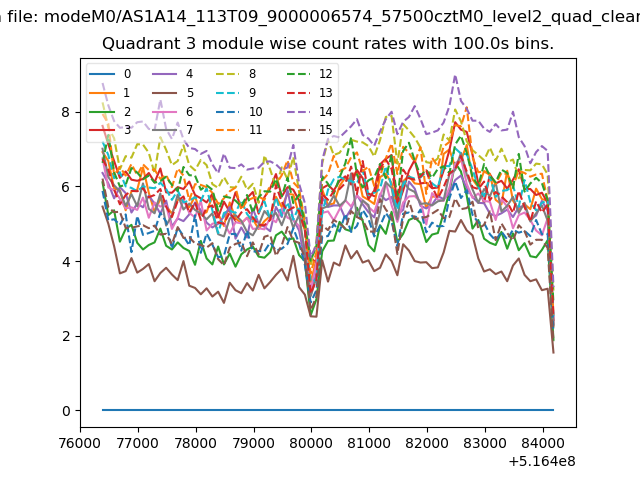 |
 |
| Parameter | Plot |
|---|---|
| CZT HV Monitor | 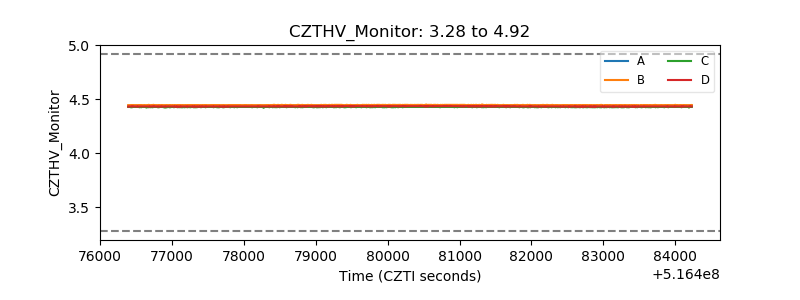 |
| D_VDD | 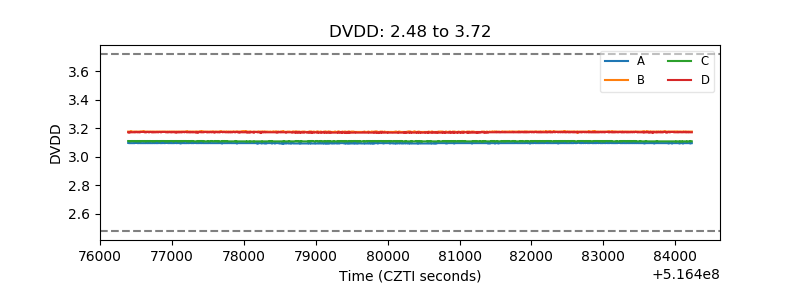 |
| Temperature 1 | 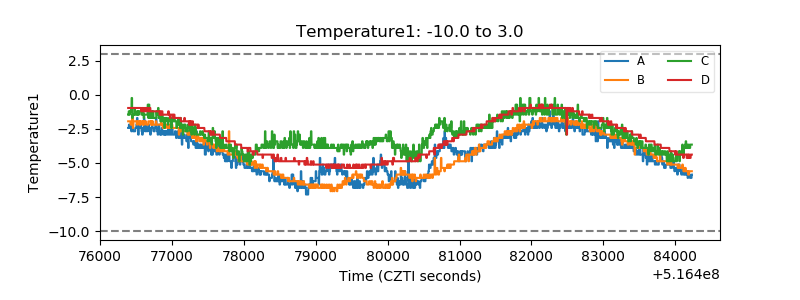 |
| Veto HV Monitor | 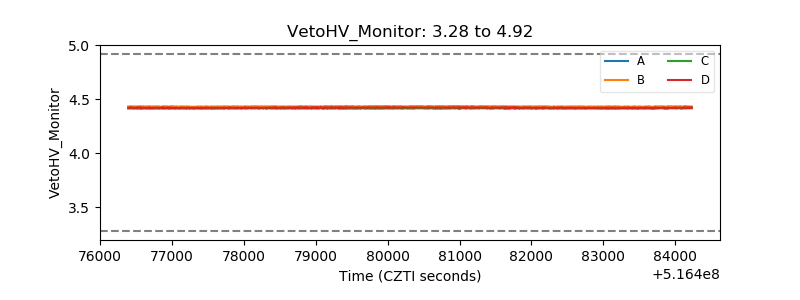 |
| Veto LLD | 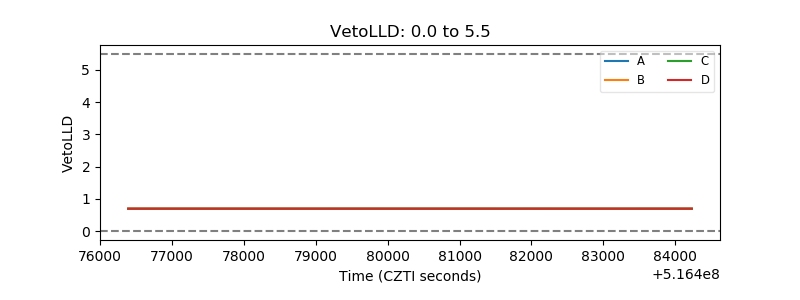 |
| Alpha Counter | 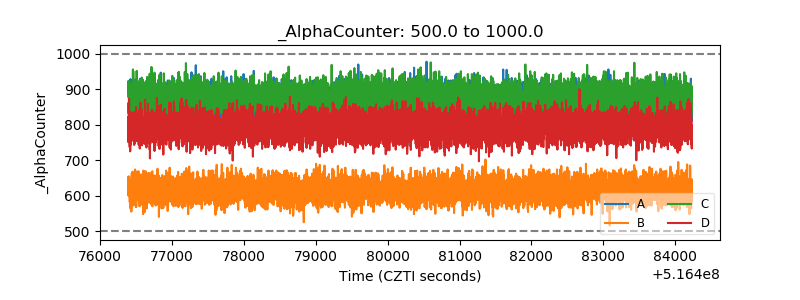 |
| _CPM_Rate | 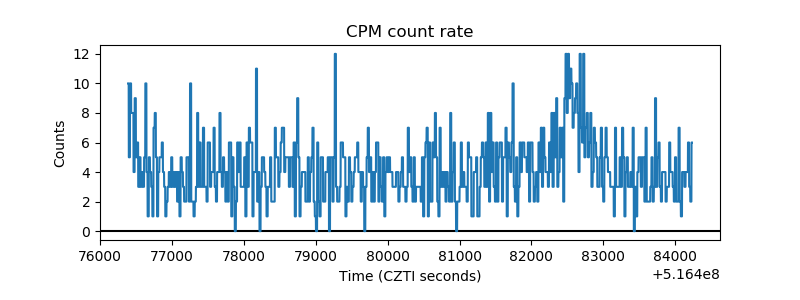 |
| CZT Counter | 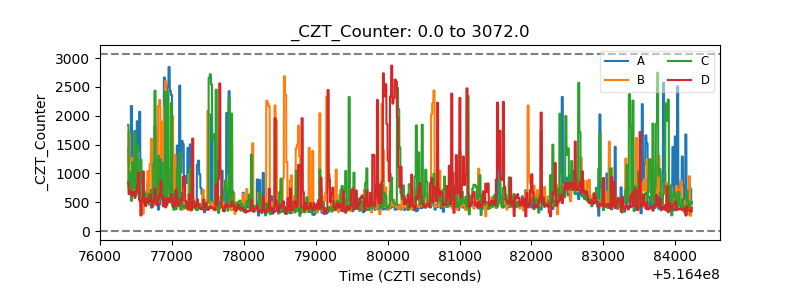 |
| +2.5 Volts monitor |  |
| +5 Volts monitor |  |
| _ROLL_ROT | 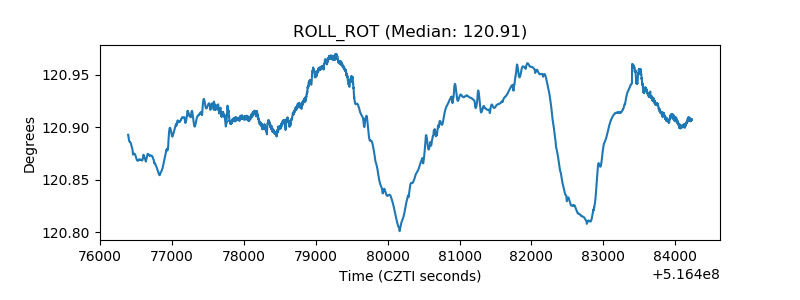 |
| _Roll_DEC | 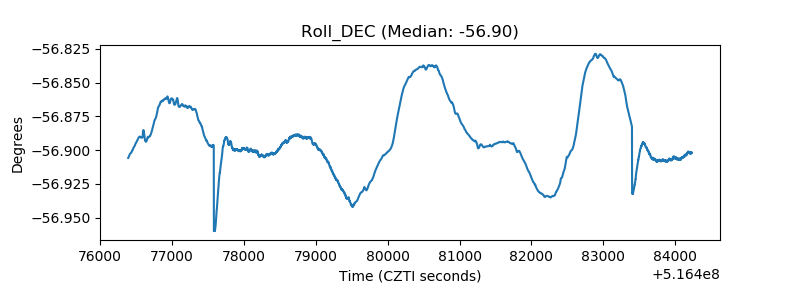 |
| _Roll_RA | 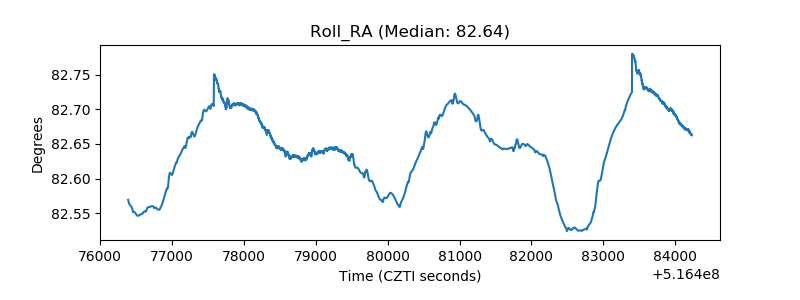 |
| Veto Counter | 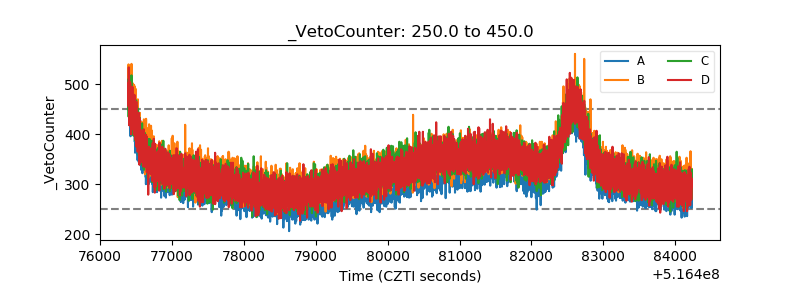 |