| Param | Original file | Final file |
|---|---|---|
| Filename | modeM0/AS1A14_113T09_9000006574_57501cztM0_level2.fits | modeM0/AS1A14_113T09_9000006574_57501cztM0_level2_quad_clean.evt |
| Size (bytes) | 569,430,720 | 116,919,360 |
| Size | 543.1 MB | 111.5 MB |
| Events in quadrant A | 4,301,235 | 769,843 |
| Events in quadrant B | 5,131,024 | 813,876 |
| Events in quadrant C | 6,412,628 | 696,863 |
| Events in quadrant D | 4,595,101 | 687,938 |
| Mode SS | |||
|---|---|---|---|
| Quadrant | BADHDUFLAG | Total packets | Discarded packets |
| A | 0 | 166 | 0 |
| B | 0 | 166 | 0 |
| C | 0 | 166 | 0 |
| D | 0 | 166 | 0 |
| Mode M9 | |||
|---|---|---|---|
| Quadrant | BADHDUFLAG | Total packets | Discarded packets |
| A | 0 | 1 | 0 |
| B | 0 | 1 | 0 |
| C | 0 | 1 | 0 |
| D | 0 | 1 | 0 |
| Mode M0 | |||
|---|---|---|---|
| Quadrant | BADHDUFLAG | Total packets | Discarded packets |
| A | 0 | 18865 | 1 |
| B | 0 | 20821 | 1 |
| C | 0 | 24953 | 1 |
| D | 0 | 19702 | 1 |
| Quadrant | Total seconds | Saturated seconds | Saturation percentage |
|---|---|---|---|
| A | 8224 | 190 | 2.310311% |
| B | 8225 | 255 | 3.100304% |
| C | 8225 | 652 | 7.927052% |
| D | 8225 | 223 | 2.711246% |
Noise dominated data is calculated using 1-second bins in cleaned event files. If a bin has >2000 counts, and if more than 50% of those come from <1% of pixels, then it is considered to be noise-dominated and hence unusable.
| Quadrant | # 1 sec bins | Bins with >0 counts | Bins with >2000 counts | High rate bins dominated by noise | Noise dominated (total time) | Noise dominated (detector-on time) | Marked lightcurve |
|---|---|---|---|---|---|---|---|
| A | 8299 | 8225 | 103 | 103 | 1.24% | 1.25% | 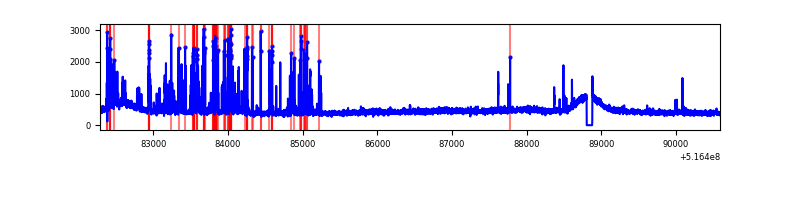 |
| B | 8300 | 8226 | 35 | 35 | 0.42% | 0.43% | 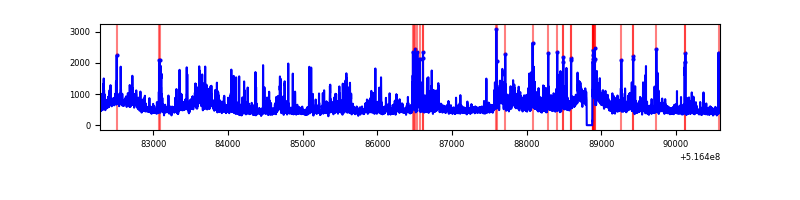 |
| C | 8300 | 8226 | 514 | 514 | 6.19% | 6.25% | 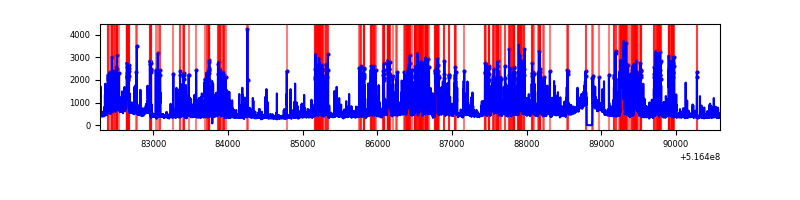 |
| D | 8300 | 8226 | 134 | 134 | 1.61% | 1.63% | 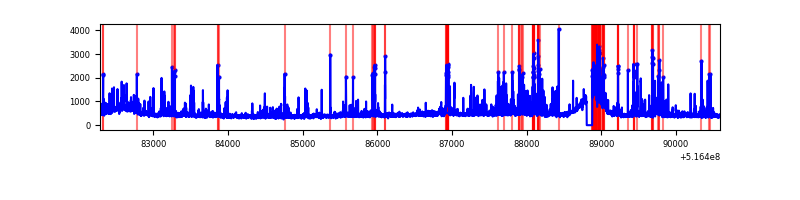 |
Top three noisy pixels from each quadrant. If the there are fewer than three noisy pixels in the level2.evt file, extra rows are filled as -1
| Pixel properties | Quadrant properties | ||||||
|---|---|---|---|---|---|---|---|
| Quadrant | DetID | PixID | Counts | Sigma | Mean | Median | Sigma |
| A | 13 | 248 | 661130 | 2927.35 | 914 | 886 | 225.5 |
| A | 3 | 128 | 43856 | 190.52 | 914 | 886 | 225.5 |
| A | 3 | 245 | 29905 | 128.66 | 914 | 886 | 225.5 |
| B | 4 | 206 | 1137267 | 5798.76 | 900 | 866 | 196.0 |
| B | 0 | 245 | 74436 | 375.41 | 900 | 866 | 196.0 |
| B | 7 | 252 | 57710 | 290.06 | 900 | 866 | 196.0 |
| C | 15 | 224 | 2625047 | 11412.51 | 854 | 845 | 229.9 |
| C | 6 | 223 | 141613 | 612.19 | 854 | 845 | 229.9 |
| C | 8 | 7 | 84300 | 362.94 | 854 | 845 | 229.9 |
| D | 8 | 240 | 834675 | 3388.1 | 870 | 831 | 246.1 |
| D | 3 | 12 | 85642 | 344.61 | 870 | 831 | 246.1 |
| D | 5 | 173 | 82993 | 333.84 | 870 | 831 | 246.1 |
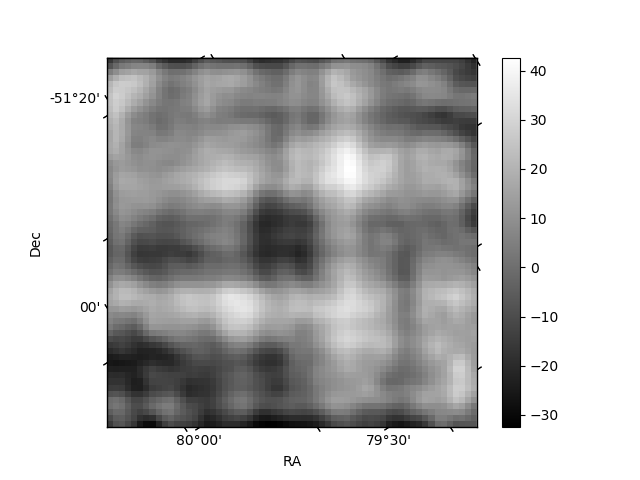
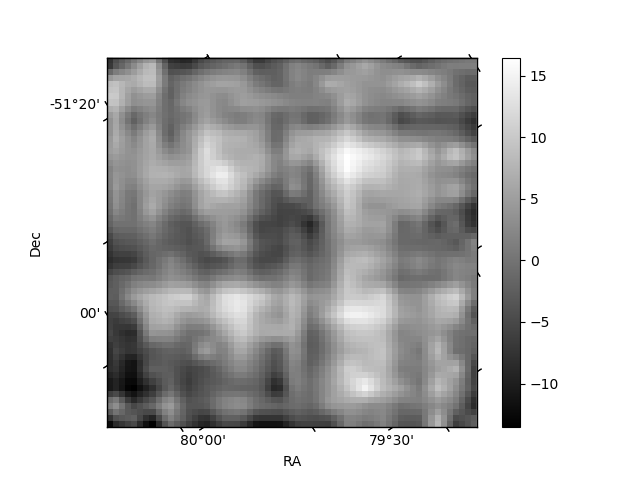
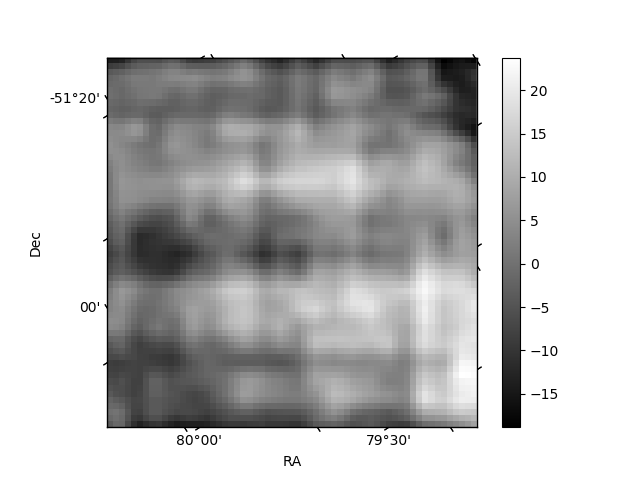
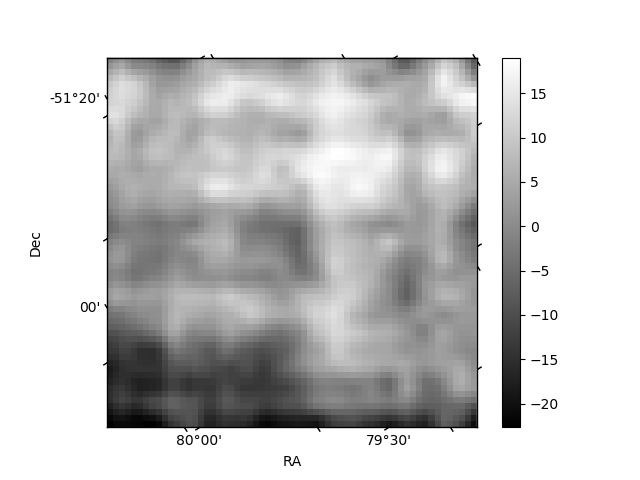
Histogram calculated using DETX and DETY for each event in the final _common_clean file
| Quadrant A | 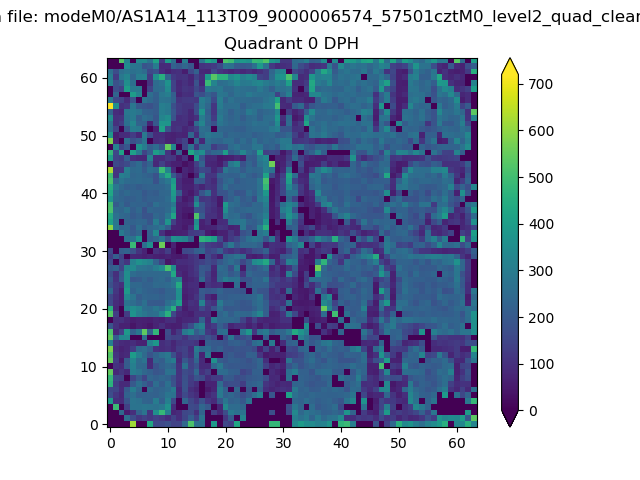 |
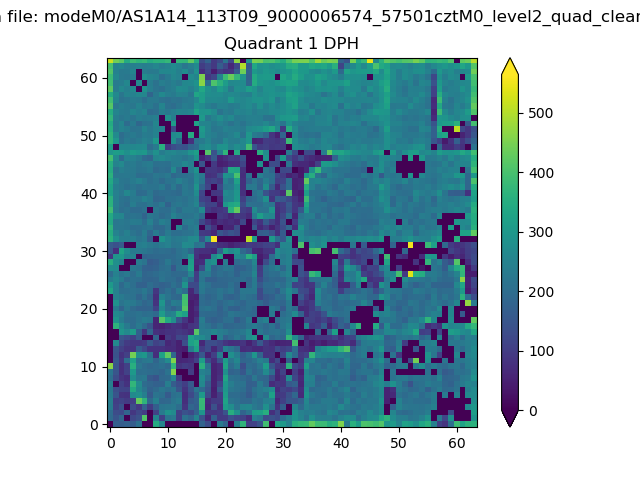 |
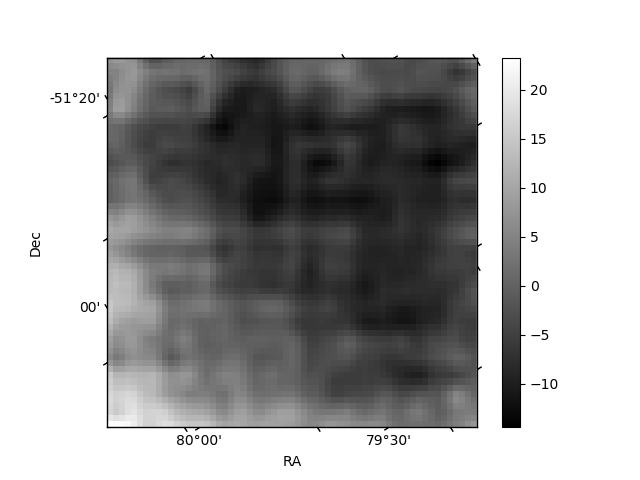
Quadrant B |
|---|---|---|---|
| Quadrant D | 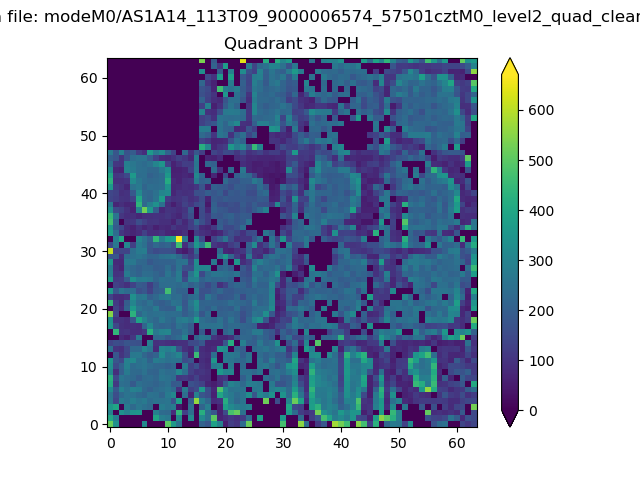 |
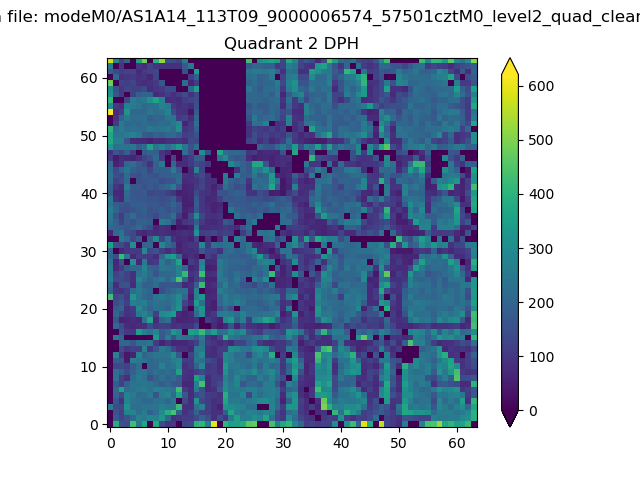 |
Quadrant C |
| Plot type | Count rate plots | Images |
|---|---|---|
| Comparison with Poisson distribution Blue bars denote a histogram of data divided into 1 sec bins. Red curve is a Poisson curve with rate = median count rate of data. |
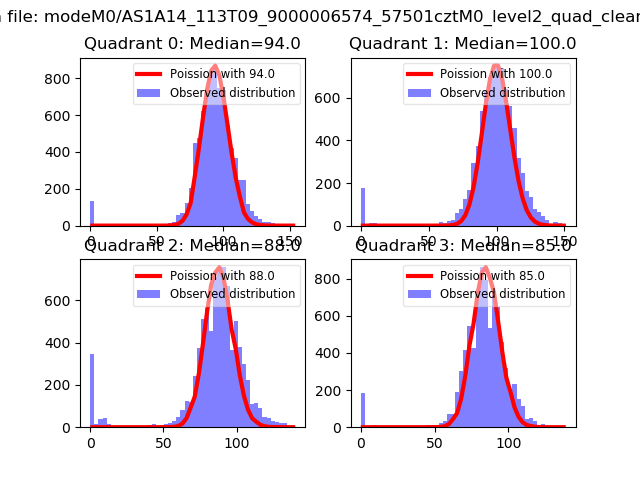 |
 |
| Quadrant-wise count rates Data is divided into 100 sec bins |
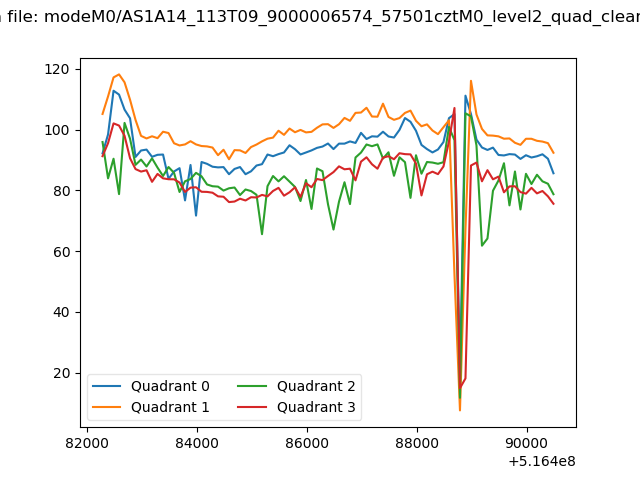 |
|
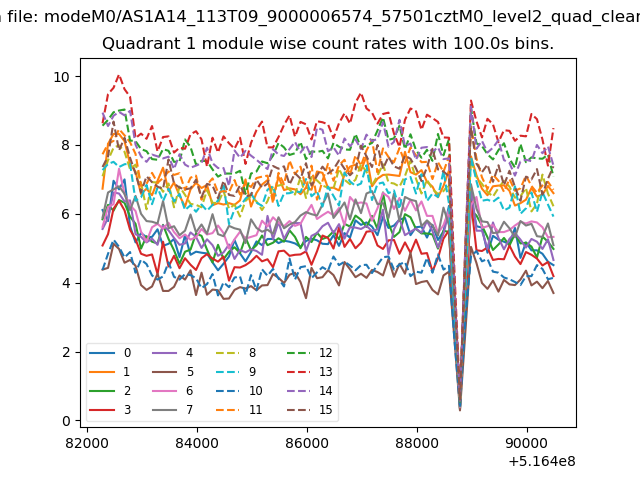
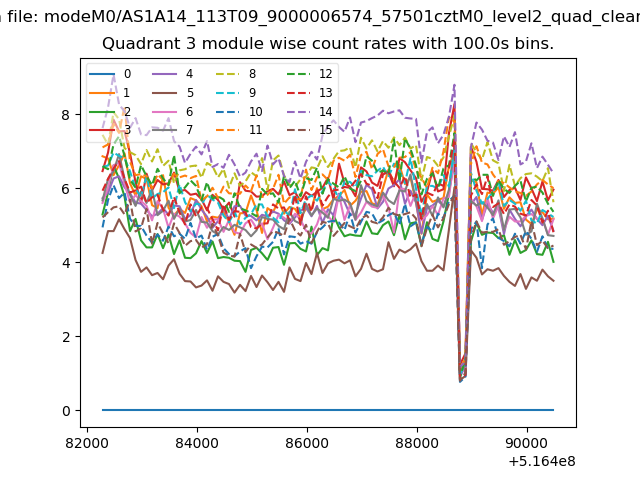
| Module-wise count rates for Quadrant A Data is divided into 100 sec bins |
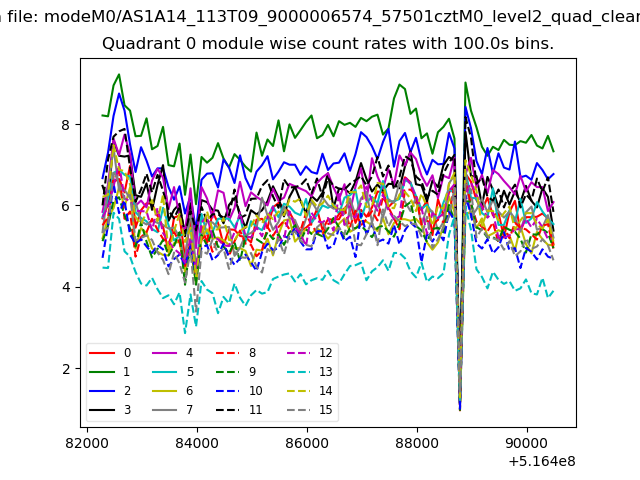 |
 |
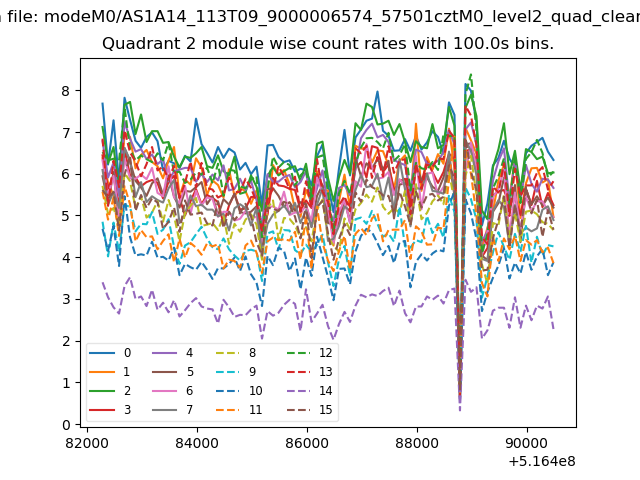
| Module-wise count rates for Quadrant B Data is divided into 100 sec bins |
 |
 |
| Module-wise count rates for Quadrant C Data is divided into 100 sec bins |
 |
 |
| Module-wise count rates for Quadrant D Data is divided into 100 sec bins |
 |
 |
| Parameter | Plot |
|---|---|
| CZT HV Monitor | 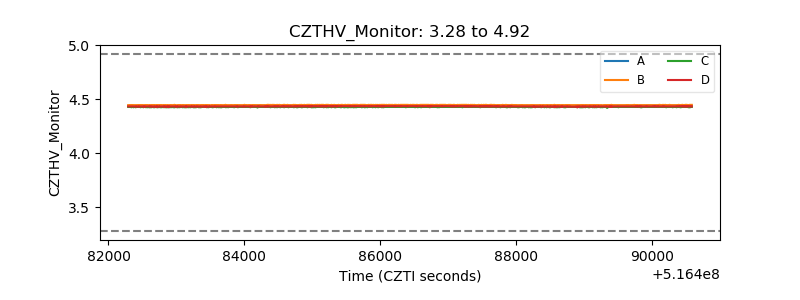 |
| D_VDD | 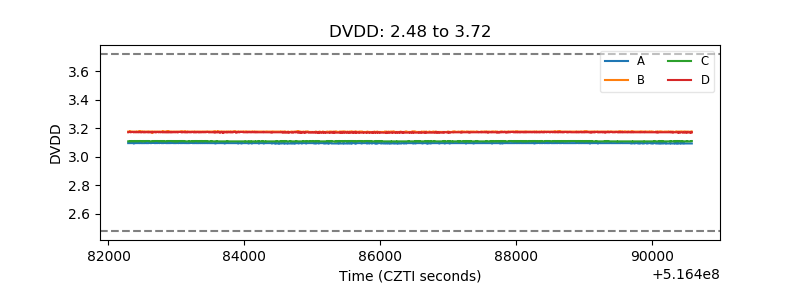 |
| Temperature 1 | 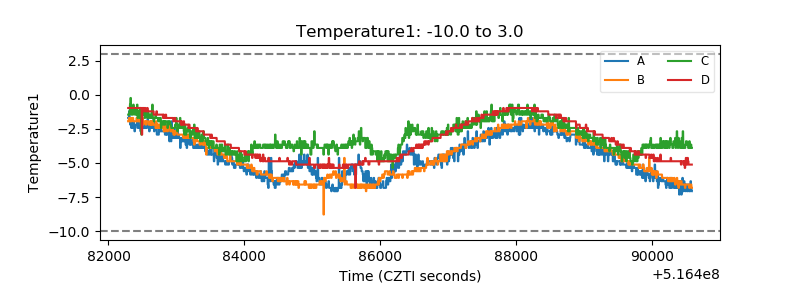 |
| Veto HV Monitor | 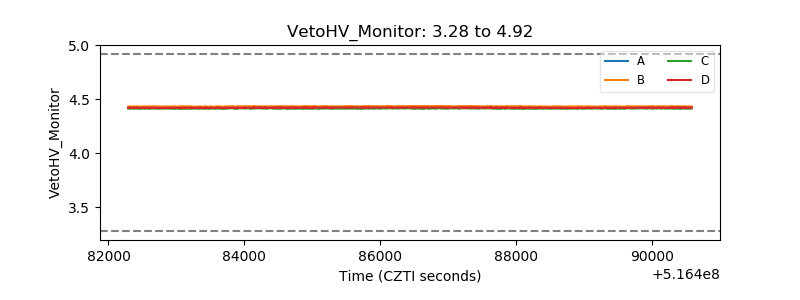 |
| Veto LLD | 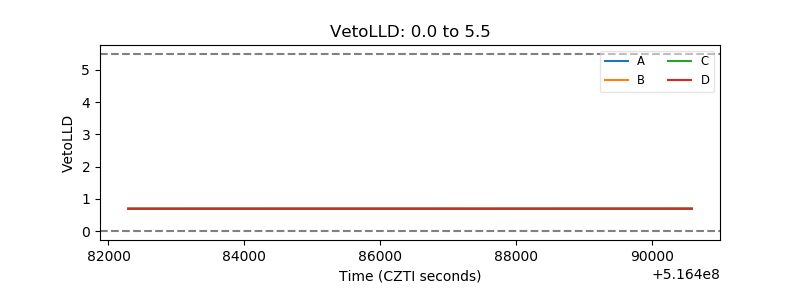 |
| Alpha Counter | 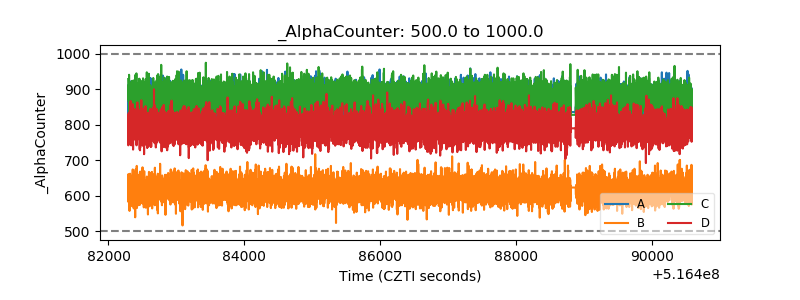 |
| _CPM_Rate | 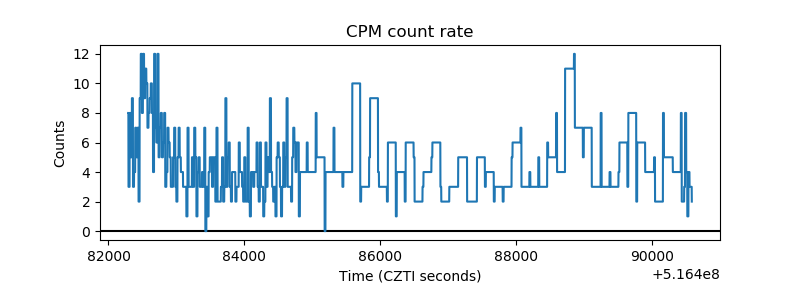 |
| CZT Counter | 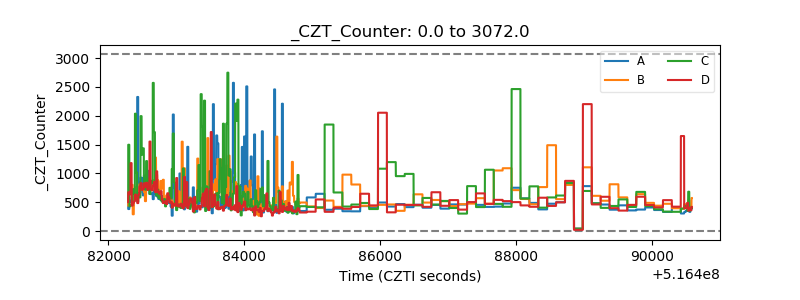 |
| +2.5 Volts monitor |  |
| +5 Volts monitor |  |
| _ROLL_ROT | 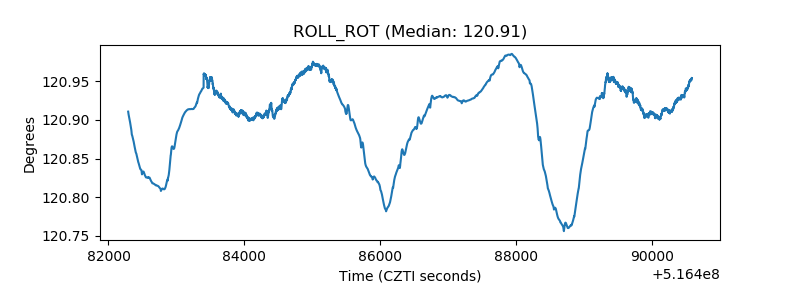 |
| _Roll_DEC | 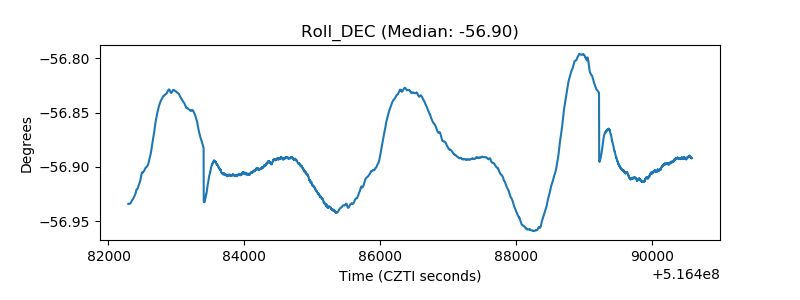 |
| _Roll_RA | 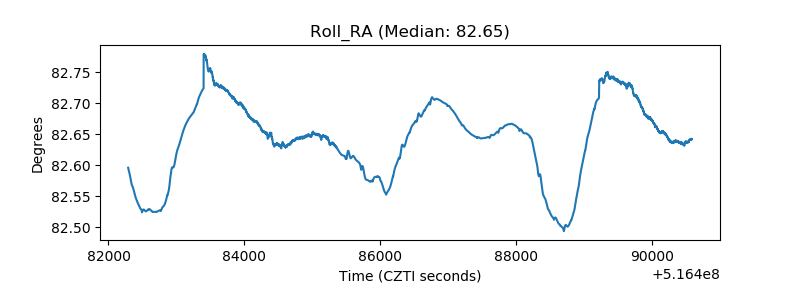 |
| Veto Counter | 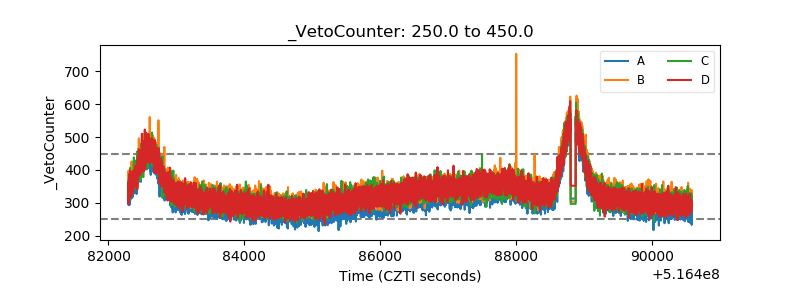 |