| Param | Original file | Final file |
|---|---|---|
| Filename | modeM0/AS1A14_113T09_9000006574_57504cztM0_level2.fits | modeM0/AS1A14_113T09_9000006574_57504cztM0_level2_quad_clean.evt |
| Size (bytes) | 1,507,777,920 | 261,342,720 |
| Size | 1.4 GB | 249.2 MB |
| Events in quadrant A | 9,567,207 | 1,780,093 |
| Events in quadrant B | 11,409,967 | 1,863,601 |
| Events in quadrant C | 17,642,561 | 1,555,386 |
| Events in quadrant D | 15,699,636 | 1,382,274 |
| Mode SS | |||
|---|---|---|---|
| Quadrant | BADHDUFLAG | Total packets | Discarded packets |
| A | 0 | 396 | 0 |
| B | 0 | 396 | 0 |
| C | 0 | 396 | 0 |
| D | 0 | 396 | 0 |
| Mode M9 | |||
|---|---|---|---|
| Quadrant | BADHDUFLAG | Total packets | Discarded packets |
| A | 0 | 17 | 0 |
| B | 0 | 17 | 0 |
| C | 0 | 17 | 0 |
| D | 0 | 17 | 0 |
| Mode M0 | |||
|---|---|---|---|
| Quadrant | BADHDUFLAG | Total packets | Discarded packets |
| A | 0 | 43165 | 4 |
| B | 0 | 47181 | 4 |
| C | 0 | 65789 | 5 |
| D | 0 | 60454 | 4 |
| Quadrant | Total seconds | Saturated seconds | Saturation percentage |
|---|---|---|---|
| A | 19310 | 487 | 2.522009% |
| B | 19311 | 774 | 4.008078% |
| C | 19310 | 2279 | 11.802175% |
| D | 19310 | 2512 | 13.008804% |
Noise dominated data is calculated using 1-second bins in cleaned event files. If a bin has >2000 counts, and if more than 50% of those come from <1% of pixels, then it is considered to be noise-dominated and hence unusable.
| Quadrant | # 1 sec bins | Bins with >0 counts | Bins with >2000 counts | High rate bins dominated by noise | Noise dominated (total time) | Noise dominated (detector-on time) | Marked lightcurve |
|---|---|---|---|---|---|---|---|
| A | 21100 | 19314 | 264 | 264 | 1.25% | 1.37% | 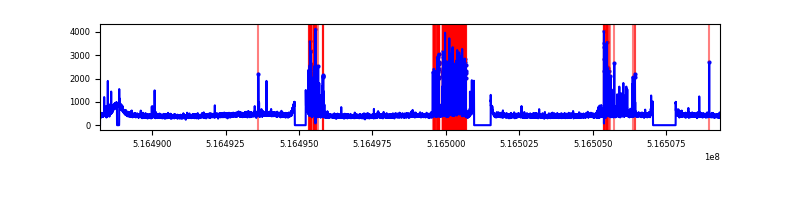 |
| B | 21101 | 19315 | 308 | 308 | 1.46% | 1.59% | 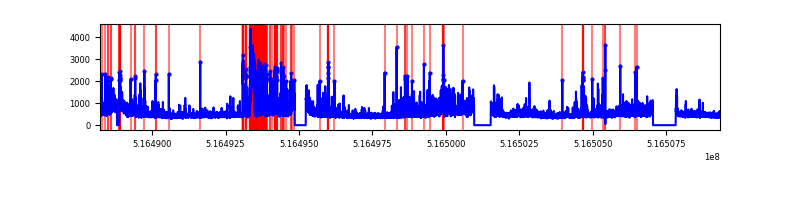 |
| C | 21100 | 19314 | 1843 | 1843 | 8.73% | 9.54% | 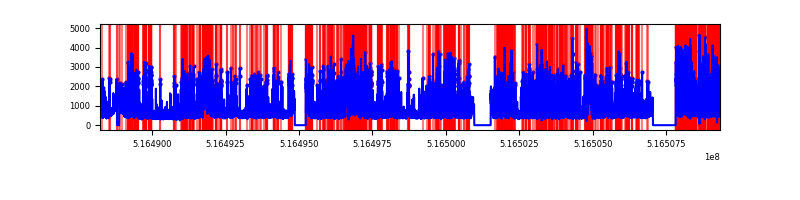 |
| D | 21100 | 19314 | 2122 | 2122 | 10.06% | 10.99% | 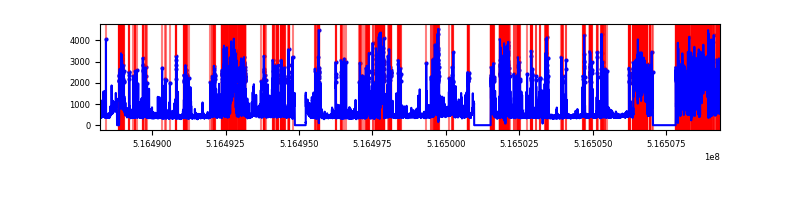 |
Top three noisy pixels from each quadrant. If the there are fewer than three noisy pixels in the level2.evt file, extra rows are filled as -1
| Pixel properties | Quadrant properties | ||||||
|---|---|---|---|---|---|---|---|
| Quadrant | DetID | PixID | Counts | Sigma | Mean | Median | Sigma |
| A | 13 | 248 | 1322487 | 2602.51 | 2092 | 2037 | 507.4 |
| A | 3 | 128 | 77833 | 149.39 | 2092 | 2037 | 507.4 |
| A | 4 | 3 | 29427 | 53.98 | 2092 | 2037 | 507.4 |
| B | 4 | 206 | 2240626 | 5107.03 | 2054 | 1974 | 438.3 |
| B | 2 | 249 | 329574 | 747.35 | 2054 | 1974 | 438.3 |
| B | 0 | 213 | 102104 | 228.43 | 2054 | 1974 | 438.3 |
| C | 15 | 224 | 8531991 | 16287.93 | 1950 | 1933 | 523.7 |
| C | 8 | 7 | 305409 | 579.48 | 1950 | 1933 | 523.7 |
| C | 6 | 223 | 285197 | 540.89 | 1950 | 1933 | 523.7 |
| D | 8 | 240 | 5220708 | 9665.32 | 1911 | 1826 | 540.0 |
| D | 15 | 142 | 1147139 | 2121.11 | 1911 | 1826 | 540.0 |
| D | 2 | 120 | 1068245 | 1975.0 | 1911 | 1826 | 540.0 |
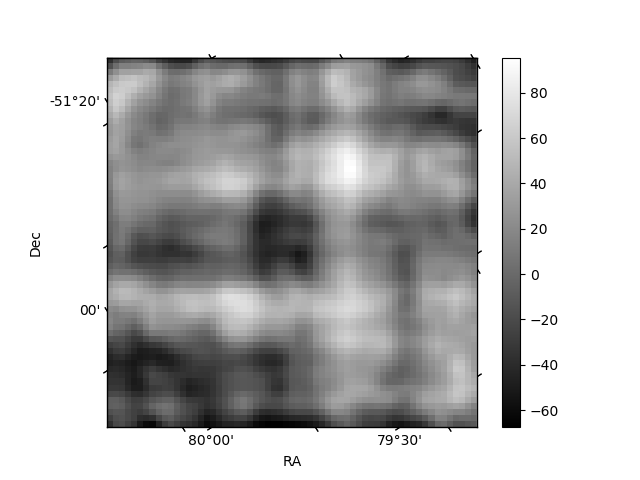
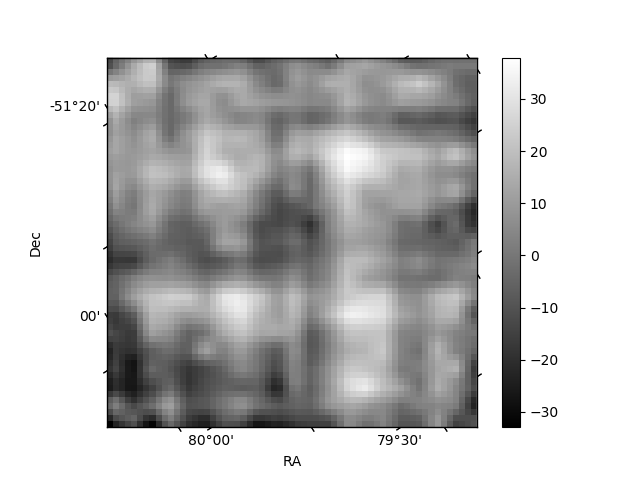
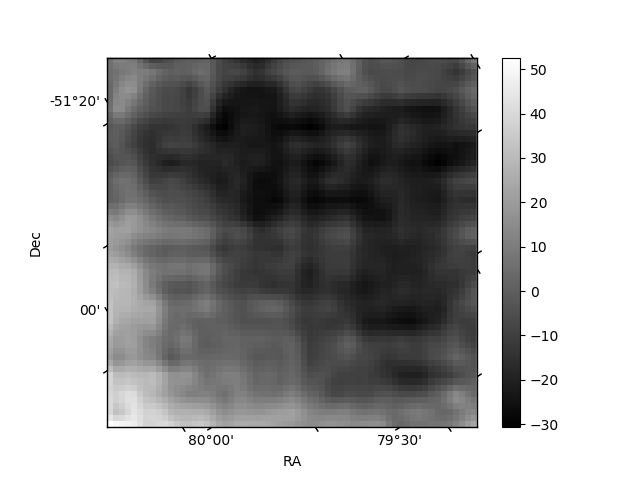
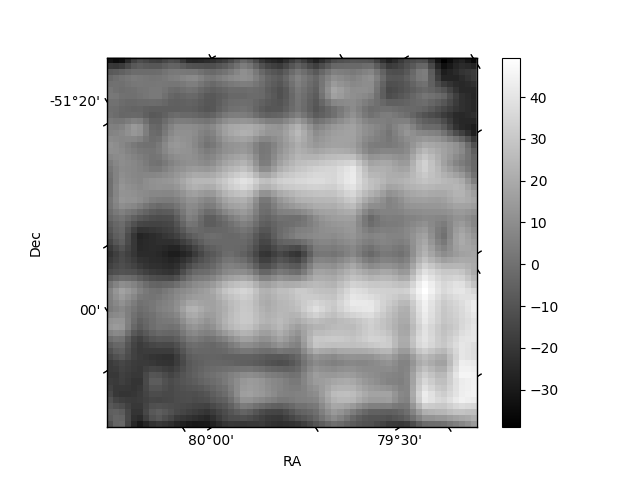
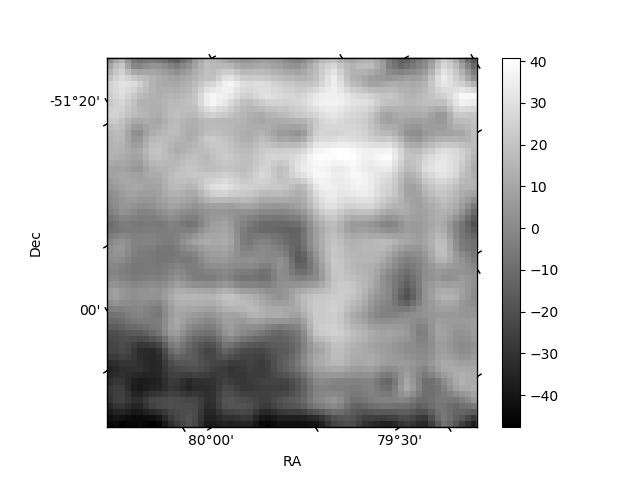
Histogram calculated using DETX and DETY for each event in the final _common_clean file
| Quadrant A | 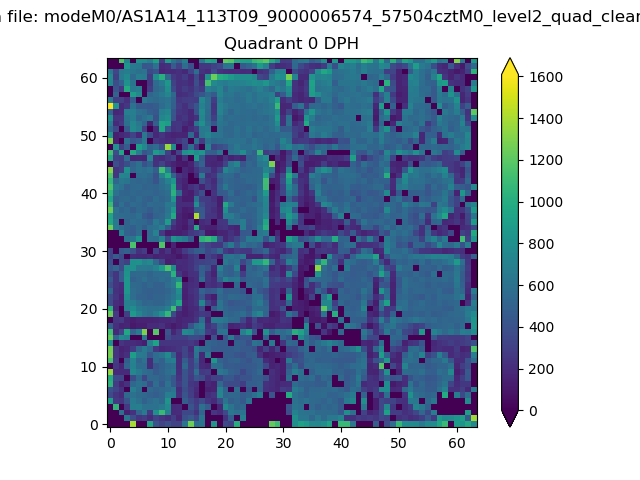 |
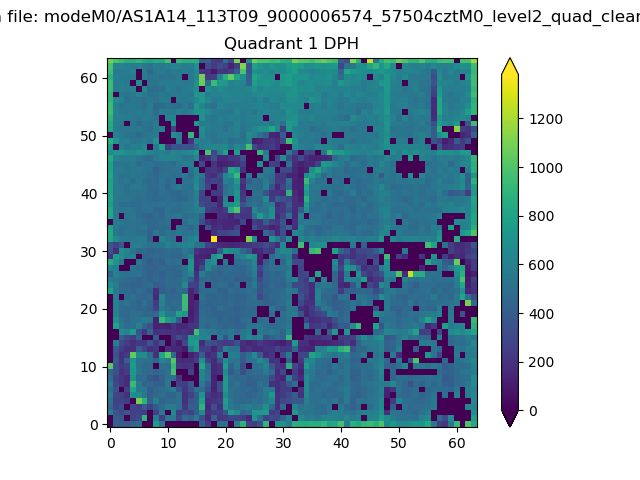 |
Quadrant B |
|---|---|---|---|
| Quadrant D | 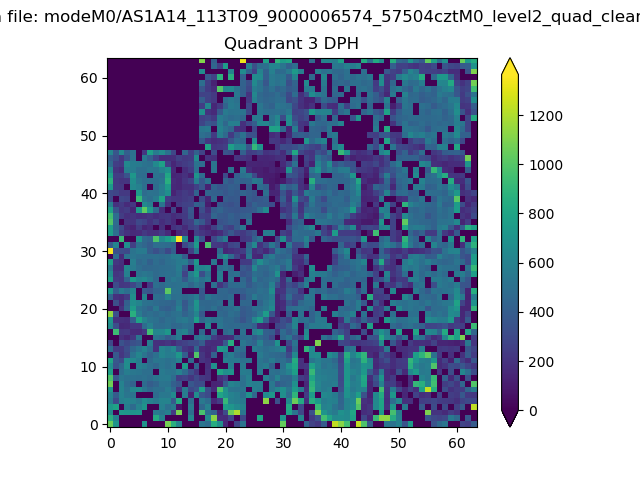 |
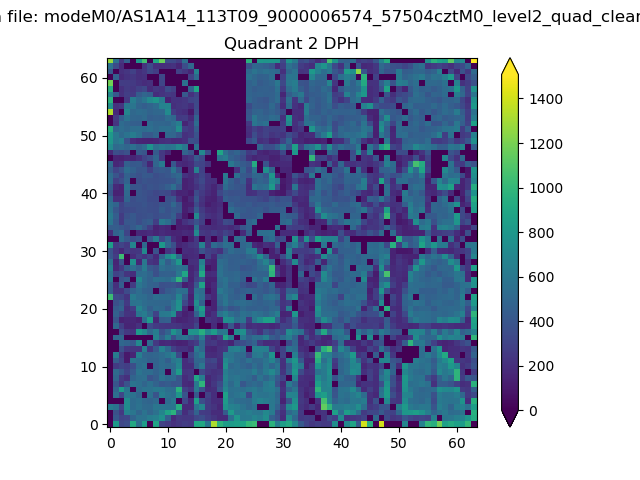 |
Quadrant C |
| Plot type | Count rate plots | Images |
|---|---|---|
| Comparison with Poisson distribution Blue bars denote a histogram of data divided into 1 sec bins. Red curve is a Poisson curve with rate = median count rate of data. |
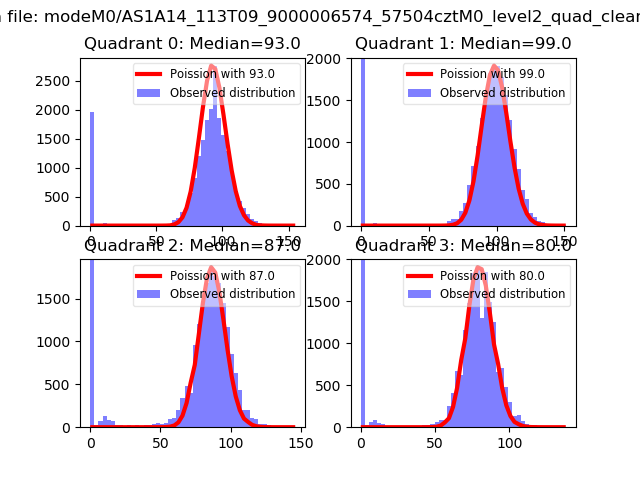 |
 |
| Quadrant-wise count rates Data is divided into 100 sec bins |
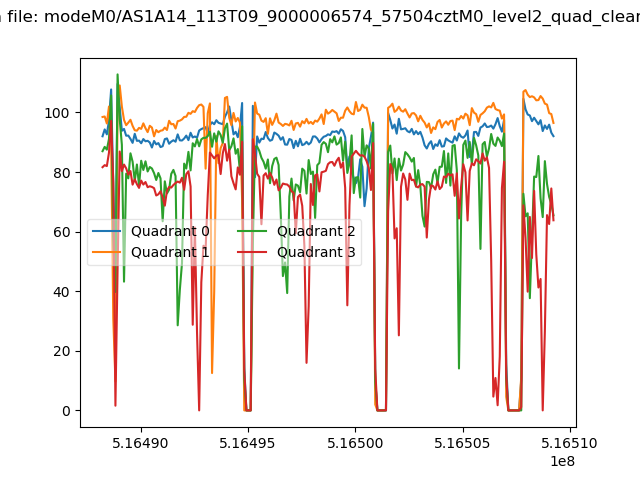 |
|
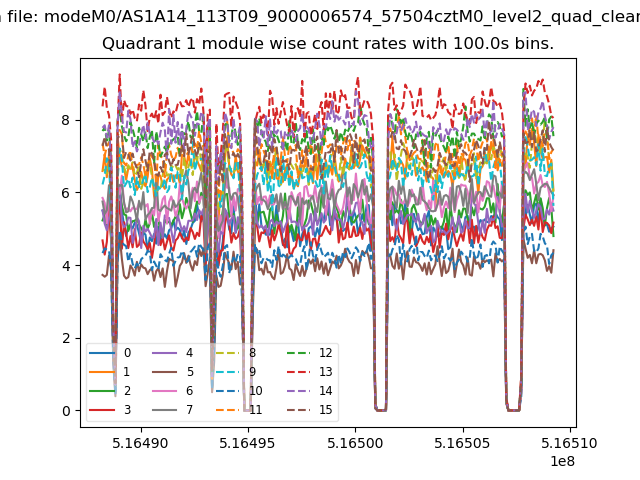
| Module-wise count rates for Quadrant A Data is divided into 100 sec bins |
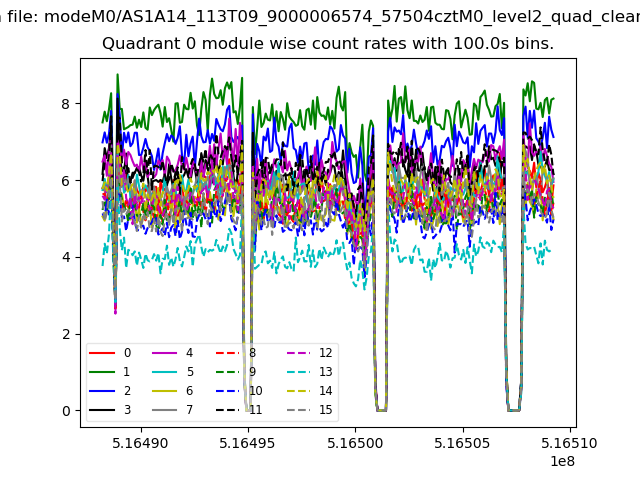 |
 |
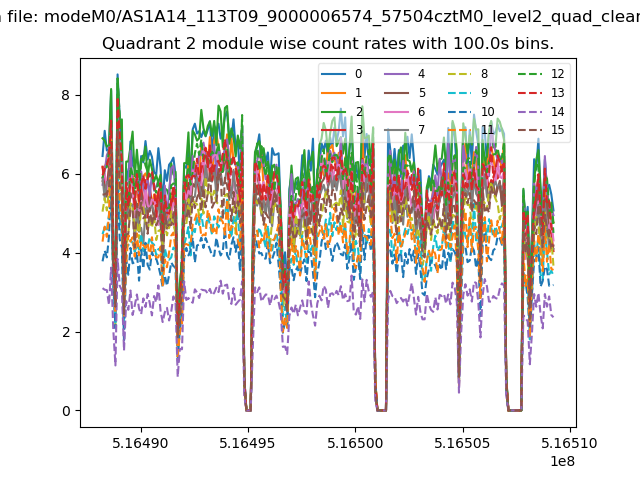
| Module-wise count rates for Quadrant B Data is divided into 100 sec bins |
 |
 |
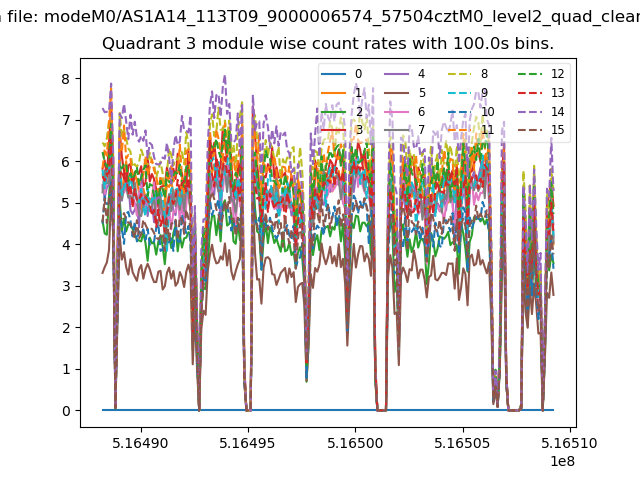
| Module-wise count rates for Quadrant C Data is divided into 100 sec bins |
 |
 |
| Module-wise count rates for Quadrant D Data is divided into 100 sec bins |
 |
 |
| Parameter | Plot |
|---|---|
| CZT HV Monitor | 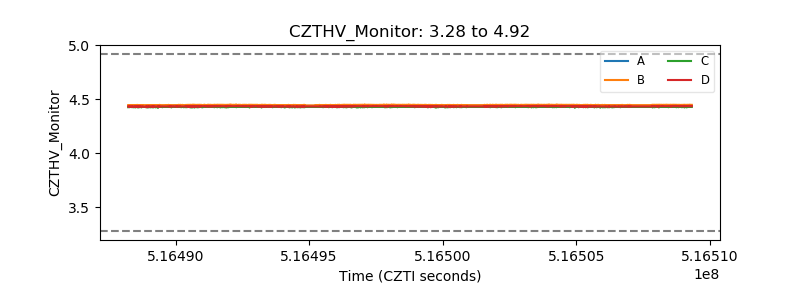 |
| D_VDD | 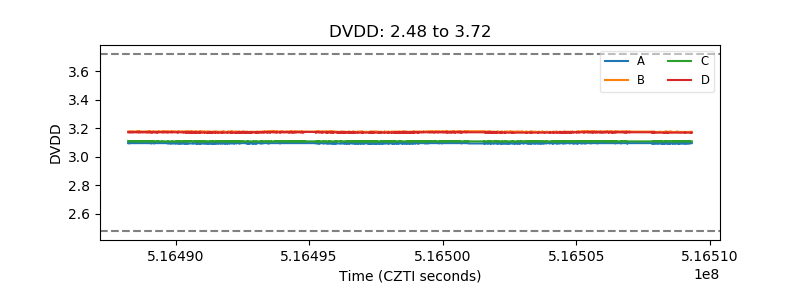 |
| Temperature 1 | 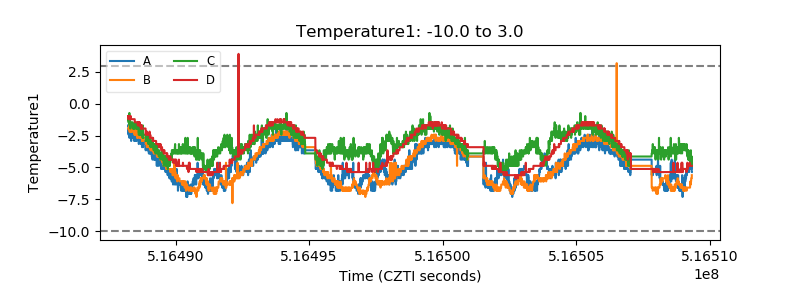 |
| Veto HV Monitor | 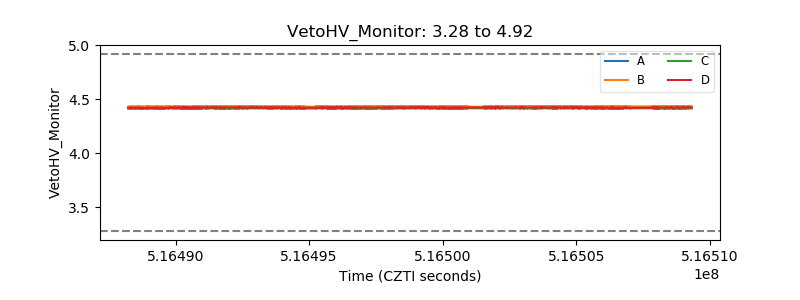 |
| Veto LLD | 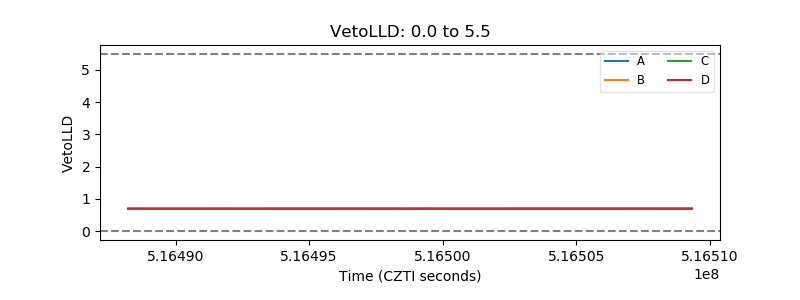 |
| Alpha Counter | 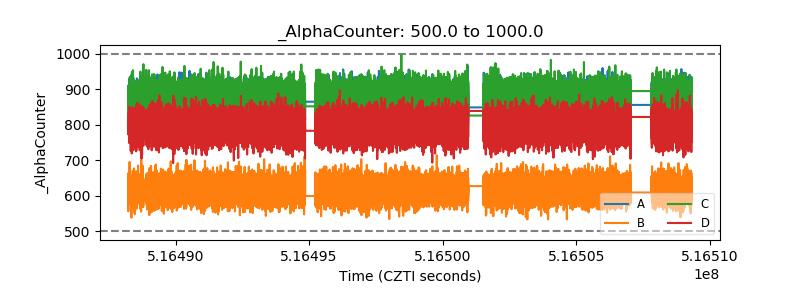 |
| _CPM_Rate | 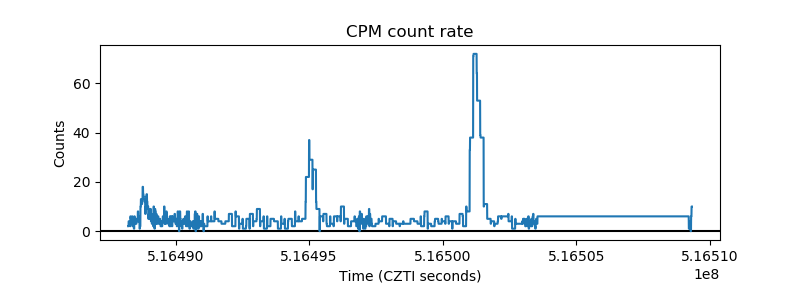 |
| CZT Counter | 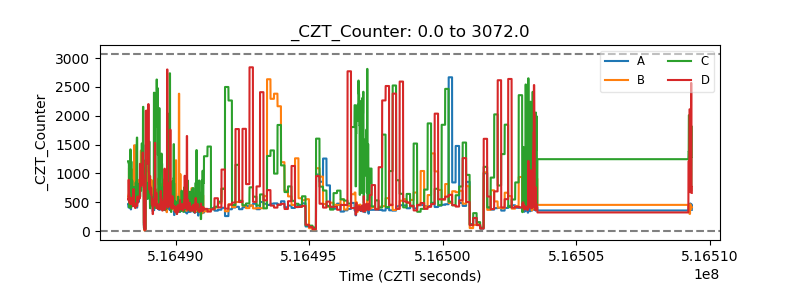 |
| +2.5 Volts monitor | 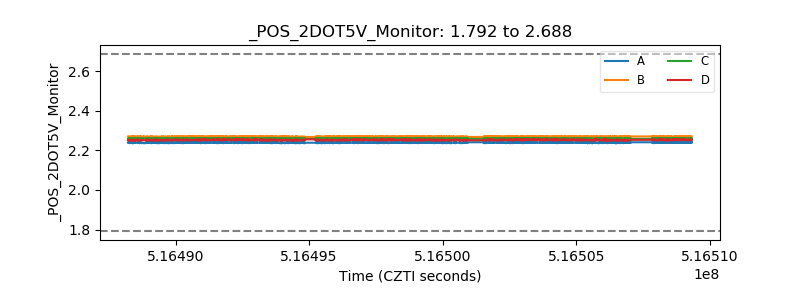 |
| +5 Volts monitor | 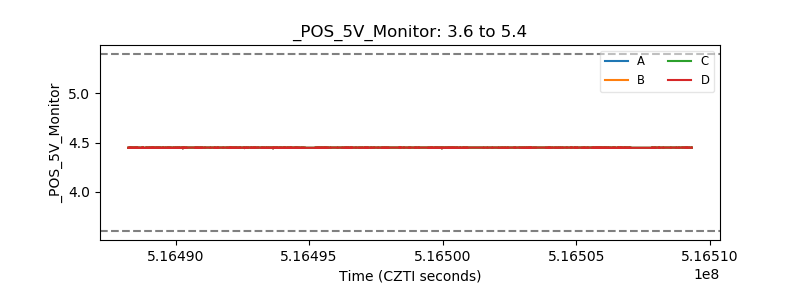 |
| _ROLL_ROT | 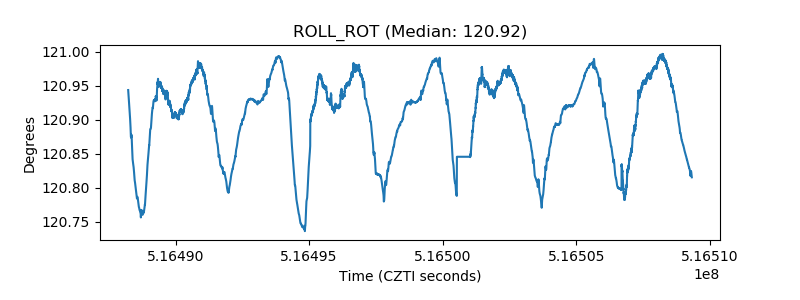 |
| _Roll_DEC | 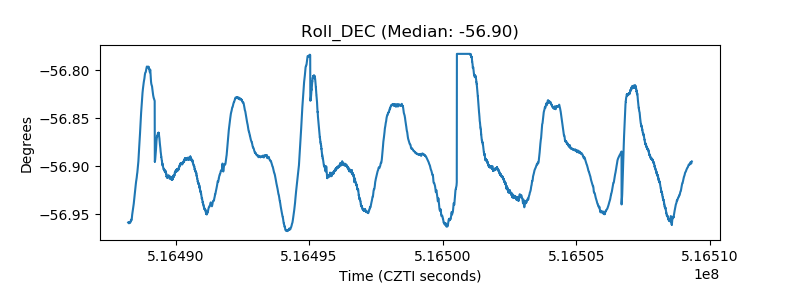 |
| _Roll_RA | 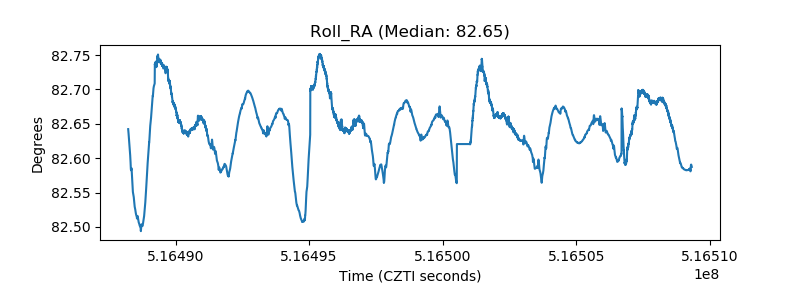 |
| Veto Counter | 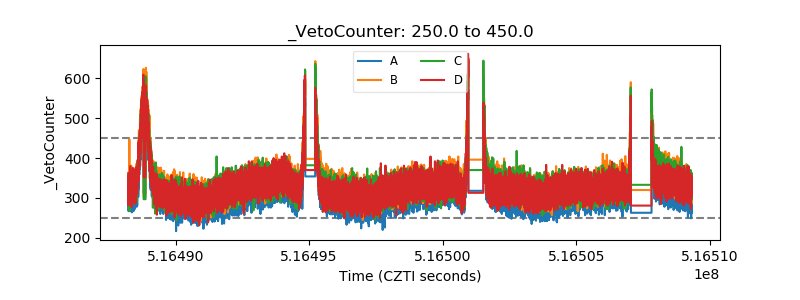 |