| Param | Original file | Final file |
|---|---|---|
| Filename | modeM0/AS1A14_113T09_9000006574_57505cztM0_level2.fits | modeM0/AS1A14_113T09_9000006574_57505cztM0_level2_quad_clean.evt |
| Size (bytes) | 2,522,949,120 | 470,810,880 |
| Size | 2.3 GB | 449.0 MB |
| Events in quadrant A | 16,634,699 | 3,151,869 |
| Events in quadrant B | 19,739,077 | 3,343,501 |
| Events in quadrant C | 28,088,016 | 2,825,957 |
| Events in quadrant D | 26,310,842 | 2,603,836 |
| Mode SS | |||
|---|---|---|---|
| Quadrant | BADHDUFLAG | Total packets | Discarded packets |
| A | 0 | 688 | 0 |
| B | 0 | 688 | 0 |
| C | 0 | 688 | 0 |
| D | 0 | 688 | 0 |
| Mode M9 | |||
|---|---|---|---|
| Quadrant | BADHDUFLAG | Total packets | Discarded packets |
| A | 0 | 25 | 0 |
| B | 0 | 25 | 0 |
| C | 0 | 25 | 0 |
| D | 0 | 25 | 0 |
| Mode M0 | |||
|---|---|---|---|
| Quadrant | BADHDUFLAG | Total packets | Discarded packets |
| A | 0 | 75201 | 5 |
| B | 0 | 81974 | 5 |
| C | 0 | 107252 | 5 |
| D | 0 | 102445 | 5 |
| Quadrant | Total seconds | Saturated seconds | Saturation percentage |
|---|---|---|---|
| A | 33886 | 713 | 2.104114% |
| B | 33887 | 1088 | 3.210671% |
| C | 33887 | 3173 | 9.363473% |
| D | 33887 | 3649 | 10.768141% |
Noise dominated data is calculated using 1-second bins in cleaned event files. If a bin has >2000 counts, and if more than 50% of those come from <1% of pixels, then it is considered to be noise-dominated and hence unusable.
| Quadrant | # 1 sec bins | Bins with >0 counts | Bins with >2000 counts | High rate bins dominated by noise | Noise dominated (total time) | Noise dominated (detector-on time) | Marked lightcurve |
|---|---|---|---|---|---|---|---|
| A | 38409 | 33891 | 426 | 426 | 1.11% | 1.26% | 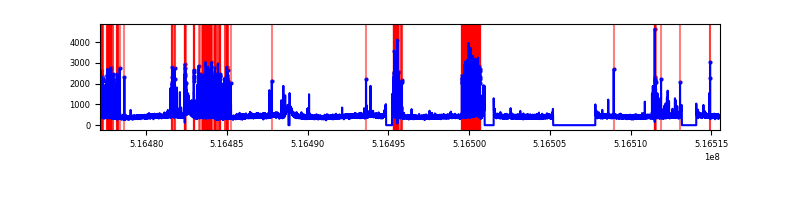 |
| B | 38410 | 33892 | 445 | 445 | 1.16% | 1.31% | 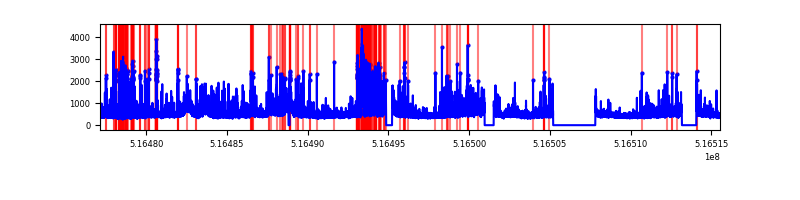 |
| C | 38410 | 33892 | 2544 | 2544 | 6.62% | 7.51% | 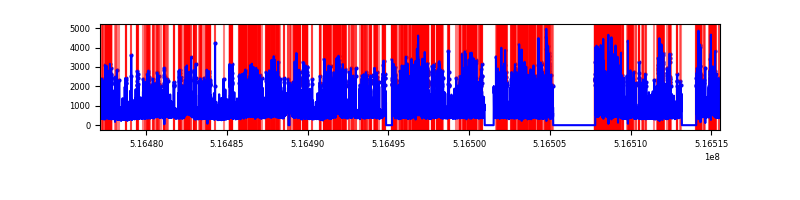 |
| D | 38410 | 33892 | 3151 | 3151 | 8.20% | 9.30% | 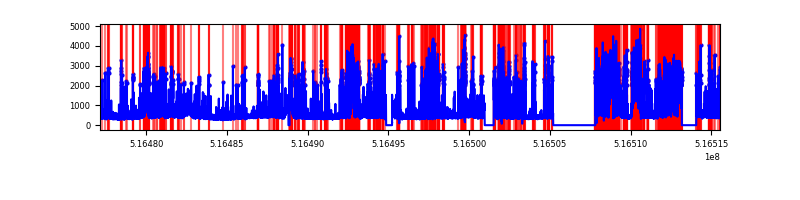 |
Top three noisy pixels from each quadrant. If the there are fewer than three noisy pixels in the level2.evt file, extra rows are filled as -1
| Pixel properties | Quadrant properties | ||||||
|---|---|---|---|---|---|---|---|
| Quadrant | DetID | PixID | Counts | Sigma | Mean | Median | Sigma |
| A | 13 | 248 | 2295094 | 2569.22 | 3645 | 3545 | 891.9 |
| A | 3 | 128 | 108190 | 117.32 | 3645 | 3545 | 891.9 |
| A | 4 | 3 | 49677 | 51.72 | 3645 | 3545 | 891.9 |
| B | 4 | 206 | 3806726 | 4973.05 | 3583 | 3438 | 764.8 |
| B | 2 | 249 | 331863 | 429.44 | 3583 | 3438 | 764.8 |
| B | 10 | 247 | 233450 | 300.76 | 3583 | 3438 | 764.8 |
| C | 15 | 224 | 12618719 | 13604.77 | 3433 | 3398 | 927.3 |
| C | 6 | 223 | 409206 | 437.64 | 3433 | 3398 | 927.3 |
| C | 14 | 254 | 376528 | 402.4 | 3433 | 3398 | 927.3 |
| D | 8 | 240 | 6697474 | 7124.25 | 3369 | 3222 | 939.6 |
| D | 15 | 142 | 2923525 | 3107.89 | 3369 | 3222 | 939.6 |
| D | 2 | 120 | 2152781 | 2287.63 | 3369 | 3222 | 939.6 |
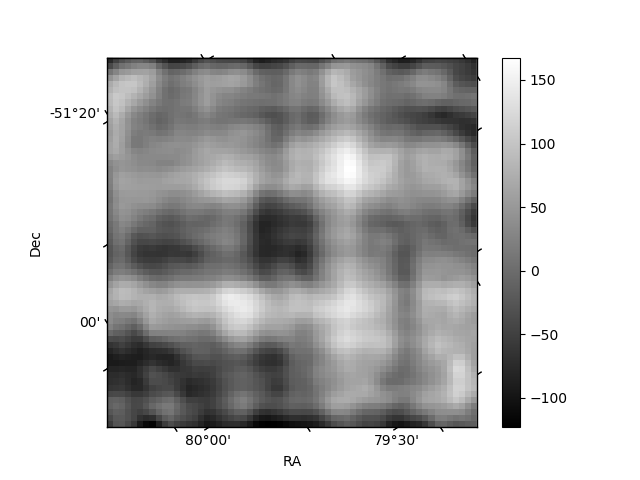
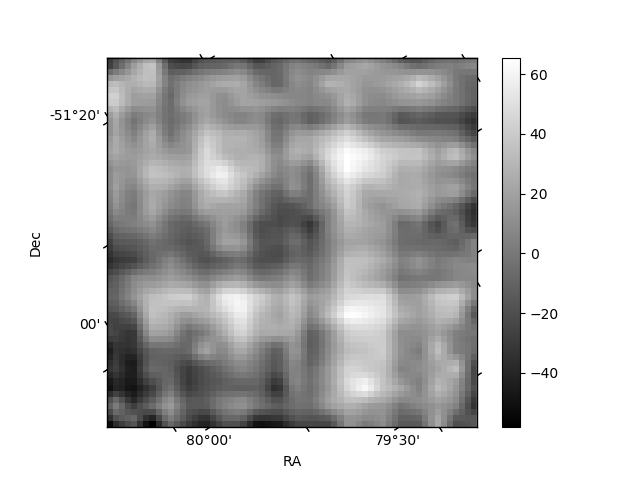
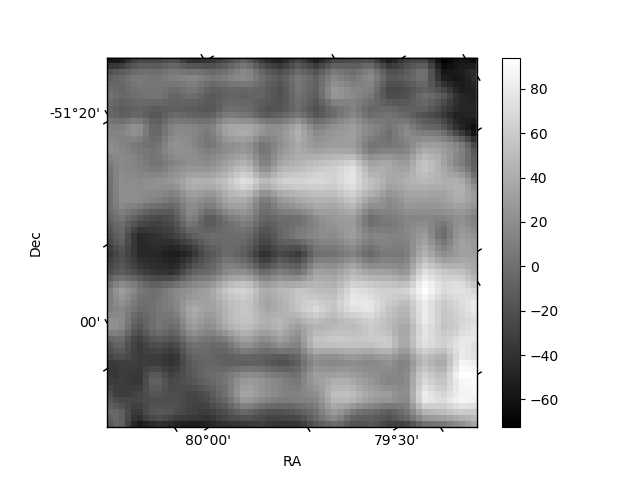
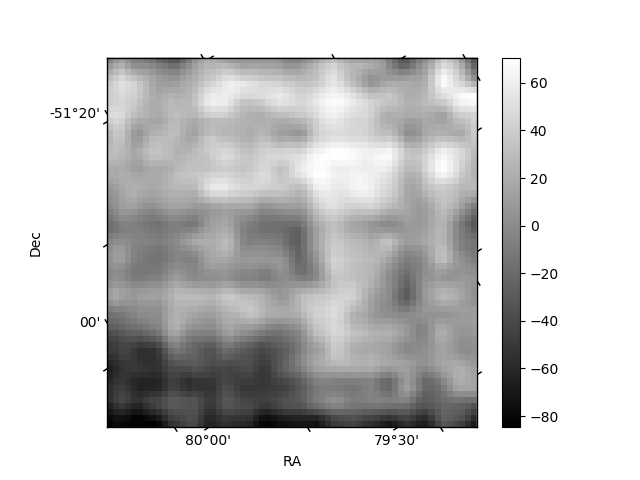
Histogram calculated using DETX and DETY for each event in the final _common_clean file
| Quadrant A | 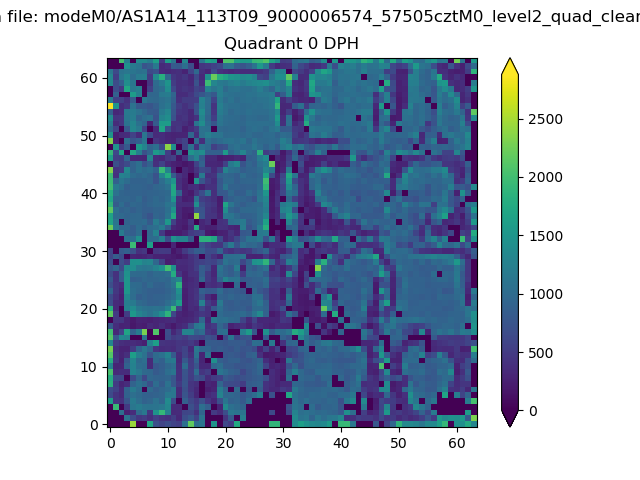 |
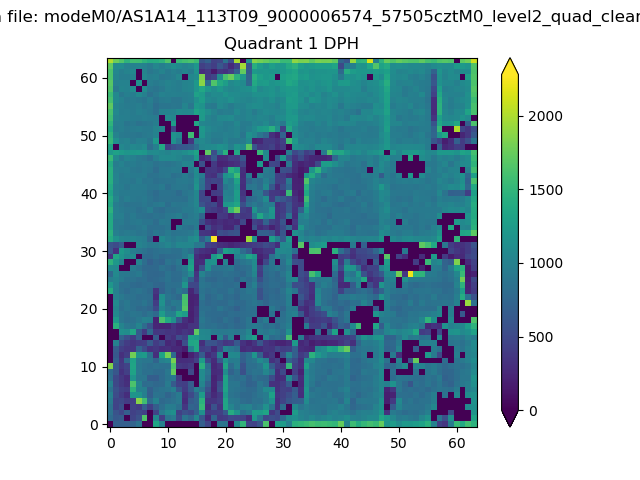 |
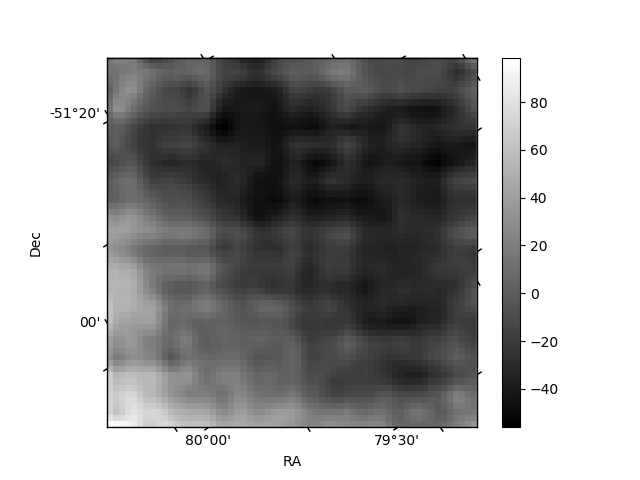
Quadrant B |
|---|---|---|---|
| Quadrant D | 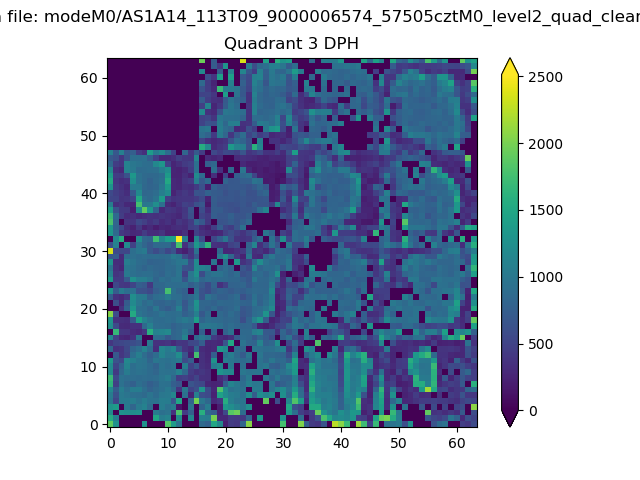 |
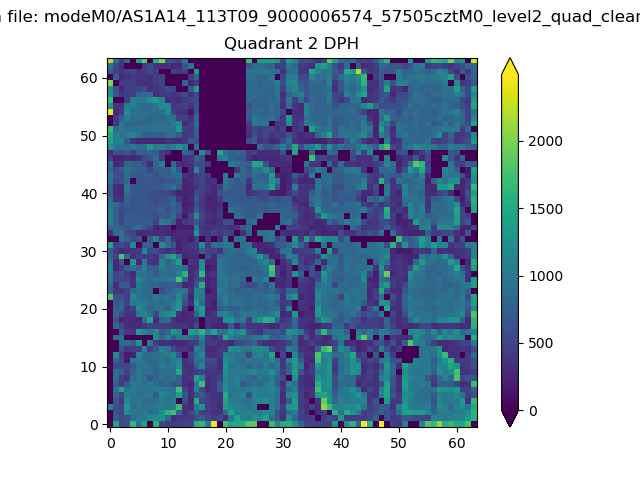 |
Quadrant C |
| Plot type | Count rate plots | Images |
|---|---|---|
| Comparison with Poisson distribution Blue bars denote a histogram of data divided into 1 sec bins. Red curve is a Poisson curve with rate = median count rate of data. |
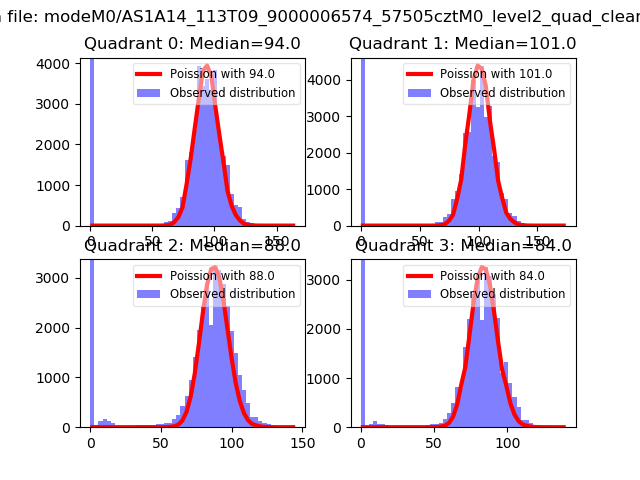 |
 |
| Quadrant-wise count rates Data is divided into 100 sec bins |
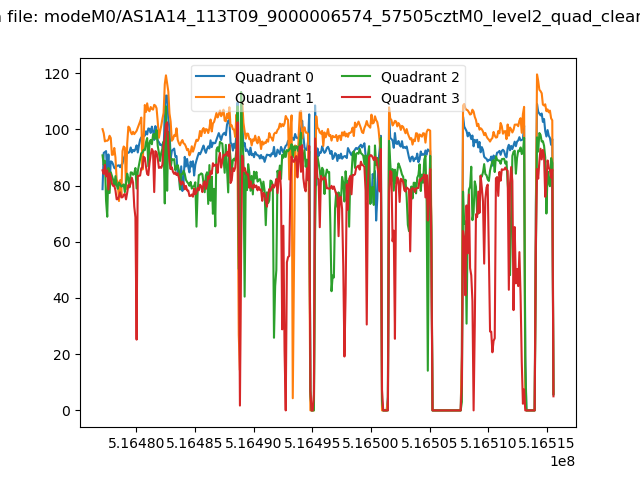 |
|
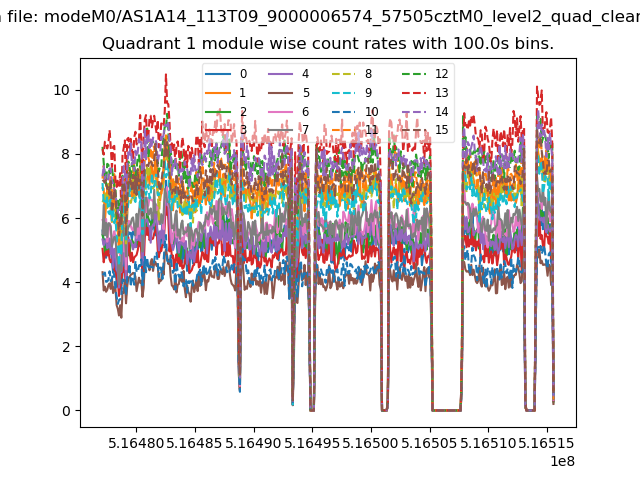
| Module-wise count rates for Quadrant A Data is divided into 100 sec bins |
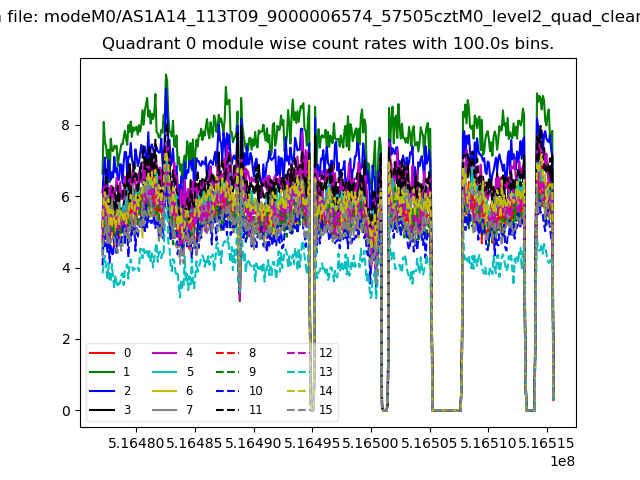 |
 |
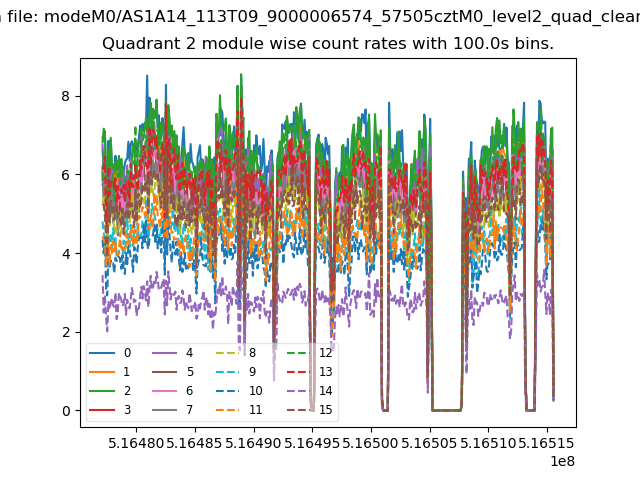
| Module-wise count rates for Quadrant B Data is divided into 100 sec bins |
 |
 |
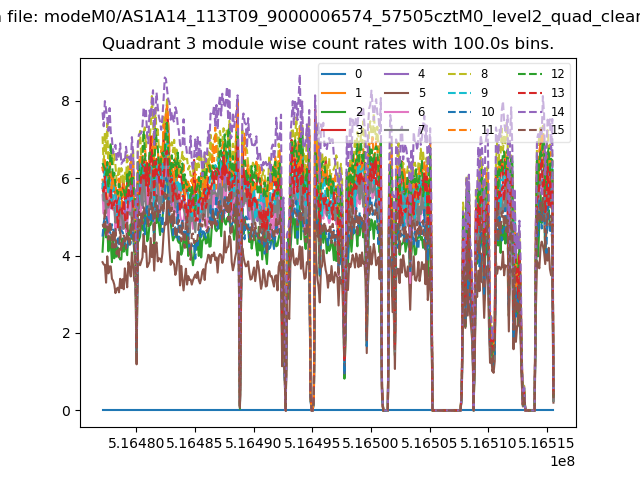
| Module-wise count rates for Quadrant C Data is divided into 100 sec bins |
 |
 |
| Module-wise count rates for Quadrant D Data is divided into 100 sec bins |
 |
 |
| Parameter | Plot |
|---|---|
| CZT HV Monitor | 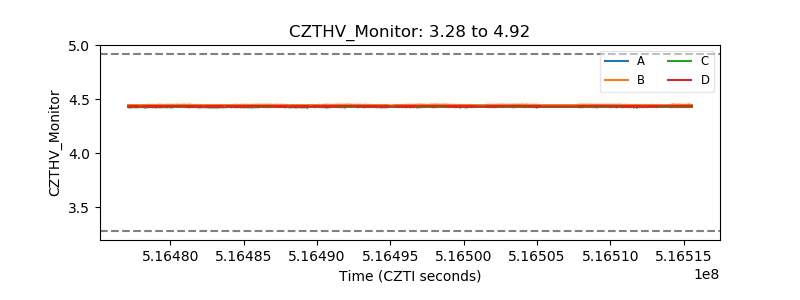 |
| D_VDD | 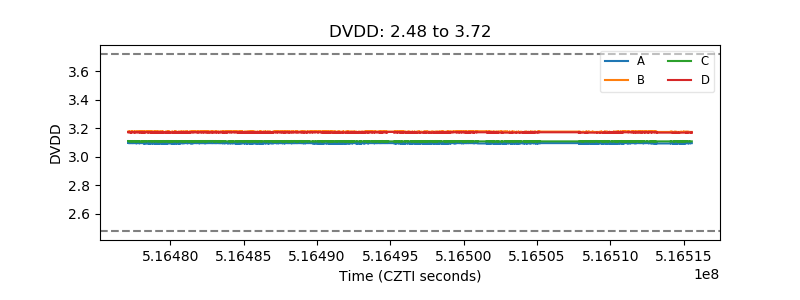 |
| Temperature 1 | 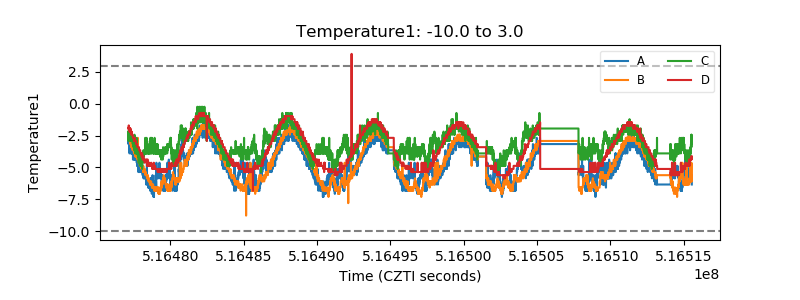 |
| Veto HV Monitor | 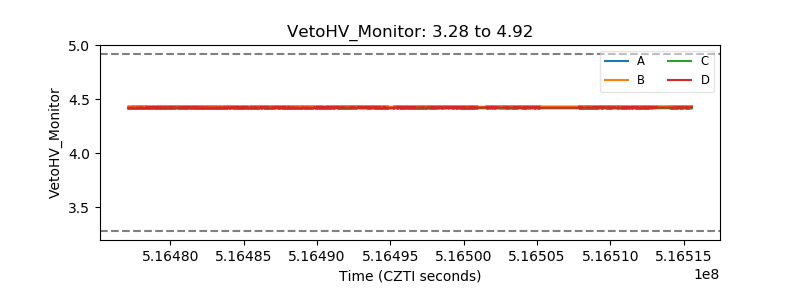 |
| Veto LLD | 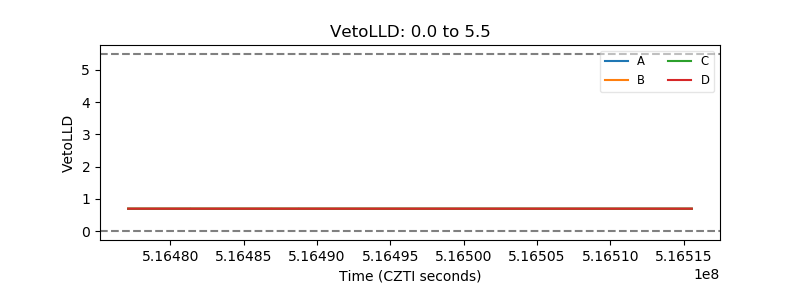 |
| Alpha Counter | 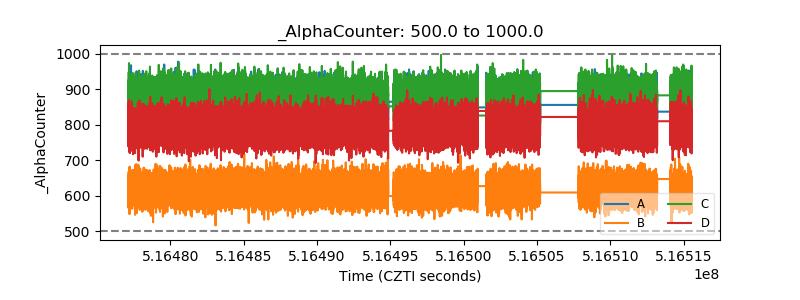 |
| _CPM_Rate | 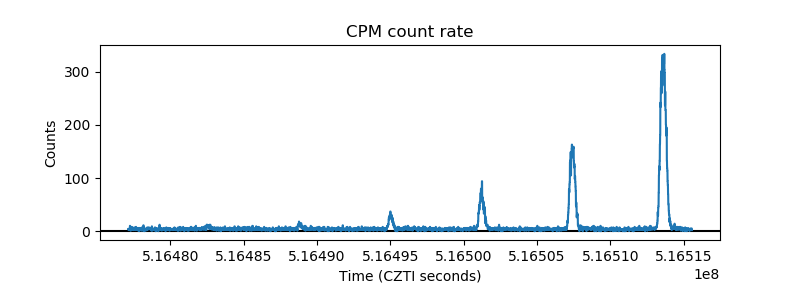 |
| CZT Counter | 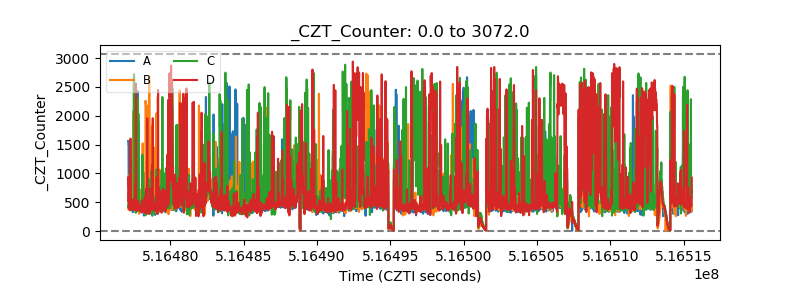 |
| +2.5 Volts monitor | 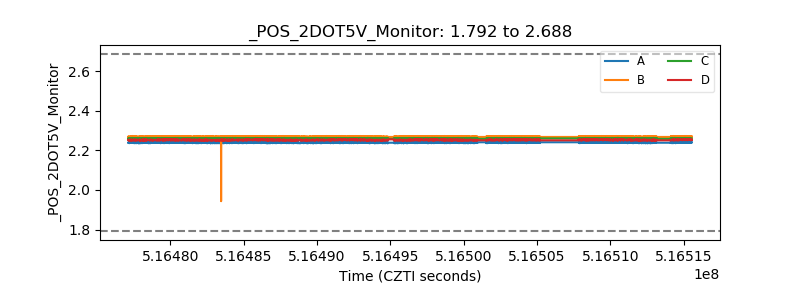 |
| +5 Volts monitor |  |
| _ROLL_ROT | 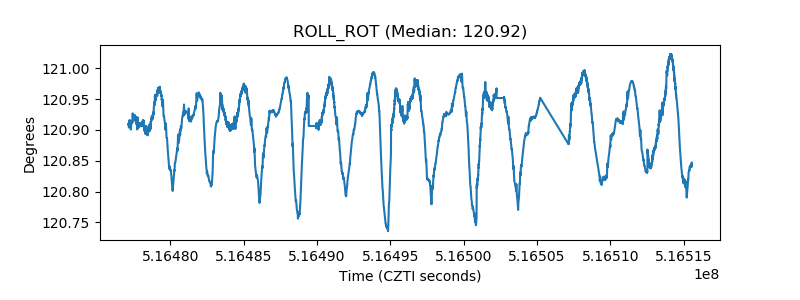 |
| _Roll_DEC | 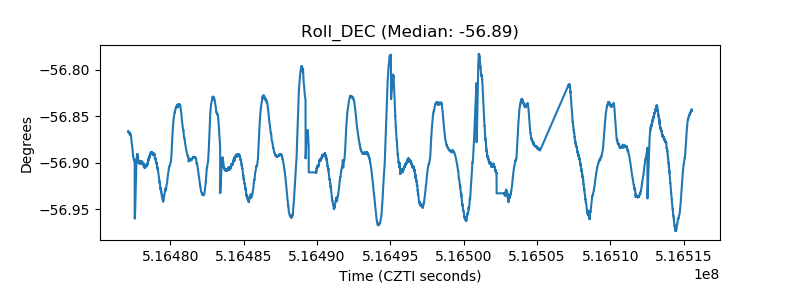 |
| _Roll_RA | 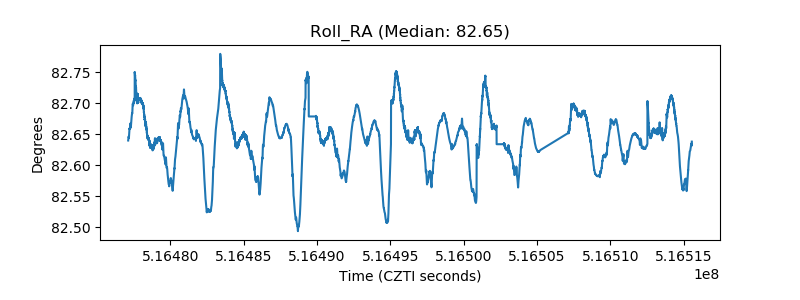 |
| Veto Counter | 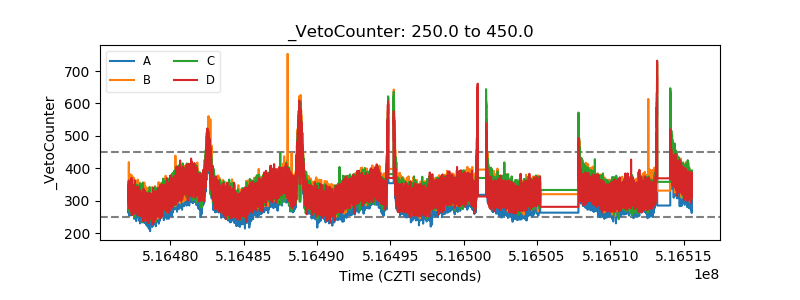 |