| Param | Original file | Final file |
|---|---|---|
| Filename | modeM0/AS1A14_113T09_9000006574_57509cztM0_level2.fits | modeM0/AS1A14_113T09_9000006574_57509cztM0_level2_quad_clean.evt |
| Size (bytes) | 441,774,720 | 102,729,600 |
| Size | 421.3 MB | 98.0 MB |
| Events in quadrant A | 3,594,815 | 672,953 |
| Events in quadrant B | 3,746,830 | 724,309 |
| Events in quadrant C | 4,392,151 | 639,142 |
| Events in quadrant D | 4,099,171 | 608,322 |
| Mode SS | |||
|---|---|---|---|
| Quadrant | BADHDUFLAG | Total packets | Discarded packets |
| A | 0 | 134 | 0 |
| B | 0 | 134 | 0 |
| C | 0 | 134 | 0 |
| D | 0 | 134 | 0 |
| Mode M9 | |||
|---|---|---|---|
| Quadrant | BADHDUFLAG | Total packets | Discarded packets |
| A | 0 | 12 | 0 |
| B | 0 | 12 | 0 |
| C | 0 | 12 | 0 |
| D | 0 | 12 | 0 |
| Mode M0 | |||
|---|---|---|---|
| Quadrant | BADHDUFLAG | Total packets | Discarded packets |
| A | 0 | 15234 | 1 |
| B | 0 | 15362 | 1 |
| C | 0 | 17732 | 1 |
| D | 0 | 16555 | 1 |
| Quadrant | Total seconds | Saturated seconds | Saturation percentage |
|---|---|---|---|
| A | 6689 | 174 | 2.601286% |
| B | 6690 | 125 | 1.868460% |
| C | 6690 | 271 | 4.050822% |
| D | 6690 | 199 | 2.974589% |
Noise dominated data is calculated using 1-second bins in cleaned event files. If a bin has >2000 counts, and if more than 50% of those come from <1% of pixels, then it is considered to be noise-dominated and hence unusable.
| Quadrant | # 1 sec bins | Bins with >0 counts | Bins with >2000 counts | High rate bins dominated by noise | Noise dominated (total time) | Noise dominated (detector-on time) | Marked lightcurve |
|---|---|---|---|---|---|---|---|
| A | 7799 | 6690 | 92 | 92 | 1.18% | 1.38% | 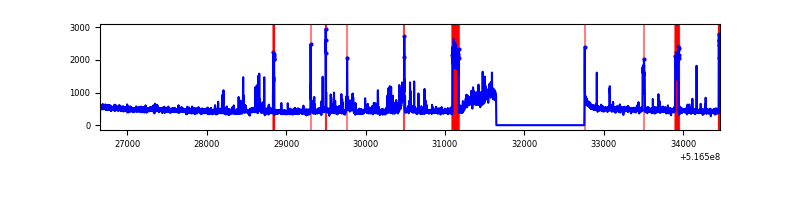 |
| B | 7800 | 6691 | 23 | 23 | 0.29% | 0.34% | 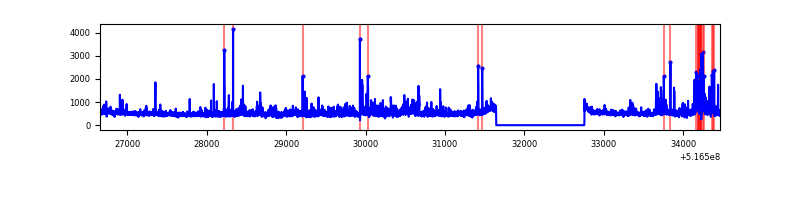 |
| C | 7800 | 6691 | 145 | 145 | 1.86% | 2.17% | 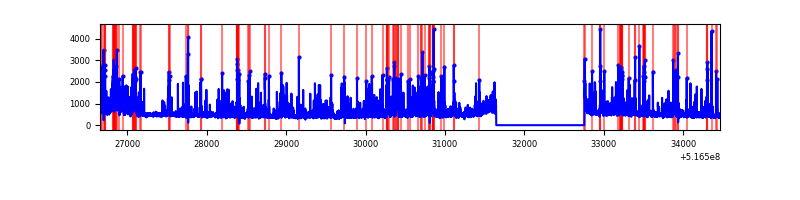 |
| D | 7800 | 6691 | 122 | 122 | 1.56% | 1.82% | 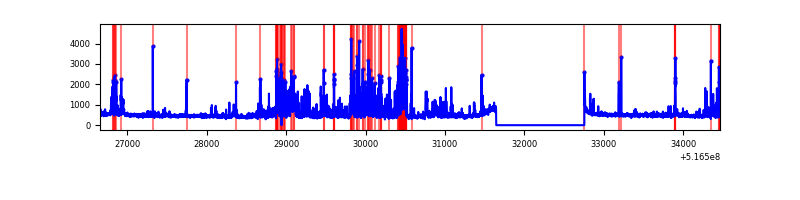 |
Top three noisy pixels from each quadrant. If the there are fewer than three noisy pixels in the level2.evt file, extra rows are filled as -1
| Pixel properties | Quadrant properties | ||||||
|---|---|---|---|---|---|---|---|
| Quadrant | DetID | PixID | Counts | Sigma | Mean | Median | Sigma |
| A | 0 | 12 | 398580 | 2159.66 | 755 | 734 | 184.2 |
| A | 13 | 248 | 118561 | 639.61 | 755 | 734 | 184.2 |
| A | 7 | 64 | 59368 | 318.29 | 755 | 734 | 184.2 |
| B | 4 | 206 | 507749 | 3219.14 | 739 | 713 | 157.5 |
| B | 5 | 185 | 78517 | 493.97 | 739 | 713 | 157.5 |
| B | 10 | 247 | 52106 | 326.29 | 739 | 713 | 157.5 |
| C | 15 | 224 | 1337305 | 6766.46 | 726 | 719 | 197.5 |
| C | 14 | 254 | 66982 | 335.46 | 726 | 719 | 197.5 |
| C | 12 | 252 | 57154 | 285.7 | 726 | 719 | 197.5 |
| D | 2 | 31 | 683813 | 3289.85 | 737 | 703 | 207.6 |
| D | 2 | 120 | 144702 | 693.5 | 737 | 703 | 207.6 |
| D | 8 | 240 | 92027 | 439.82 | 737 | 703 | 207.6 |
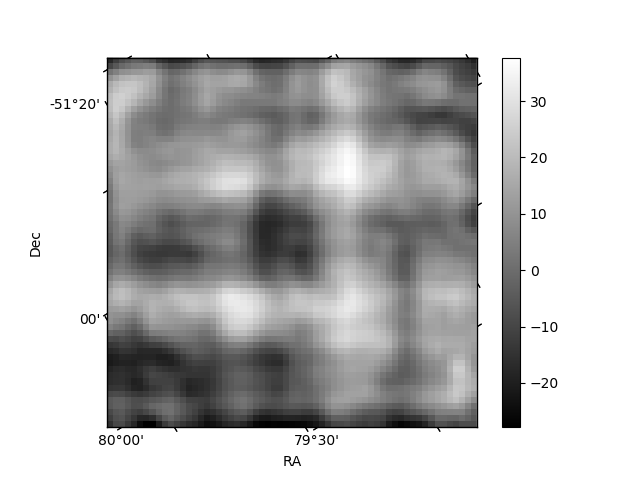
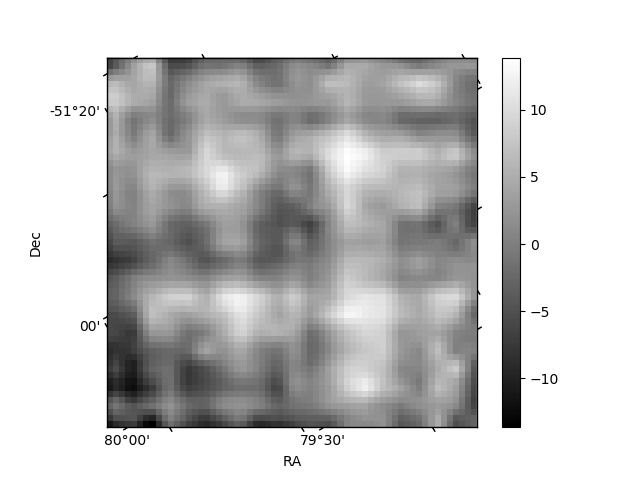
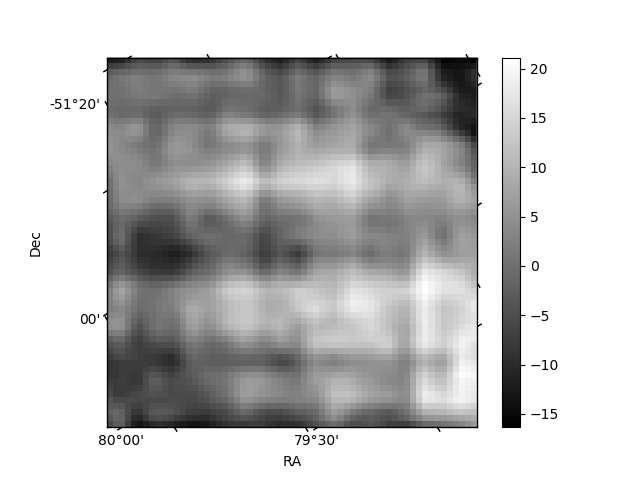
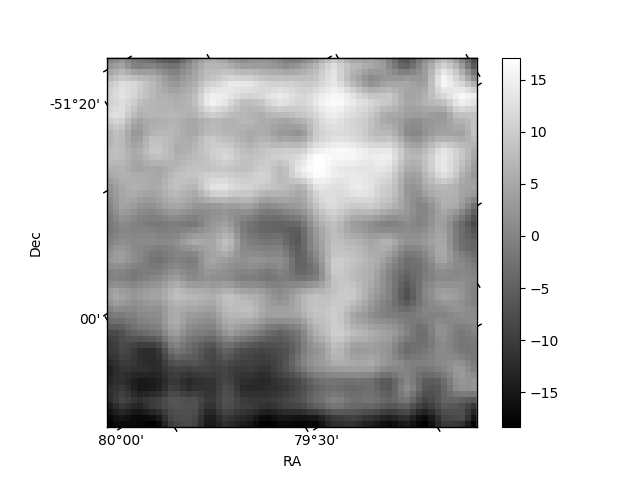
Histogram calculated using DETX and DETY for each event in the final _common_clean file
| Quadrant A | 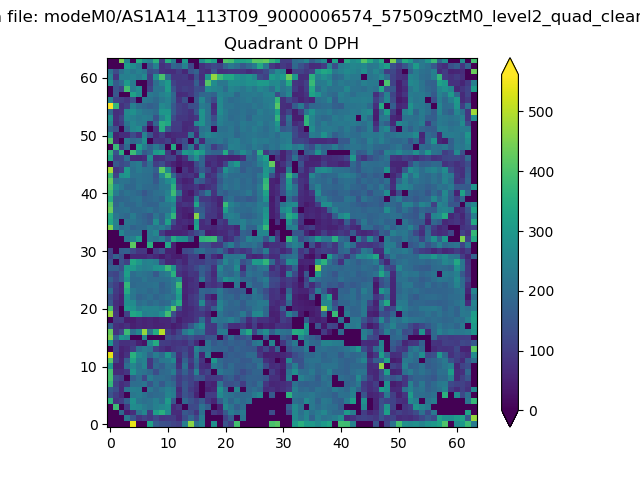 |
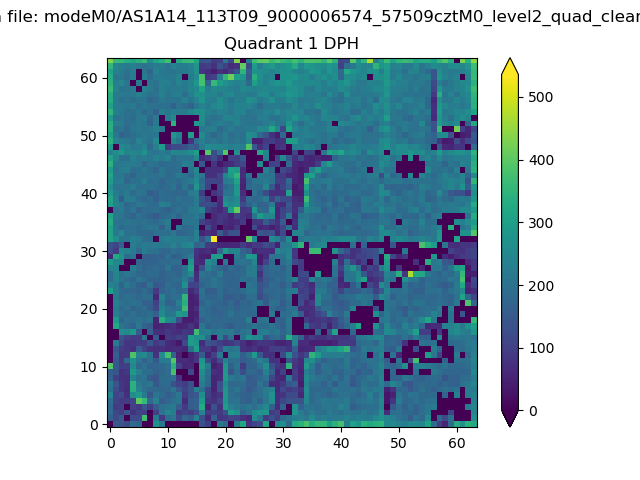 |
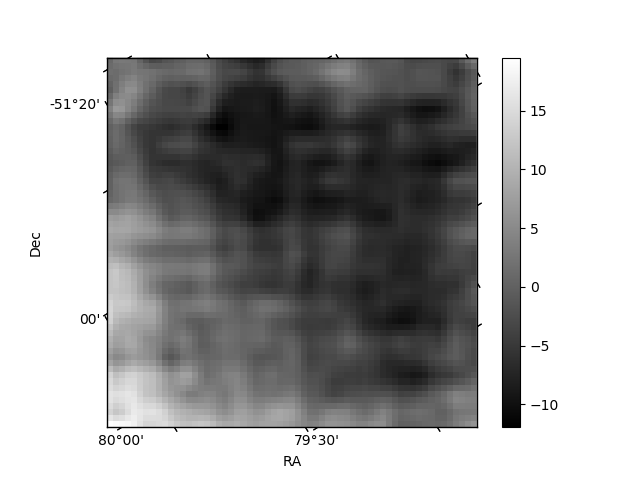
Quadrant B |
|---|---|---|---|
| Quadrant D | 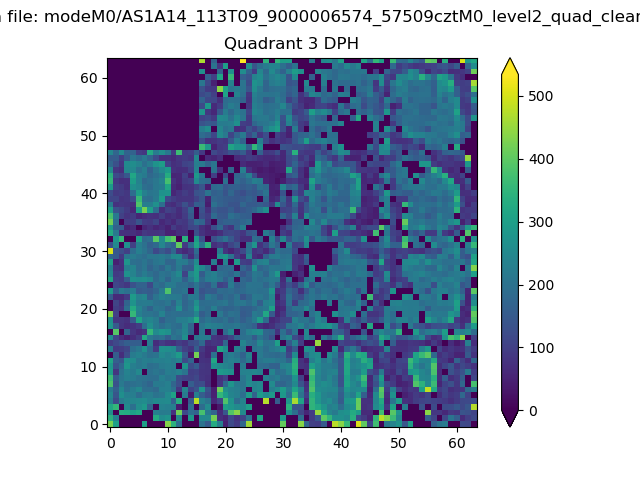 |
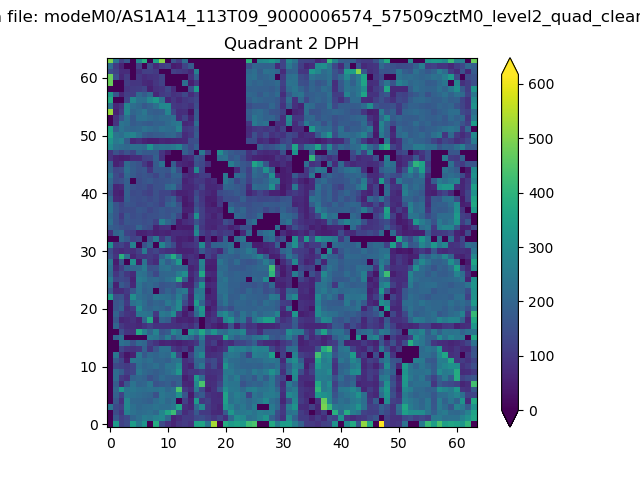 |
Quadrant C |
| Plot type | Count rate plots | Images |
|---|---|---|
| Comparison with Poisson distribution Blue bars denote a histogram of data divided into 1 sec bins. Red curve is a Poisson curve with rate = median count rate of data. |
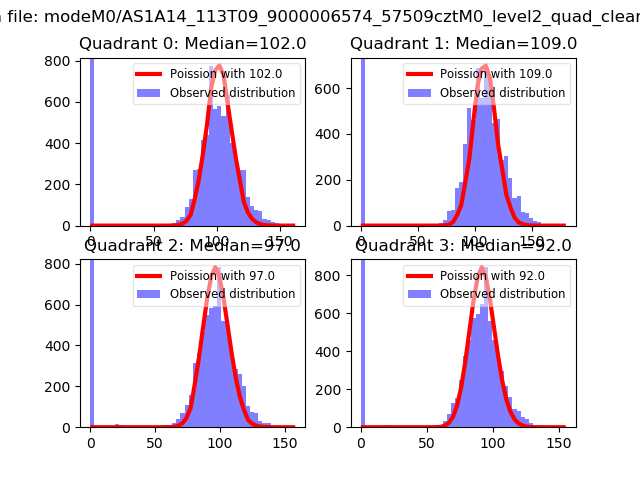 |
 |
| Quadrant-wise count rates Data is divided into 100 sec bins |
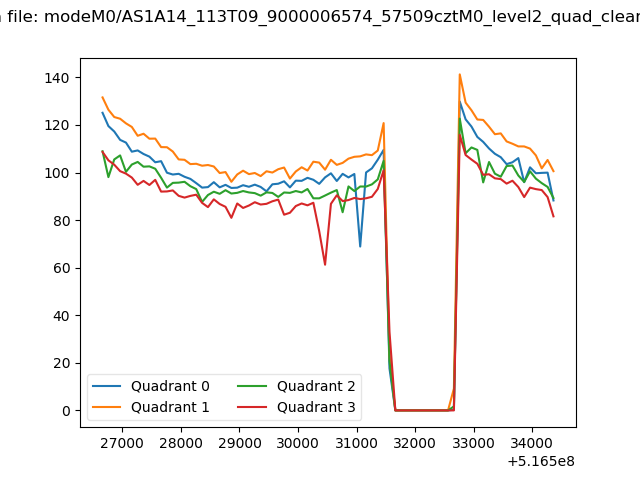 |
|
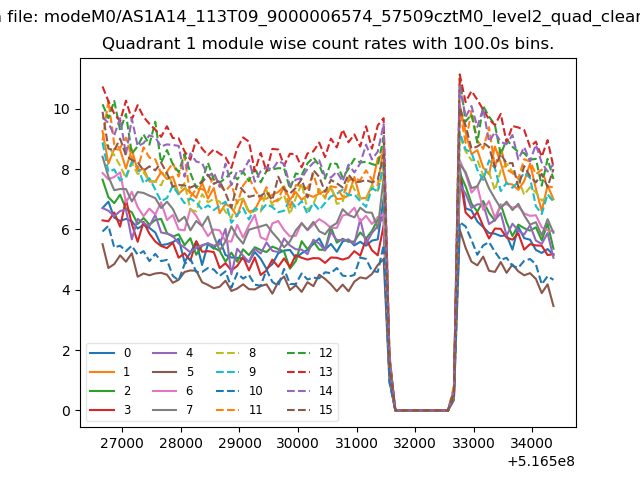
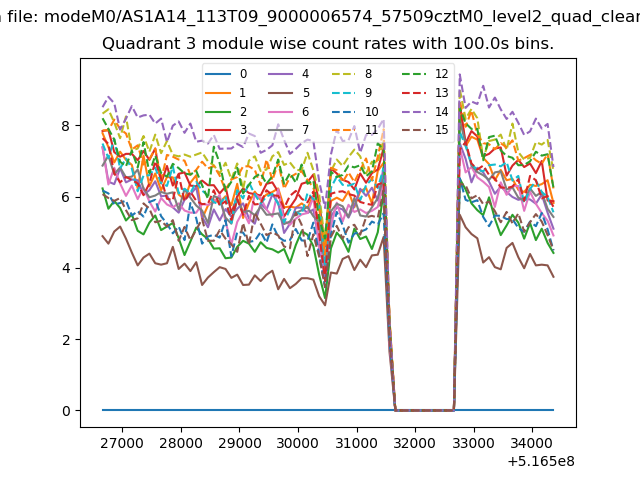
| Module-wise count rates for Quadrant A Data is divided into 100 sec bins |
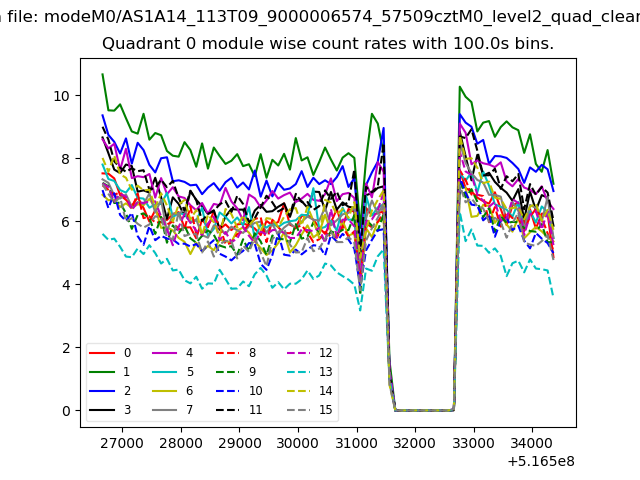 |
 |
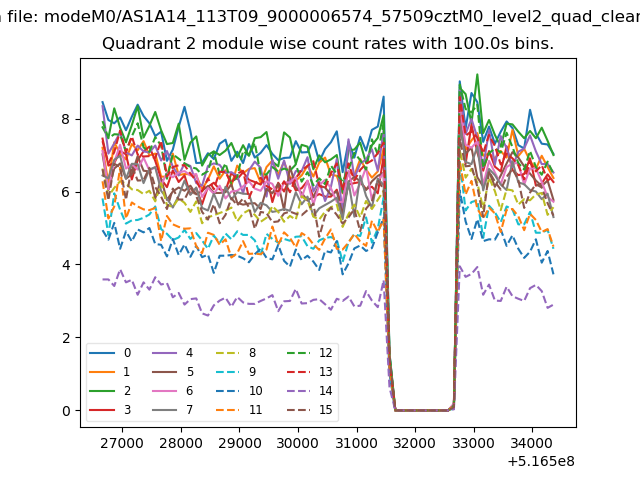
| Module-wise count rates for Quadrant B Data is divided into 100 sec bins |
 |
 |
| Module-wise count rates for Quadrant C Data is divided into 100 sec bins |
 |
 |
| Module-wise count rates for Quadrant D Data is divided into 100 sec bins |
 |
 |
| Parameter | Plot |
|---|---|
| CZT HV Monitor | 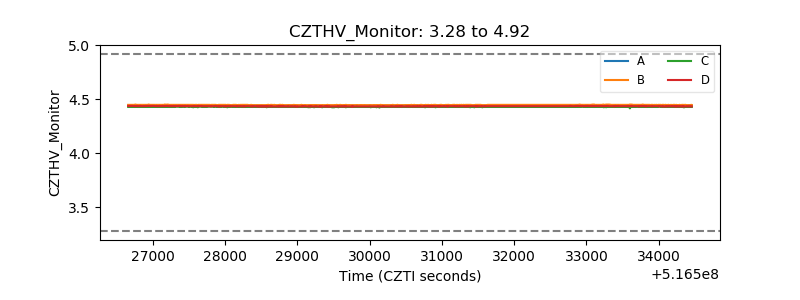 |
| D_VDD | 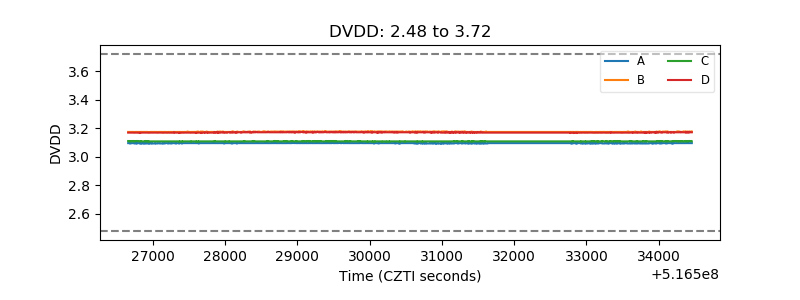 |
| Temperature 1 | 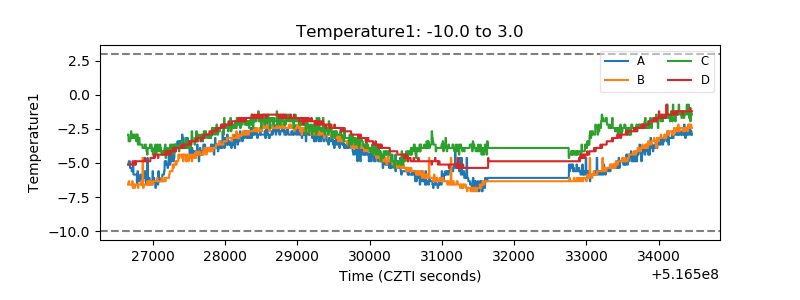 |
| Veto HV Monitor | 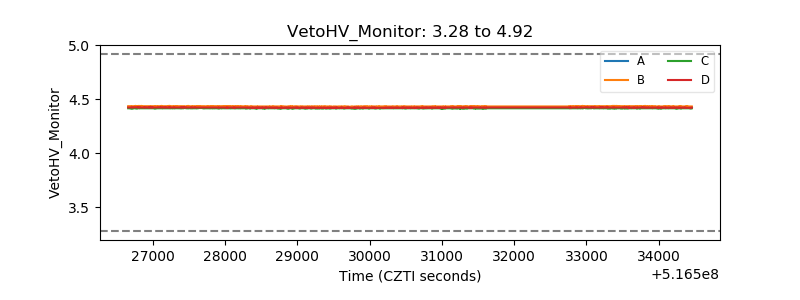 |
| Veto LLD | 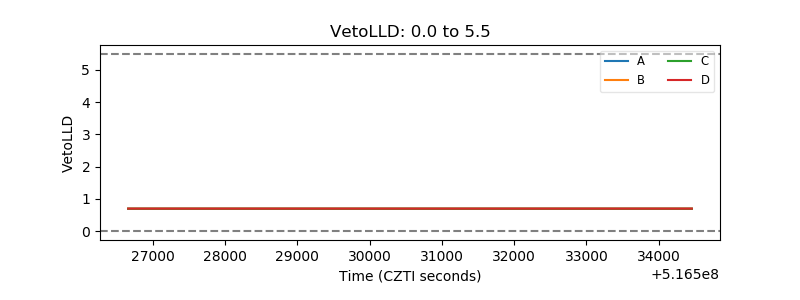 |
| Alpha Counter | 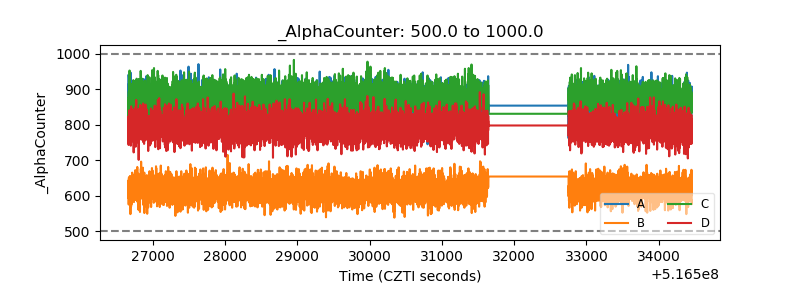 |
| _CPM_Rate | 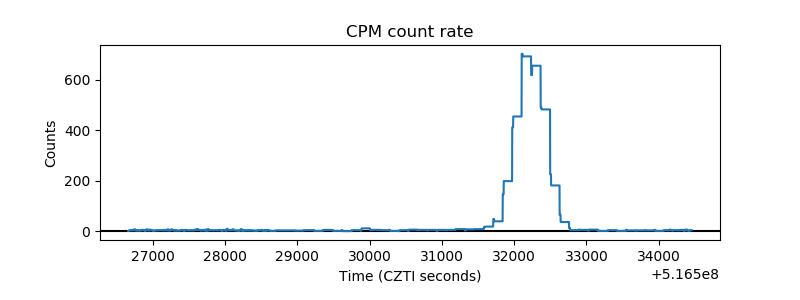 |
| CZT Counter | 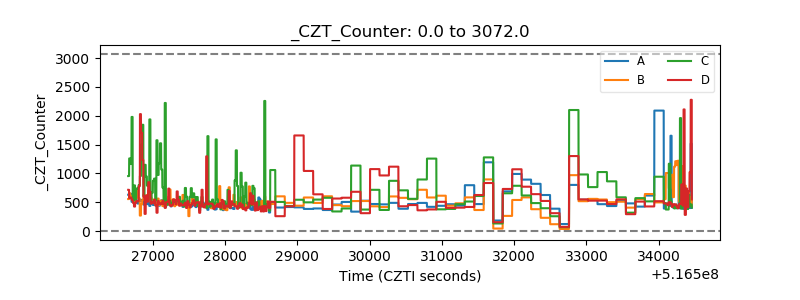 |
| +2.5 Volts monitor |  |
| +5 Volts monitor |  |
| _ROLL_ROT | 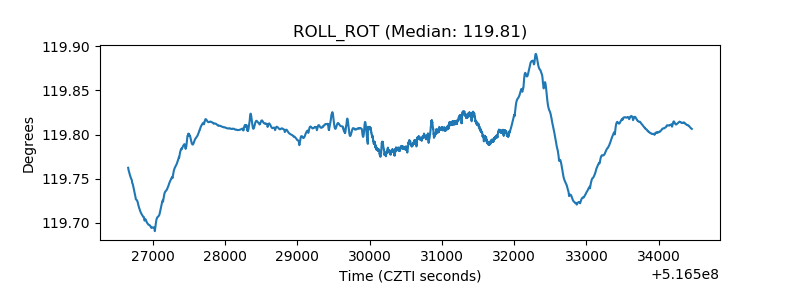 |
| _Roll_DEC | 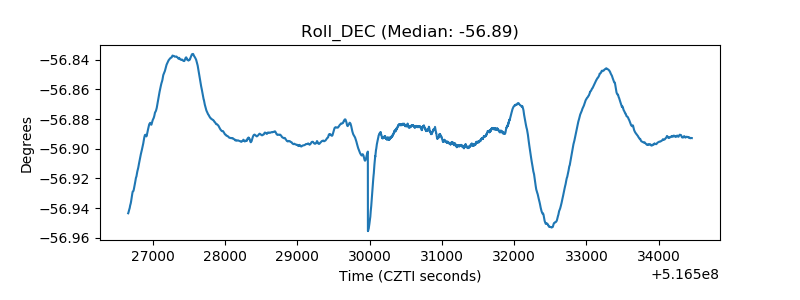 |
| _Roll_RA | 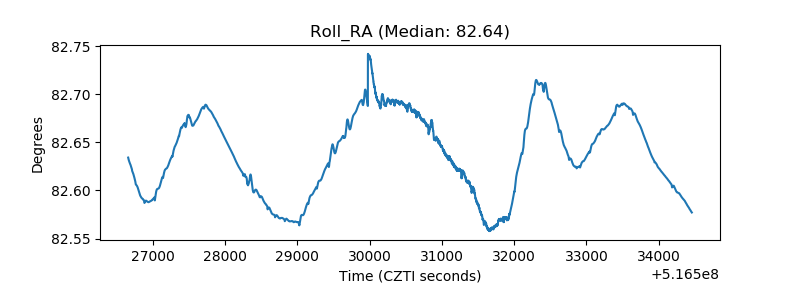 |
| Veto Counter | 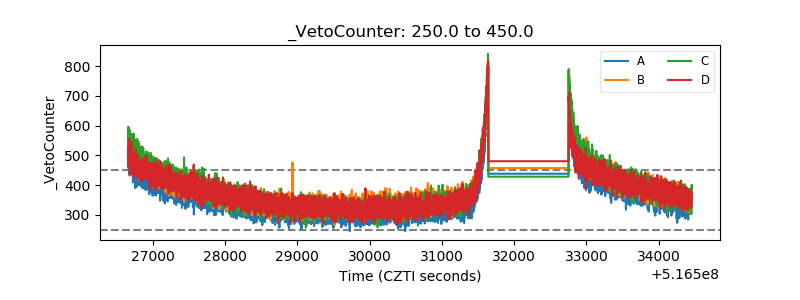 |