| Param | Original file | Final file |
|---|---|---|
| Filename | modeM0/AS1A14_113T09_9000006574_57513cztM0_level2.fits | modeM0/AS1A14_113T09_9000006574_57513cztM0_level2_quad_clean.evt |
| Size (bytes) | 569,672,640 | 100,105,920 |
| Size | 543.3 MB | 95.5 MB |
| Events in quadrant A | 3,290,934 | 684,818 |
| Events in quadrant B | 4,689,333 | 707,964 |
| Events in quadrant C | 6,677,919 | 593,639 |
| Events in quadrant D | 5,865,943 | 540,511 |
| Mode SS | |||
|---|---|---|---|
| Quadrant | BADHDUFLAG | Total packets | Discarded packets |
| A | 0 | 146 | 0 |
| B | 0 | 146 | 0 |
| C | 0 | 146 | 0 |
| D | 0 | 146 | 0 |
| Mode M9 | |||
|---|---|---|---|
| Quadrant | BADHDUFLAG | Total packets | Discarded packets |
| A | 0 | 3 | 0 |
| B | 0 | 3 | 0 |
| C | 0 | 3 | 0 |
| D | 0 | 3 | 0 |
| Mode M0 | |||
|---|---|---|---|
| Quadrant | BADHDUFLAG | Total packets | Discarded packets |
| A | 0 | 15229 | 1 |
| B | 0 | 18778 | 1 |
| C | 0 | 24987 | 1 |
| D | 0 | 22402 | 1 |
| Quadrant | Total seconds | Saturated seconds | Saturation percentage |
|---|---|---|---|
| A | 7250 | 128 | 1.765517% |
| B | 7250 | 394 | 5.434483% |
| C | 7250 | 884 | 12.193103% |
| D | 7249 | 1051 | 14.498552% |
Noise dominated data is calculated using 1-second bins in cleaned event files. If a bin has >2000 counts, and if more than 50% of those come from <1% of pixels, then it is considered to be noise-dominated and hence unusable.
| Quadrant | # 1 sec bins | Bins with >0 counts | Bins with >2000 counts | High rate bins dominated by noise | Noise dominated (total time) | Noise dominated (detector-on time) | Marked lightcurve |
|---|---|---|---|---|---|---|---|
| A | 7470 | 7253 | 7 | 7 | 0.09% | 0.10% | 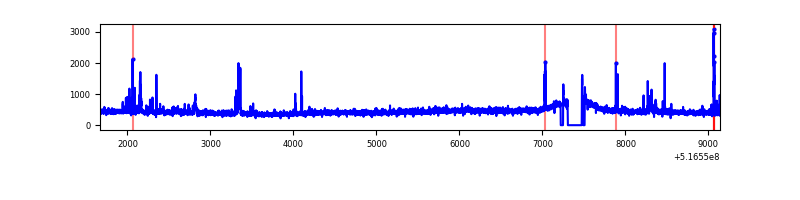 |
| B | 7470 | 7253 | 121 | 121 | 1.62% | 1.67% | 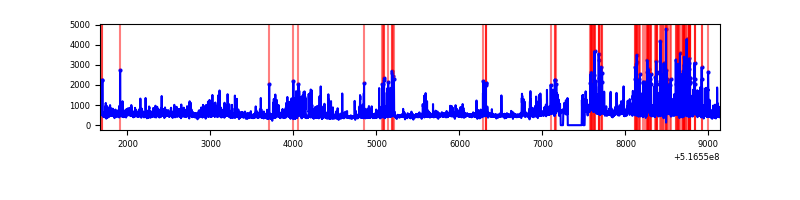 |
| C | 7470 | 7253 | 718 | 718 | 9.61% | 9.90% | 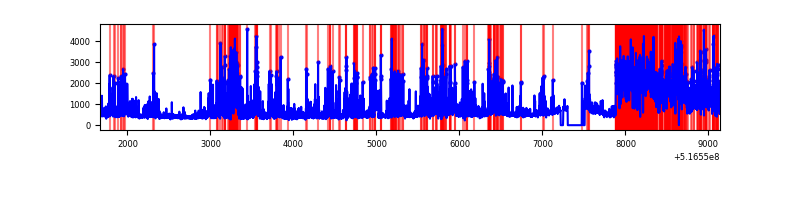 |
| D | 7469 | 7252 | 869 | 869 | 11.63% | 11.98% | 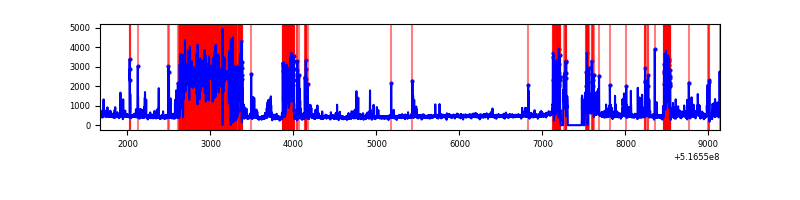 |
Top three noisy pixels from each quadrant. If the there are fewer than three noisy pixels in the level2.evt file, extra rows are filled as -1
| Pixel properties | Quadrant properties | ||||||
|---|---|---|---|---|---|---|---|
| Quadrant | DetID | PixID | Counts | Sigma | Mean | Median | Sigma |
| A | 13 | 248 | 67028 | 342.85 | 790 | 770 | 193.3 |
| A | 3 | 14 | 58992 | 301.27 | 790 | 770 | 193.3 |
| A | 7 | 14 | 34393 | 173.98 | 790 | 770 | 193.3 |
| B | 4 | 206 | 1018233 | 6197.88 | 765 | 734 | 164.2 |
| B | 2 | 249 | 207739 | 1260.93 | 765 | 734 | 164.2 |
| B | 5 | 185 | 110720 | 669.96 | 765 | 734 | 164.2 |
| C | 15 | 224 | 1875742 | 9498.53 | 728 | 721 | 197.4 |
| C | 9 | 38 | 1556187 | 7879.72 | 728 | 721 | 197.4 |
| C | 14 | 254 | 166530 | 839.96 | 728 | 721 | 197.4 |
| D | 8 | 240 | 2336928 | 11858.06 | 699 | 665 | 197.0 |
| D | 12 | 128 | 423365 | 2145.48 | 699 | 665 | 197.0 |
| D | 3 | 12 | 75005 | 377.32 | 699 | 665 | 197.0 |
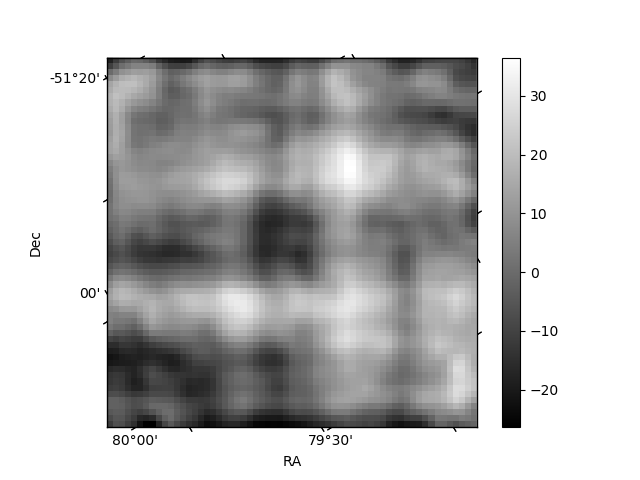
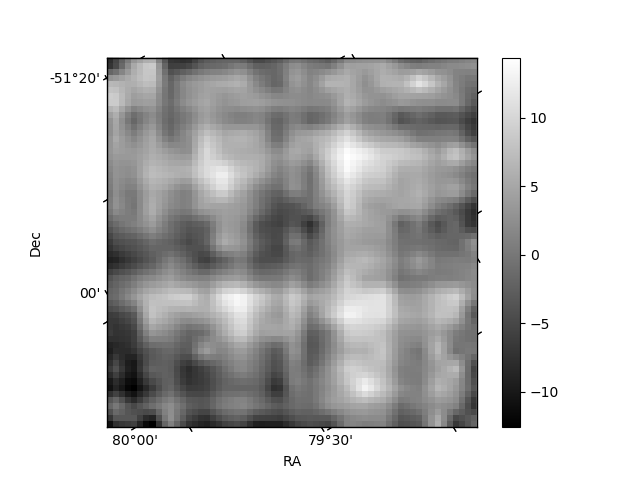
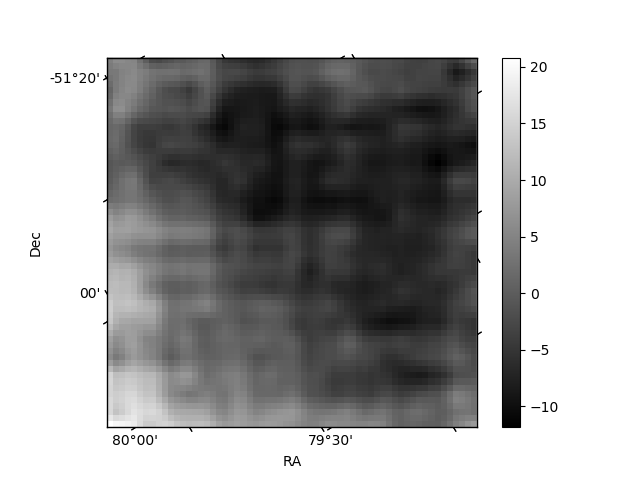
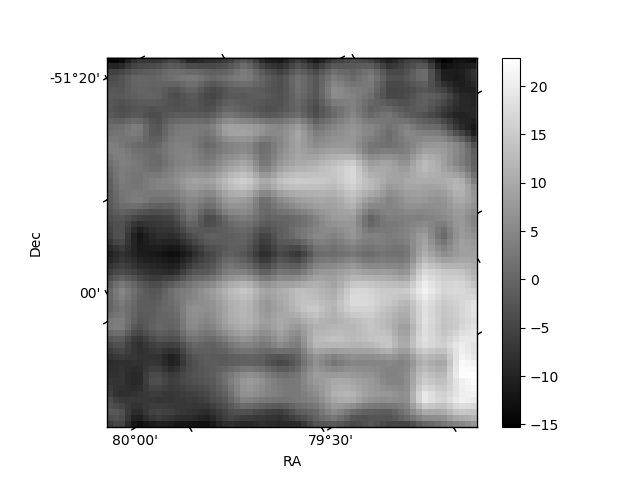
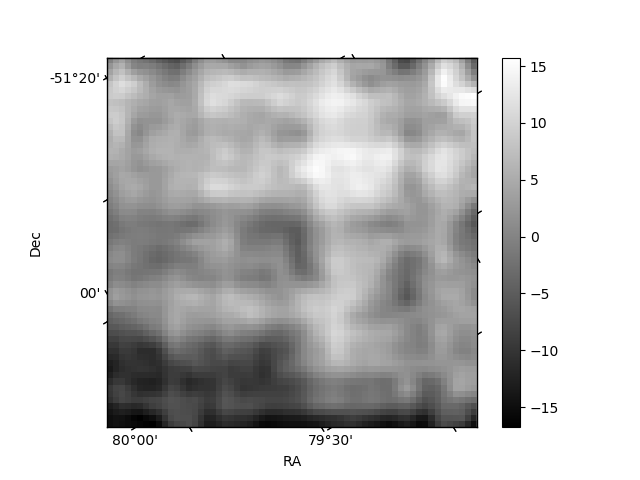
Histogram calculated using DETX and DETY for each event in the final _common_clean file
| Quadrant A | 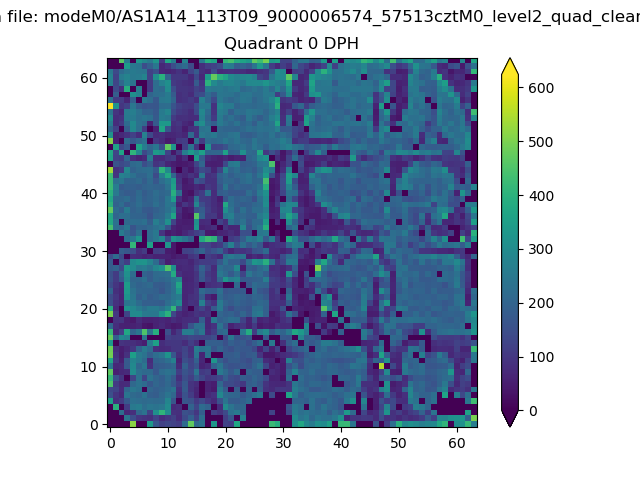 |
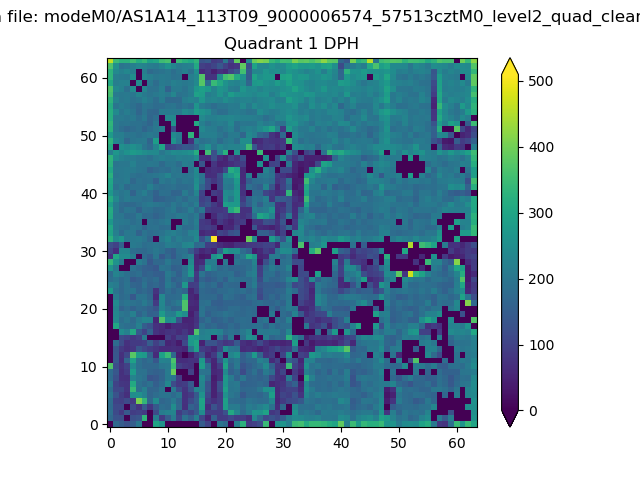 |
Quadrant B |
|---|---|---|---|
| Quadrant D | 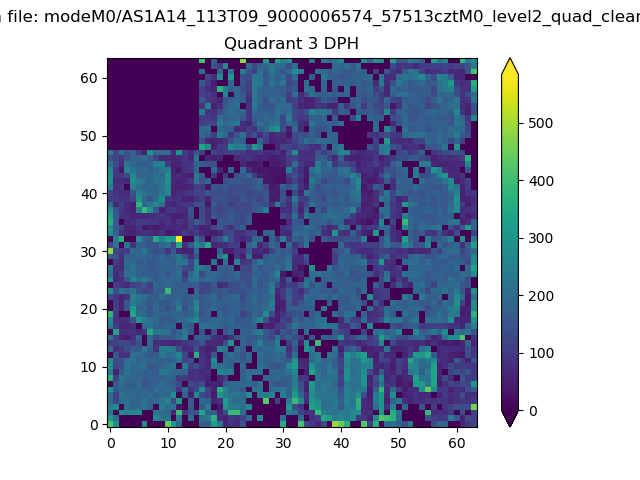 |
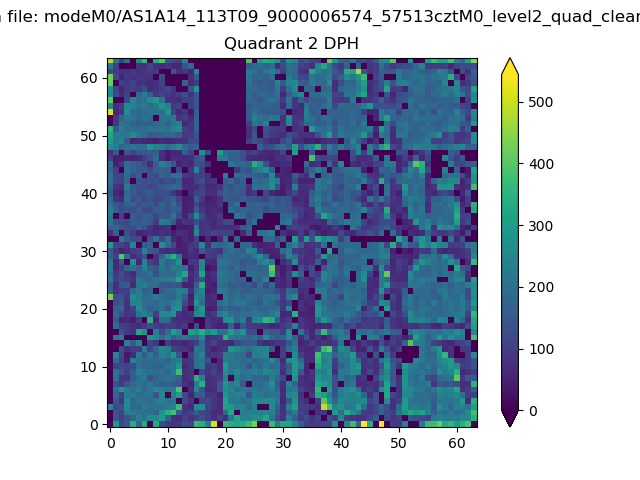 |
Quadrant C |
| Plot type | Count rate plots | Images |
|---|---|---|
| Comparison with Poisson distribution Blue bars denote a histogram of data divided into 1 sec bins. Red curve is a Poisson curve with rate = median count rate of data. |
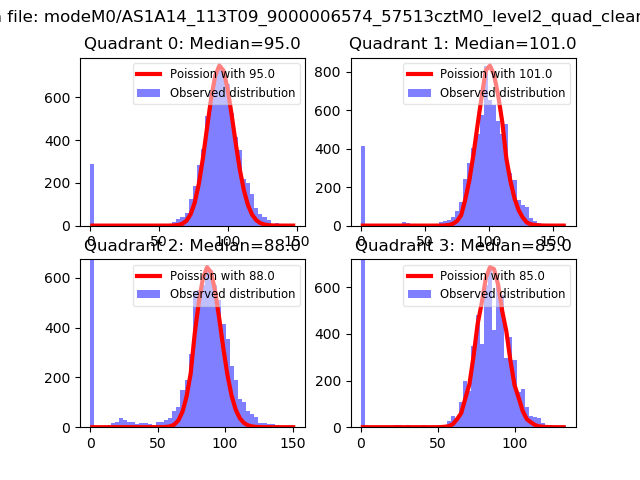 |
 |
| Quadrant-wise count rates Data is divided into 100 sec bins |
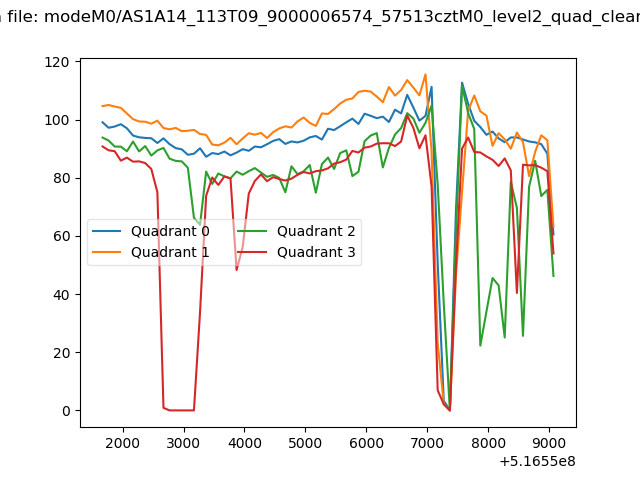 |
|
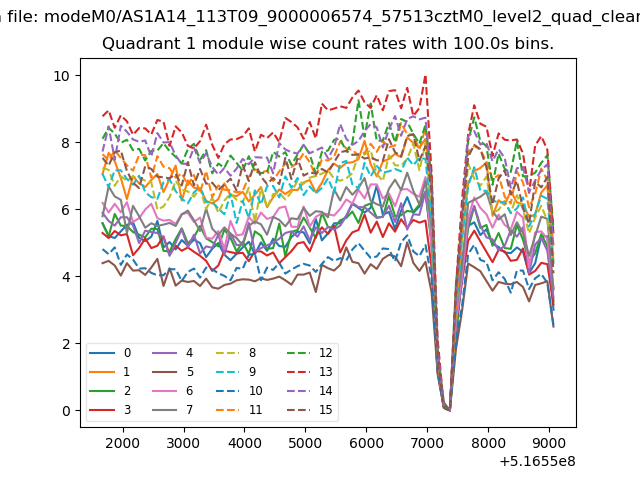
| Module-wise count rates for Quadrant A Data is divided into 100 sec bins |
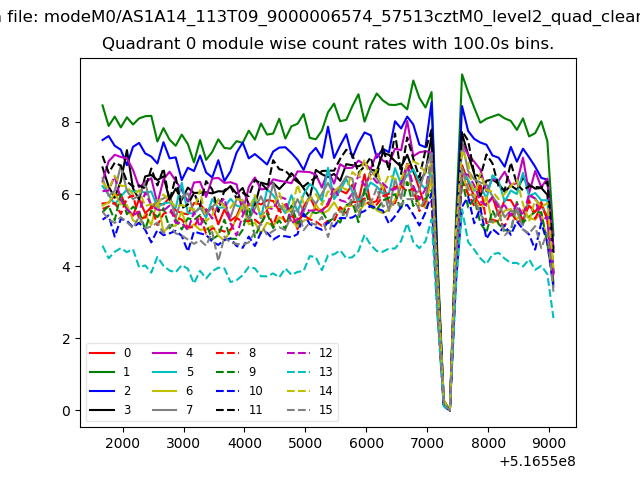 |
 |
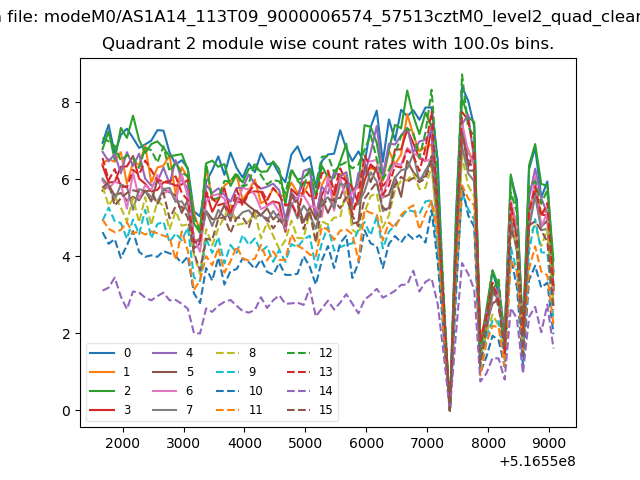
| Module-wise count rates for Quadrant B Data is divided into 100 sec bins |
 |
 |
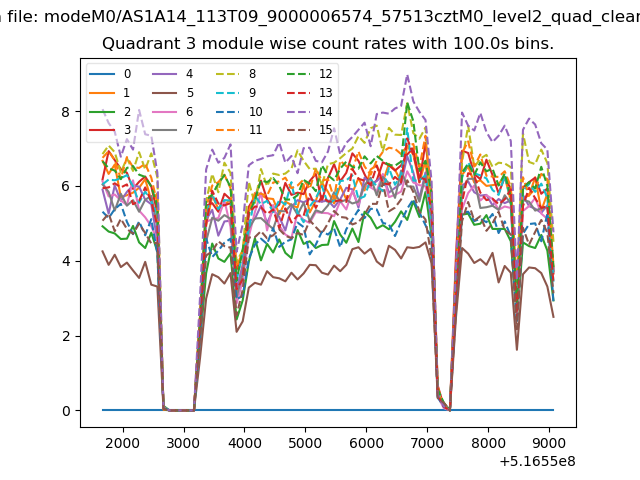
| Module-wise count rates for Quadrant C Data is divided into 100 sec bins |
 |
 |
| Module-wise count rates for Quadrant D Data is divided into 100 sec bins |
 |
 |
| Parameter | Plot |
|---|---|
| CZT HV Monitor |  |
| D_VDD | 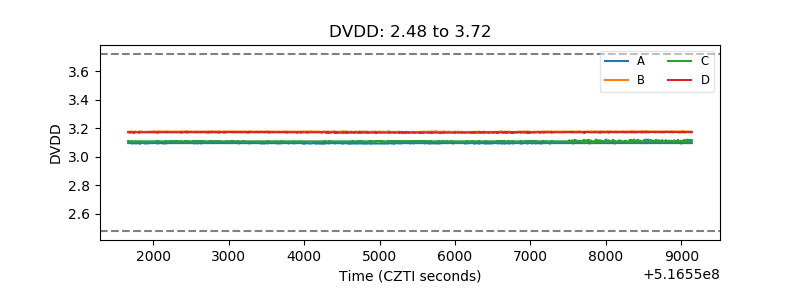 |
| Temperature 1 | 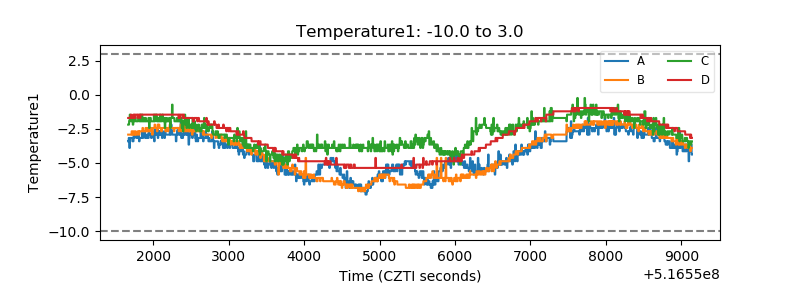 |
| Veto HV Monitor | 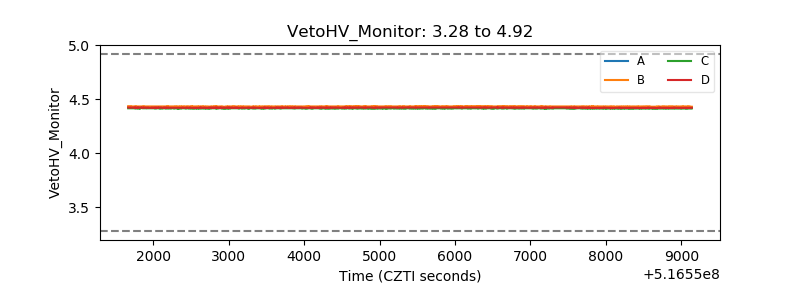 |
| Veto LLD | 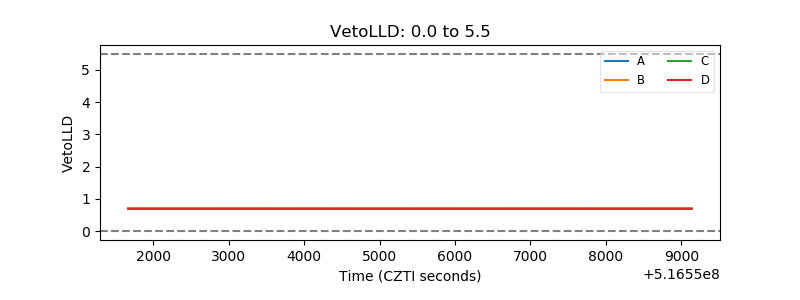 |
| Alpha Counter | 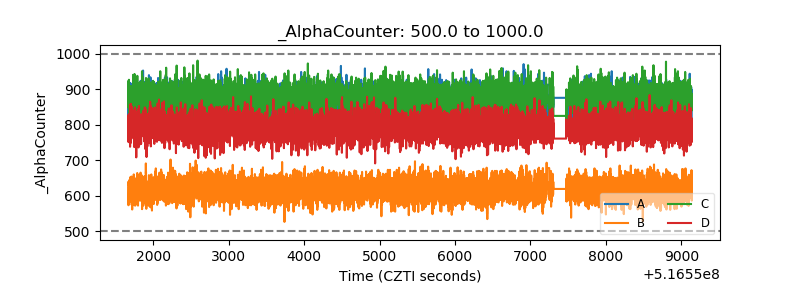 |
| _CPM_Rate | 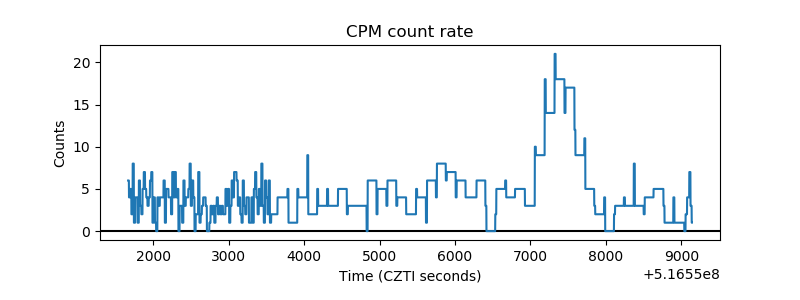 |
| CZT Counter | 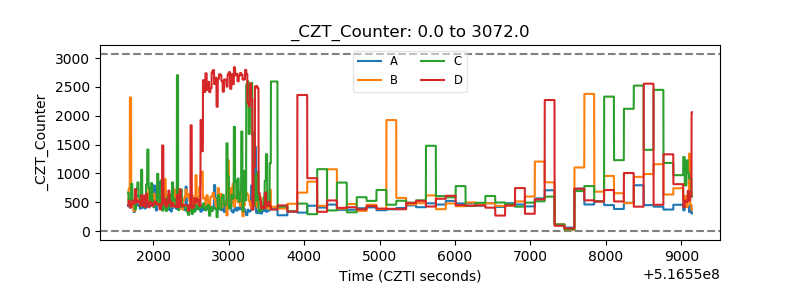 |
| +2.5 Volts monitor | 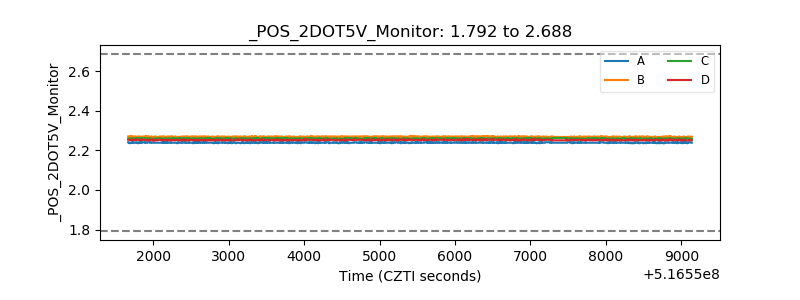 |
| +5 Volts monitor | 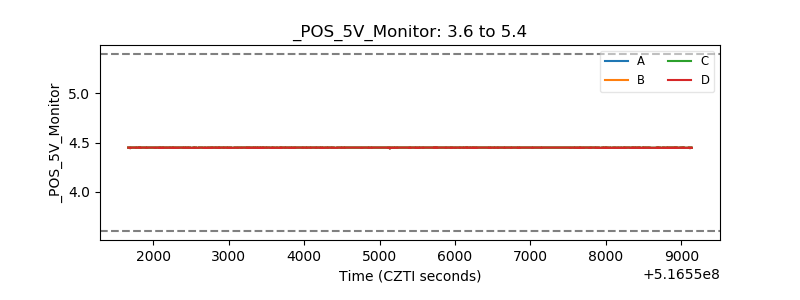 |
| _ROLL_ROT | 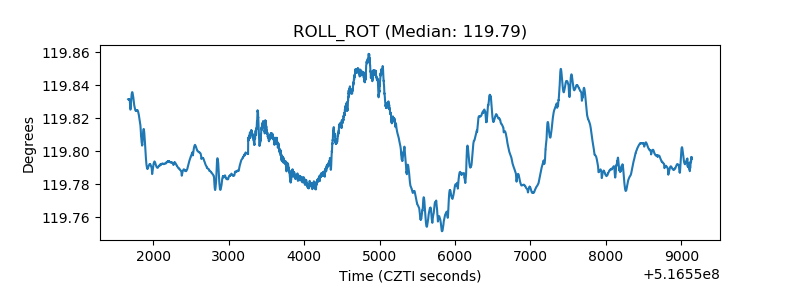 |
| _Roll_DEC | 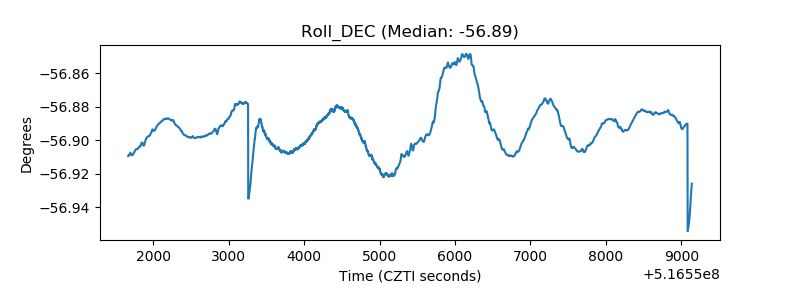 |
| _Roll_RA | 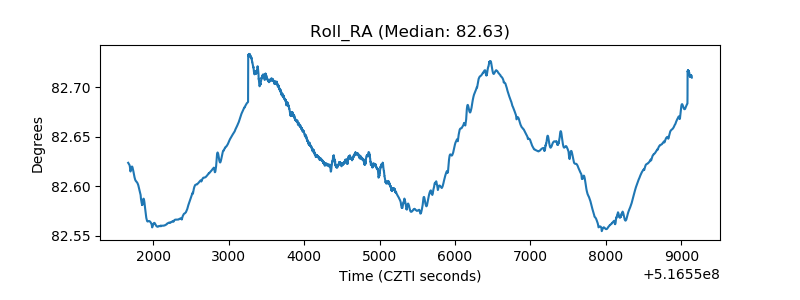 |
| Veto Counter | 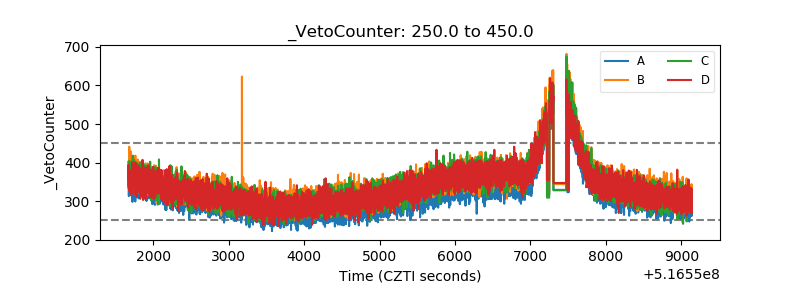 |